. 2025 Aug 6;23(1):872.
doi: 10.1186/s12967-025-06882-9.

GPD1L as a potential biomarker associated with Treg cell infiltration and lipid metabolism in clear cell renal cell carcinoma

Affiliations

GPD1L as a potential biomarker associated with Treg cell infiltration and lipid metabolism in clear cell renal cell carcinoma

Ming Yang et al. J Transl Med. .

Abstract

Background: Clear cell renal cell carcinoma (ccRCC) is a prevalent tumor in the urinary system, presenting a poor prognosis yet being accompanied by a high degree of immune infiltration. Understanding the mechanisms underlying this abnormal infiltration and identifying prognostic biomarkers in this regard is crucial for improving therapeutic outcomes.

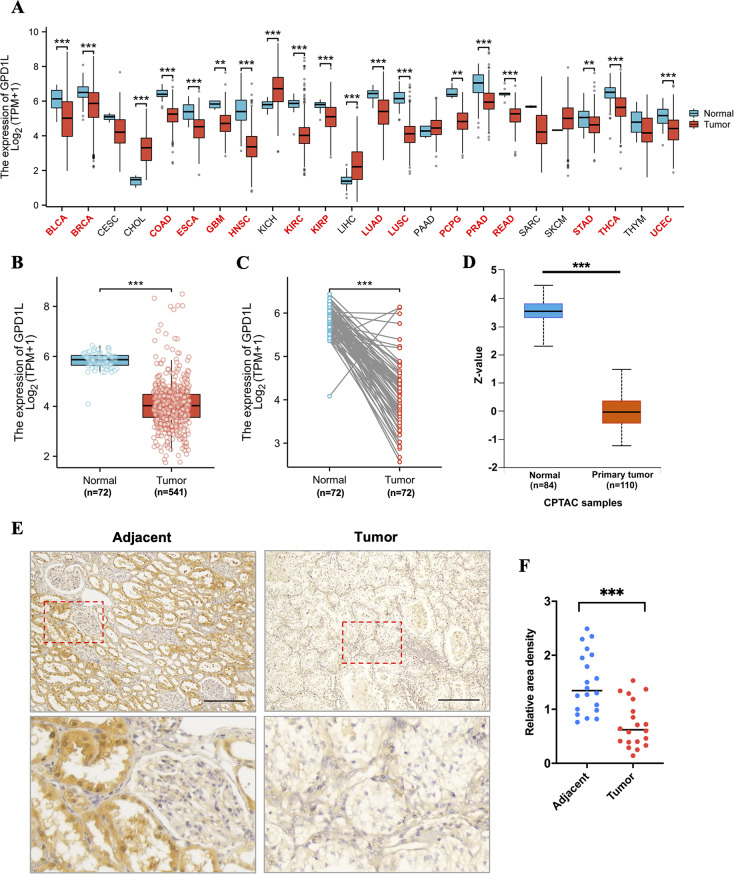
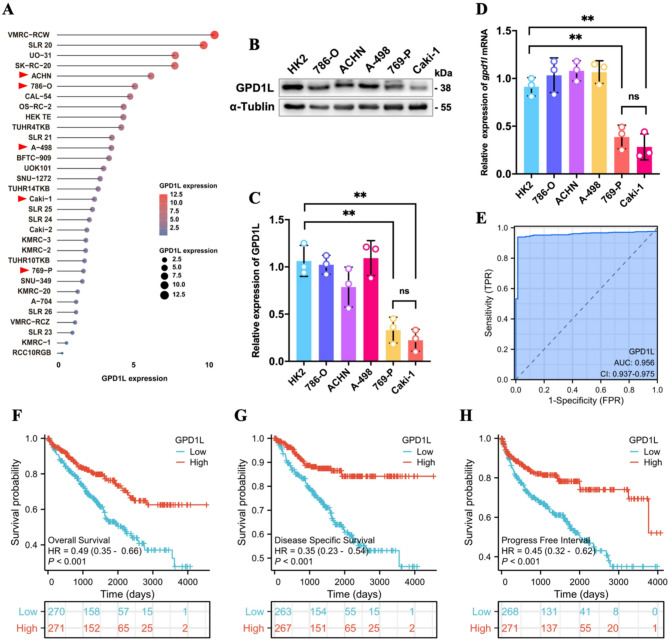
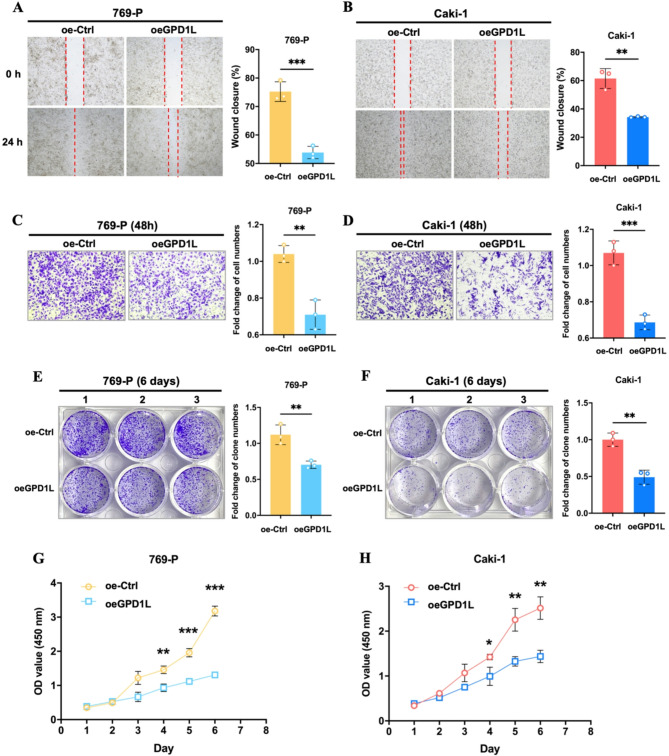
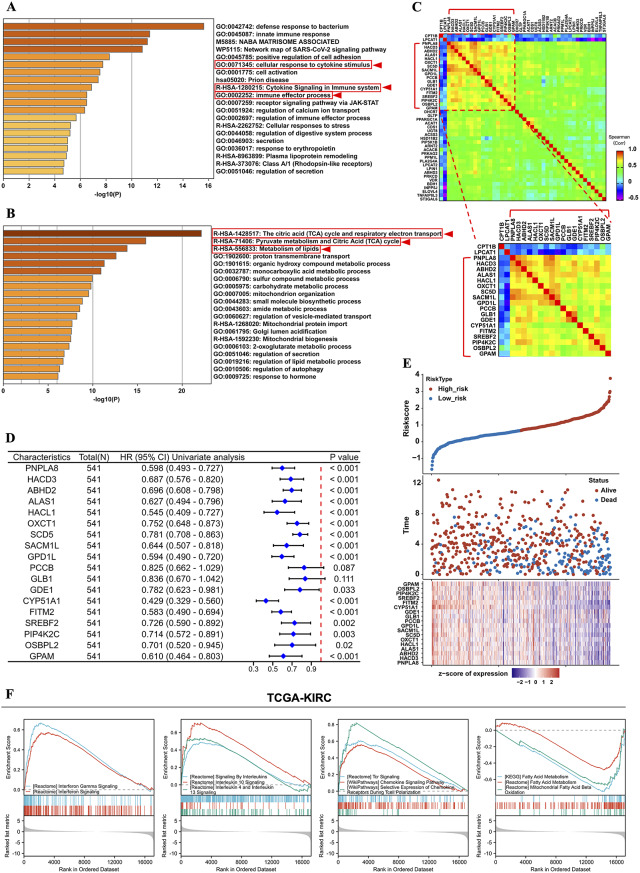
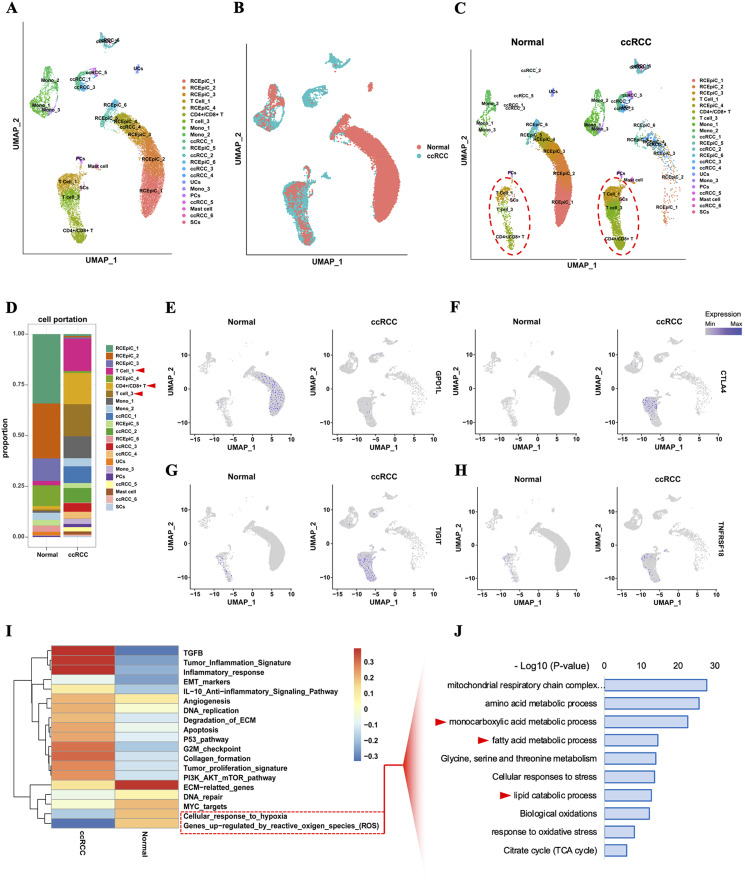
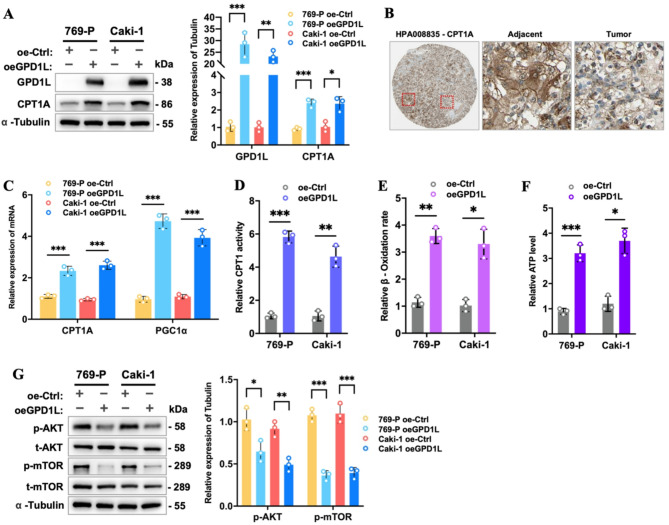
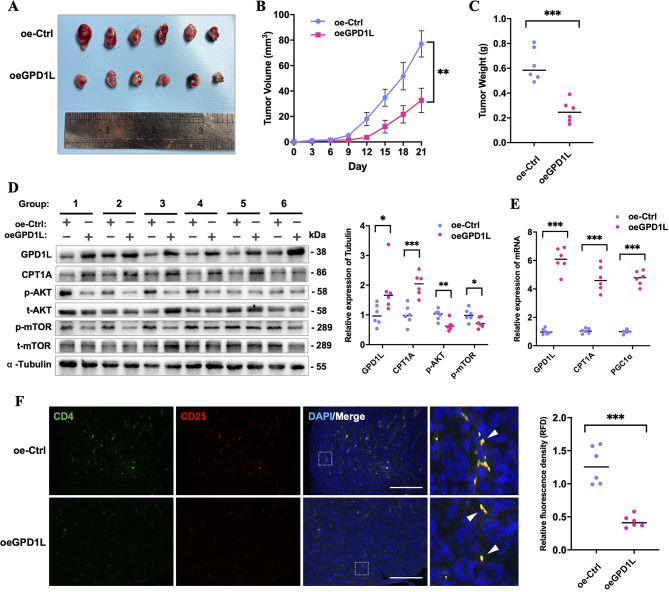
Methods: The expression of GPD1L in ccRCC was analyzed using a common database (TCGA). The expression of GPD1L in ccRCC cell lines and tissue samples was verified by western blotting, real time qPCR and immunohistochemistry. The predictive value of GPD1L was evaluated by survival analysis, ROC curve and Cox regression analysis. We used GO, KEGG and gene set enrichment analysis (GSEA) to verify each other. Then the single cell sequencing dataset (GEO) was further analyzed and verified, and the functional phenotype of GPD1L in ccRCC was explored by functional experiments. In addition, the correlation between the expression level of GPD1L and drug resistance of AKT-mTOR pathway was analyzed based on Genomics of Drug Sensitivity in Cancer database (GDSC).

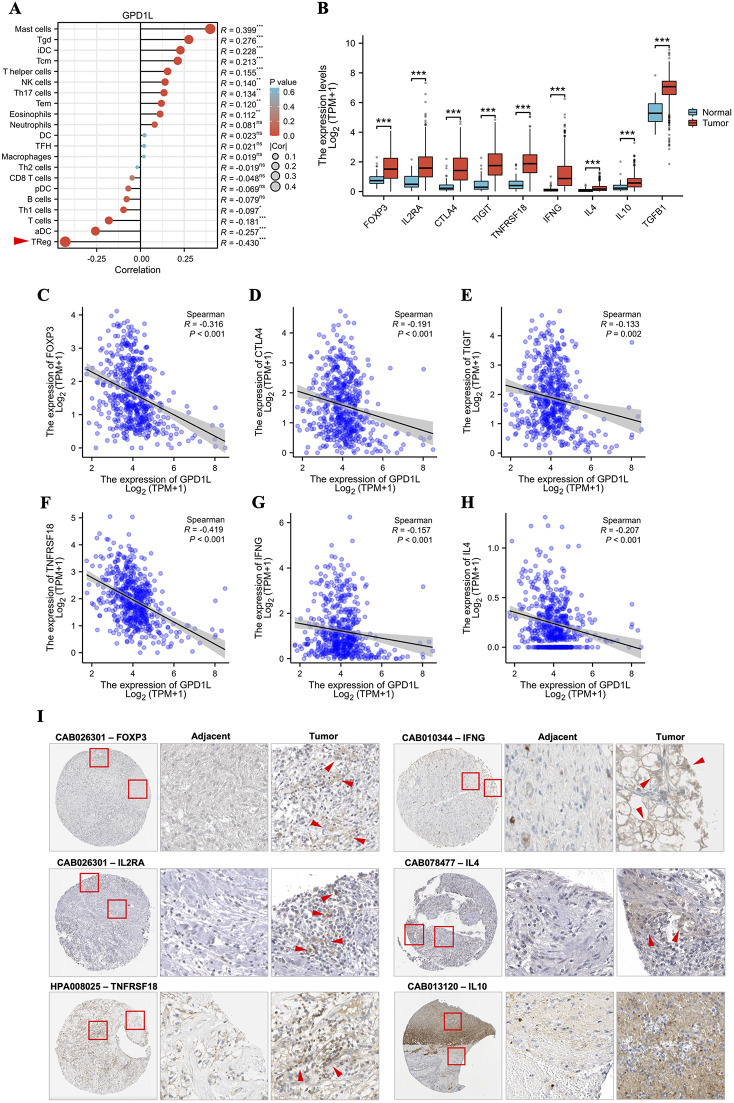
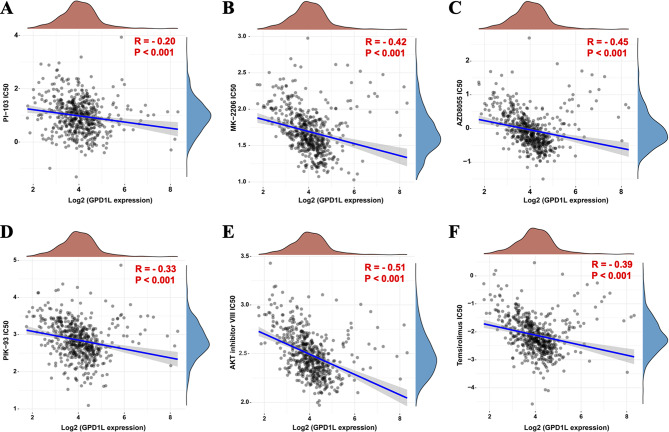
Results: We identified glycerol-3-phosphate dehydrogenase 1-like (GPD1L) as a tumor suppressor gene in ccRCC, and downregulation of GPD1L may facilitate the adaptive survival of tumor cells via enhanced regulatory T cells (Tregs) infiltration and lipid metabolism reprogramming in ccRCC. Our results suggest that there is a significantly diminished GPD1L in ccRCC patients with poorer survival probability. Mechanically, a significant negative correlation between GPD1L expression and Tregs infiltration, and GPD1L-related metabolic analysis reflected the correlation between Tregs and lipid metabolism. In addition, GPD1L expression levels also influence the malignant phenotype of ccRCC and the drug resistance to AKT and mTOR targeted therapy.

Conclusions: Taken together, our results supported GPD1L could be a valuable biomarker for predicting and intervening in ccRCC progression. These insights could shed light on the complex interplay between tumor cell adaptive survival and Treg infiltration, which reflected that the comprehensive and systemic role of GPD1L in ccRCC.

Supplementary Information: The online version contains supplementary material available at 10.1186/s12967-025-06882-9.

Keywords: Biomarker; CcRCC; GPD1L; Immune infiltration; Lipid metabolism; Treg.


Conflict of interest statement

Declarations. Ethics approval and consent to participate: The studies involving human participants were reviewed and approved by The Institutional Research Ethics Committee of Sichuan Provincial People’s Hospital. The patients/participants provided their written informed consent. Consent for publication: All personal data and samples involved in this study have been obtained with their knowledge and permission for publication. Competing interests: The authors declare that they have no competing interests.

Figures

Fig. 1
Fig. 1
Low expression of GPD1L in ccRCC. (A) Pan-cancer analysis of differences in GPD1L expression (**P < 0.01, ***P < 0.001). (B, C) Analysis of unpaired and paired expression of GPD1L in ccRCC samples from TCGA database (***P < 0.001). (D) Differential expression of GPD1L protein in normal and primary tumors for ccRCC from CPTAC database (***P < 0.001). (E) Immunohistochemical staining of GPD1L in tumor and adjacent tissues form ccRCC patients (Scale bar = 200 μm). (F) Dot plots represent statistical quantification with Mean ± SD from 20 clinical samples (***P < 0.001). TPM (Transcripts Per Million) is a commonly used method for normalizing gene expression levels, which adjusts the expression level of genes to the number per million transcripts. Z-values represent standard deviations from the median across samples for the given cancer type. Log2 Spectral count ratio values from CPTAC were first normalized within each sample profile, then normalized across samples. Relative Area Density (RAD) is an indicator for quantitatively evaluating the expression level of the target protein in tissue sections, and is usually used to measure the proportion and intensity of positive staining areas. RAD = (Positive staining area/total tissue area) × 100%
Fig. 2
Fig. 2
Expression level of GPD1L in ccRCC cell lines and survival analysis. (A) Expression levels of GPD1L mRNA in different renal carcinoma cell lines from CCLE. The graph illustrates the distribution of gene expression across different cell lines. The horizontal axis represents the expression level of the gene (normalized transcript per million, nPTM), while the vertical axis lists the different cell lines. The size of the dots in the graph reflects the level of gene expression, and the color of the dots also indicates the high or low expression levels. (B, C) Western blot analysis of GPD1L expression in cell lines HK2, 786-O, ACHN, 769-P, Caki-1 and A498. The statistical results were independently repeated for 3 times (Mean ± SD, **P < 0.01, “ns” indicates no significance). (D) The expression level of GPD1L in different renal cancer cell lines was verified by real time - qPCR (Mean ± SD, **P < 0.01, “ns” indicates no significance). (E) The clinical predictive value of GPD1L in ccRCC was analyzed by receiver operating characteristic curve (ROC). (F-H) Three Survival curve analysis of GPD1L for ccRCC clinical samples from TCGA database: Overall Survival (OS), Disease Specific Survival (DSS) and Progress Free Interval (PFI), respectively. Hazard Ratio (HR) is a core indicator used to measure the relative risk of events (such as death, etc.) occurring at a certain point in time for two groups of individuals (such as the high-expression group of genes vs. the low-expression group)
Fig. 3
Fig. 3
GPD1L can inhibit the malignant phenotype of ccRCC cell line. (A, B) The results of scratch healing assay of 769-P and Caki-1 (stable oeGPD1L), respectively (**P < 0.01, **P < 0.001). (C, D) The results of trans-well migration assay of 769-P and Caki-1 cells (stable oeGPD1L), respectively (**P < 0.01, **P < 0.001). The Fold Change is normalized based on the result of oe-GPD1L/oe-Ctrl. (E, F) The results of cell clonal formation of 769-P and Caki-1 cells (stable oeGPD1L), respectively (**P < 0.01). The Fold Change is normalized based on the result of oe-GPD1L/oe-Ctrl. (G, H) The results of cell proliferation assay of 769-P and Caki-1 cells (stable oeGPD1L), respectively (**P < 0.01, **P < 0.001). All the results were independently repeated for three times and expressed as Mean ± SD. The relative proliferation rate of cells = (OD450 value at each time point/OD450 value on the Day 1) × 100%
Fig. 4
Fig. 4
The Level of GPD1L is negatively correlated with infiltration of Treg cells in ccRCC. (A) The correlation analysis of GPD1L expression and immune cells in ccRCC (*P < 0.05, **P < 0.01, ***P < 0.001). (B) Differential expression of Treg cell related phenotypic genes and cytokines in ccRCC (***P < 0.001). (C-H) The scatter plot of correlation between FOXP3, CTLA4, TIGIT, TNFSRF18, IFNG, IL4 and Treg immunoinfiltration in ccRCC, respectively. (I) The results of immunohistochemical (IHC) images of Treg-associated phenotypes and cytokines in ccRCC from the HPA database. In the locally magnified IHC image, the red arrows indicate the distribution and expression abundance of proteins, and this indication forms a clear comparison with the results of adjacent tissues. The area with dense distribution of cell nuclei is a characteristic of concentrated tumor cells
Fig. 5
Fig. 5
Bioinformatics analysis of GPD1L and its related genes. (A-B) The results of GO/KEGG enrichment analysis of the genes that positive and negative correlated with GPD1L in ccRCC, respectively. (C) The heat map of gene correlation analysis from the item Lipid metabolism pathway (GO/KEGG enrichment analysis). (D) Univariate Cox regression analysis of 18 genes from the lipid metabolism pathway. (E) Analysis diagram of risk factors correlated with the expression of 18 genes from the lipid metabolic pathway. (F) GSEA analysis of differential genes in ccRCC from TCGA database (FDR < 0.25, P. adjust < 0.05)
Fig. 6
Fig. 6
Single-cell sequencing data verify the correlation between Treg infiltration and lipid metabolism. (A) UMAP plot showing the 22 major subtypes of cell clusters from Normal and ccRCC samples. (B) UMAP plot showing the merge mapping of cell clusters from Normal and ccRCC samples. (C) UMAP plot showing a comparison of differences in cell clusters from Normal and ccRCC samples. The red dotted circle shows the differential distribution of the three T cell clusters between the Normal and ccRCC samples. (D) Proportion distribution of 22 cell clusters in Normal and ccRCC samples, respectively. (E-H) UMAP plot shows the differential expression distribution of GPD1L and Treg immunosuppressive phenotypic genes CTLA4, TIGIT and TNFSRF18, respectively. The color scale represents normalized expression. Gray to purple: low to high expression. (I) The heat map of enrichment analysis based on single cell sequencing (scRNA-seq) for cell cluster RCEpic and ccRCC. (J) Bar chart for GO/KEGG enrichment analysis of the genes contained by cell response to hypoxia and gene upregulated by ROS entries from Fig. 4 (I)
Fig. 7
Fig. 7
Effects of GPD1L on fatty acid metabolism in ccRCC cells. (A) Western blot analyses the expression of GPD1L and CPT1A in stable cell lines of 769-P and Caki-1 with oeGPD1L. Statistical analysis was conducted using the gray values of GPD1L or CPT1A /Tubulin for normalization processing, (*P < 0.05, **P < 0.01, ***P < 0.001). (B) Immunohistochemical images of CPT1A in kidney cancer tissues from the HPA database. (C) qPCR detected the mRNA expression of CPT1A and PGC1α in stable cell lines of 769-P and Caki-1 with oeGPD1L. The q-PCR was used for relative quantification by the ΔΔCt method, and oe-Ctrl was set as the control group for normalization processing, (***P < 0.001). (D-F) represents the results of CPT1 enzyme activity, β oxidation rate, and relative ATP levels in 769-P and Caki-1 cells, respectively. The measured values of CPT1A activity, β -oxidation and ATP level were normalized as the oe-GPD1L group /oe-Ctrl group during the statistical analysis process. (*P < 0.05, **P < 0.01, ***P < 0.001). (G) Western blot analyses the expression of AKT and mTOR in stable cell lines of 769-P and Caki-1 with oeGPD1L. The p-/t- AKT, mTOR protein represents gray value of the phosphorylated protein/the total protein. Statistical analysis was normalized based on the gray values of the (p-/t-AKT, mTOR)/α-Tubulin, (*P < 0.05, **P < 0.01, ***P < 0.001)
Fig. 8
Fig. 8
Functional Validation of GPD1L for the correlation between Treg infiltration and lipid metabolism. (A) Tumor samples from subcutaneous tumor formation assay in Balb/c mice (n = 6) via inject with stable cell lines of Renca (Ctrl and oeGPD1L), respectively. (B) The change of tumor volume during subcutaneous tumor formation assay. The length, width and thickness of the tumor were measured by using a vernier caliper. The volume of the tumor is calculated according to volume = length × width × thickness. (**P < 0.01). (C) The weight statistics of the tumor at 21 days of subcutaneous tumor formation assay (n = 6, ***P < 0.001). (D) Western blot analyses the expression of GPD1L, CPT1A, AKT and mTOR in tumors of inject with stable cell lines of Renca (Ctrl and oeGPD1L, n/n = 6/6) (*P < 0.05, **P < 0.01, ***P < 0.001). (E) qPCR detected the mRNA expression of GPD1L, CPT1A and PGC1α in tumors of inject with stable cell lines of Renca (Ctrl and oeGPD1L, n/n = 6/6) (*P < 0.05, **P < 0.01, ***P < 0.001). (F) The distribution density of Treg cells (Markers: CD4, green; CD25, red) in paraffin sections of tumor was detected by immunofluorescence (Ctrl and oeGPD1L, n/n = 6/6, scale bar = 200 μm). Statistical analysis of the distribution density for Treg in tumors (Ctrl and oeGPD1L, n/n = 6/6) (***P < 0.001). The above experimental results are expressed as Mean ± SD, and the results in Fig. 7A-D are independent repeated experiments for three times
Fig. 9
Fig. 9
The expression level of GPD1L was negatively correlated with the sensitivity of ccRCC cells for the drugs (AKT-mTOR target inhibitors). (A-F) Scatter plot of correlation between the expression level of GPD1L and drug PI-103, MK-2206, AZD8055, PIK-93, AKT inhibitor and Temsirolimus sensitivity (IC50) in ccRCC cells, respectively

Similar articles

References

    1. Hsieh JJ, Purdue MP, Signoretti S, Swanton C, Albiges L, Schmidinger M, Heng DY, Larkin J, Ficarra V. Renal cell carcinoma. Nat Rev Dis Primers. 2017;3:17009. - PMC - PubMed
    1. Jonasch E, Walker CL, Rathmell WK. Clear cell renal cell carcinoma ontogeny and mechanisms of lethality. Nat Rev Nephrol. 2021;17(4):245–61. - PMC - PubMed
    1. Diaz-Montero CM, Rini BI, Finke JH. The immunology of renal cell carcinoma. Nat Rev Nephrol. 2020;16(12):721–35. - PubMed
    1. Wettersten HI, Aboud OA, Lara PN Jr., Weiss RH. Metabolic reprogramming in clear cell renal cell carcinoma. Nat Rev Nephrol. 2017;13(7):410–9. - PubMed
    1. Shan Y, Xie T, Sun Y, Lu Z, Topatana W, Juengpanich S, Chen T, Han Y, Cao J, Hu J, et al. Lipid metabolism in tumor-infiltrating regulatory T cells: perspective to precision immunotherapy. Biomark Res. 2024;12(1):41. - PMC - PubMed

LinkOut - more resources