

CREB5 promotes tumorigenicity and upregulates druggable cell surface modalities in basal-like breast cancer
- PMID: 40770411
- PMCID: PMC12328604
- DOI: 10.1038/s41698-025-01051-z
CREB5 promotes tumorigenicity and upregulates druggable cell surface modalities in basal-like breast cancer
Abstract
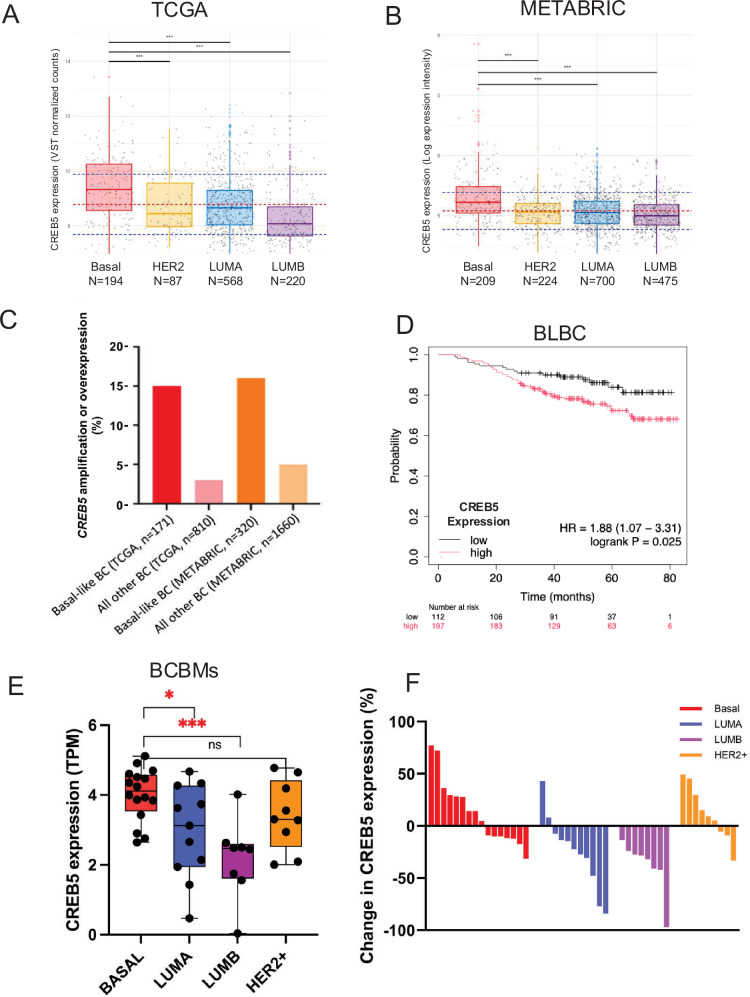
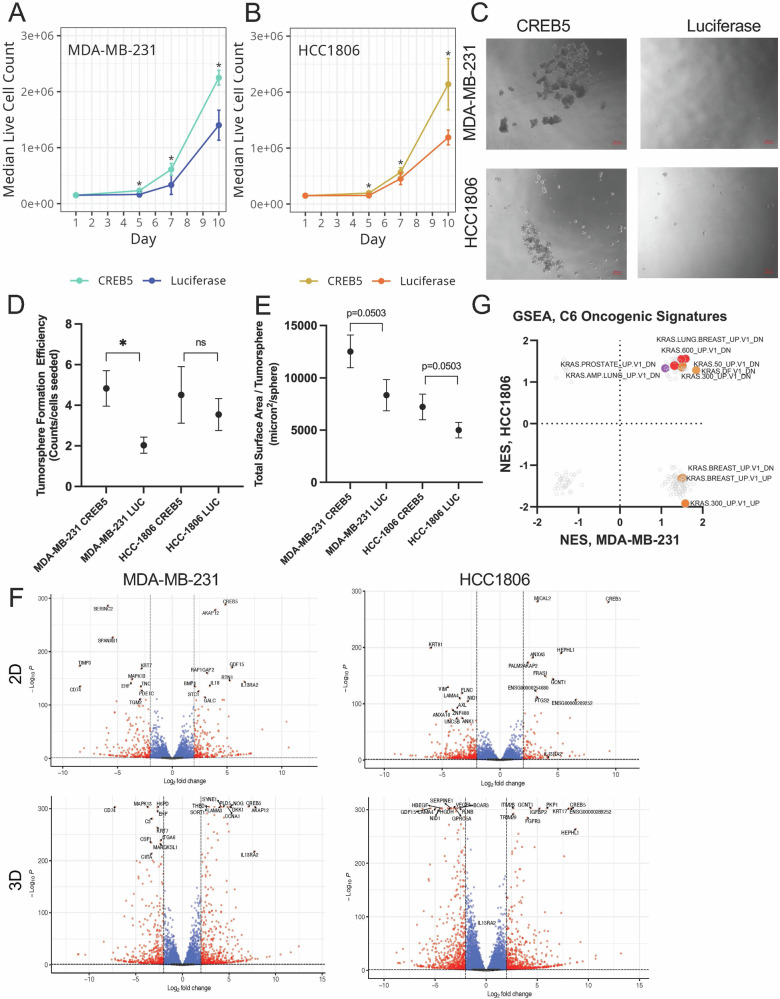
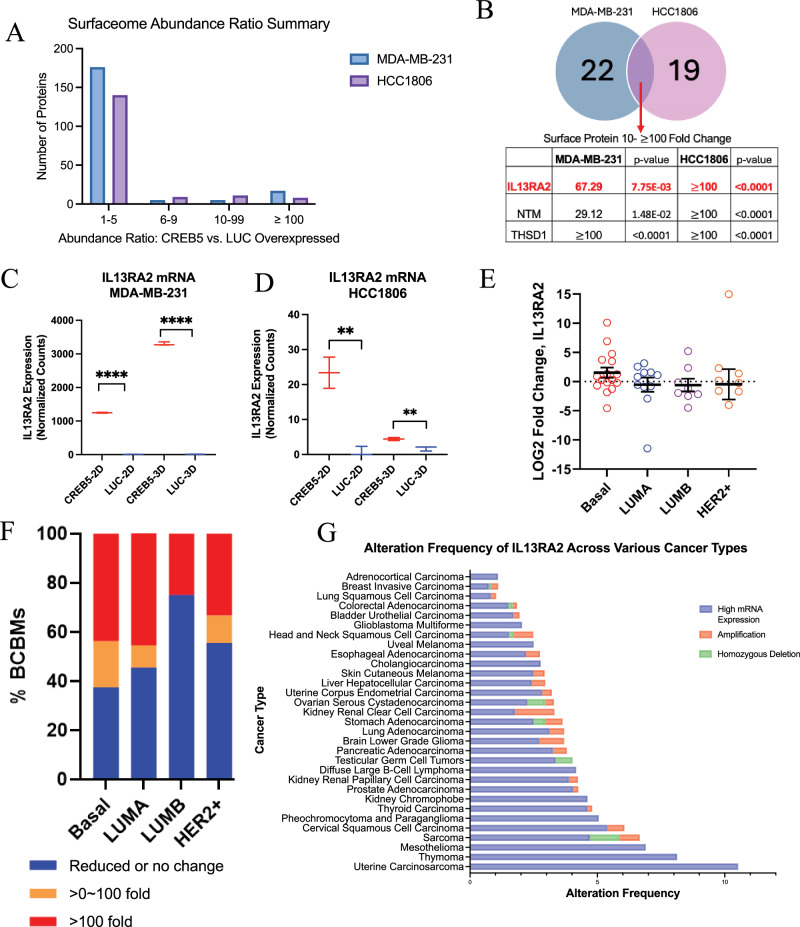
Basal-like breast cancers (BLBC) have limited targeted therapies and poor outcomes. We found that CREB5 is a transcription factor overexpressed in 15% of BLBCs and was upregulated in breast cancers that metastasize to the brain. In cell lines, CREB5 overexpression regulated cell phenotypes and transcriptional changes, including IL13RA2, a cell surface receptor that is currently druggable and represents a novel target in BLBC.
© 2025. The Author(s).
Conflict of interest statement
Competing interests: A.M. consults for EMRGNSE LLC, but the business of this company is unrelated to the contents of this manuscript. E.B. consults for Tempus and EMRGNSE LLC, but the business of these companies is unrelated to the contents of this manuscript. H.E.B. is a co-founder of EMRGNSE LLC, but the business of this company is unrelated to the contents of this manuscript. D.M. consults for Tempus, but the business of these companies is unrelated to the contents of this manuscript. J.H. consults for Tempus and is a co-founder of EMRGNSE LLC, but the business of these companies is unrelated to the contents of this manuscript. J.M.D. has no conflicts relevant to this work. However, he serves as a consultant and Chief Scientific Officer of Astrin Biosciences. The interest related to J.M.D. has been reviewed and managed by the University of Minnesota in accordance with its Conflict-of-Interest policies. D.A.L. is the co-founder and co-owner of NeoClone Biotechnologies, Inc., Discovery Genomics, Inc. (recently acquired by Immusoft, Inc.), B-MoGen Biotechnologies, Inc. (recently acquired by Bio-Techne Corporation), and Luminary Therapeutics, Inc. D.A.L. holds equity in, serves as a Senior Scientific Advisor for and Board of Director member for Recombinetics, a genome editing company. The business of all these companies is unrelated to the contents of this manuscript. D.A.L. consults for Styx Therapeutics, Inc. and Genentech, Inc., which is funding some of his research. E.S.A. reports grants and personal fees from Janssen, Sanofi, Bayer, Bristol Myers Squibb, Curium, Merck, Pfizer, AstraZeneca, Clovis, Constellation; personal fees from Astellas, Amgen, Blue Earth, Exact Sciences, Invitae, Eli Lilly, and Foundation Medicine; grants from Novartis, Celgene, and grants from Orion outside the submitted work; and has a patent for an AR-V7 biomarker technology that has been licensed to Qiagen.
Figures
Similar articles
-
Sun protection for preventing basal cell and squamous cell skin cancers.Cochrane Database Syst Rev. 2016 Jul 25;7(7):CD011161. doi: 10.1002/14651858.CD011161.pub2. Cochrane Database Syst Rev. 2016. PMID: 27455163 Free PMC article.
-
Loss of tumor suppressor p53 upregulates stem cell factor SOX9 via Notch signaling.bioRxiv [Preprint]. 2025 May 31:2025.05.27.656408. doi: 10.1101/2025.05.27.656408. bioRxiv. 2025. PMID: 40501825 Free PMC article. Preprint.
-
Loss of IL13RA2 promotes metastatic tumor growth in triple-negative breast cancer via increased AKT and NF-κB signaling.Clin Exp Metastasis. 2025 Jul 15;42(5):40. doi: 10.1007/s10585-025-10362-1. Clin Exp Metastasis. 2025. PMID: 40663259 Free PMC article.
-
ERCC1/NGFR affects prognosis in basal-like breast cancer.Eur J Med Res. 2025 Jul 9;30(1):597. doi: 10.1186/s40001-025-02807-w. Eur J Med Res. 2025. PMID: 40629424 Free PMC article.
-
Prognostic factors for return to work in breast cancer survivors.Cochrane Database Syst Rev. 2025 May 7;5(5):CD015124. doi: 10.1002/14651858.CD015124.pub2. Cochrane Database Syst Rev. 2025. PMID: 40331515 Review.
References
-
- Siegel, R. L., Miller, K. D., Wagle, N. S. & Jemal, A. Cancer statistics, 2023. CA Cancer J. Clin.73, 17–48 (2023). - PubMed
-
- Wu, Z. et al. Identification of CREB5 as a prognostic and immunotherapeutic biomarker in glioma through multi-omics pan-cancer analysis. Comput. Biol. Med. 173, (2024). - PubMed
Grants and funding
LinkOut - more resources
Full Text Sources
