. 2025 Sep;28(9):1858-1867.
doi: 10.1038/s41593-025-02010-4. Epub 2025 Aug 6.

Hypoxia ameliorates neurodegeneration and movement disorder in a mouse model of Parkinson's disease

Affiliations

Hypoxia ameliorates neurodegeneration and movement disorder in a mouse model of Parkinson's disease

Eizo Marutani et al. Nat Neurosci. 2025 Sep.

Abstract

Parkinson's disease (PD) is characterized by inclusions of α-synuclein (α-syn) and mitochondrial dysfunction in dopaminergic (DA) neurons of the substantia nigra pars compacta (SNpc). Patients with PD anecdotally experience symptom improvement at high altitude; chronic hypoxia prevents the development of Leigh-like brain disease in mice with mitochondrial complex I deficiency. Here we report that intrastriatal injection of α-syn preformed fibrils (PFFs) in mice resulted in neurodegeneration and movement disorder, which were prevented by continuous exposure to 11% oxygen. Specifically, PFF-induced α-syn aggregation resulted in brain tissue hyperoxia, lipid peroxidation and DA neurodegeneration in the SNpc of mice breathing 21% oxygen, but not in those breathing 11% oxygen. This neuroprotective effect of hypoxia was also observed in Caenorhabditis elegans. Moreover, initiating hypoxia 6 weeks after PFF injection reversed motor dysfunction and halted further DA neurodegeneration. These results suggest that hypoxia may have neuroprotective effects downstream of α-syn aggregation in PD, even after symptom onset and neuropathological changes.


Conflict of interest statement

Competing interests: V.K.M. is listed as an inventor on patents filed by MGH on the therapeutic uses of hypoxia. V.K.M. is a paid adviser to 5AM Ventures and Falcon Bio.

Figures

Fig. 1
Fig. 1. Hypoxia treatment prevents α-syn aggregate-induced loss of DA neurons in the SNpc and movement disorder.
a, Schematic depicting the experimental groups and timeline. b, Schematic depicting stereological cell counting in the SNpc. The total number of TH+ neurons in the entire SNpc was counted at an average of six sections per animal. c, Representative photomicrograph of SNpc immunostained for phosphorylated α-syn in mice treated with PFF or α-syn monomer and exposed to 21% or 11% O2 for 12 weeks, with a schematic indicating the location of the SNpc captured. d, Deposition score of phosphorylated α-syn in the SNpc of mice treated with PFF or α-syn monomer and exposed to 21% or 11% O2 for 12 weeks. c,d, Number of mice in each group: 21% O2, monomer (n = 6); 21% O2, PFF (n = 6); 11% O2, monomer (n = 6); and 11% O2, PFF (n = 7). A two-way analysis of variance (ANOVA) followed by Tukey’s correction for post-hoc comparisons was conducted. e, Representative photomicrograph of SNpc immunostained for TH in mice treated with PFF or α-syn monomer and exposed to 21% or 11% O2 for 12 weeks. f, Number of stereologically counted TH+ neurons in the SNpc of mice treated with PFF or α-syn monomer and exposed to 21% or 11% O2 for 12 weeks (n = 16 mice in each group). A two-way ANOVA followed by Tukey’s correction for post-hoc comparisons was conducted. gj, Results of the pole (g) and cage hang (h) tests, time spent in the inner zone (i) and total distance (j) in the open field test in mice treated with PFFs or α-syn monomer and exposed to 21% or 11% O2 for 12 weeks (n = 24 in each group in g and h). i,j, n = 16 in each group. gj, A two-way ANOVA, followed by Šídák’s correction for post-hoc comparisons, was conducted. k, Heatmap showing the location of mice during the open field test. Each image shows the average latency of mice in each group. d,fj, Data are presented as box plots showing the median value and interquartile range (IQR), with the whiskers denoting the maximum and minimum values. c,e, Scale bars, 100 μm. Source data
Fig. 2
Fig. 2. Hypoxia prevents PFF-induced tissue hyperoxia and lipid peroxidation in the SNpc of mice.
a, Representative photomicrograph of Perls-DAB-stained SNpc in mice treated with PFF or α-syn monomer and breathing 21% or 11% O2 for 12 weeks. b, Ratio of Perls-DAB+ area to SNpc area in mice treated with PFF or α-syn monomer and breathing 21% or 11% O2 for 12 weeks. a,b, n = 4 for mice injected with α-syn monomer; n = 11 or 12 for mice injected with PFF. c, Brain tissue pO2 in the SNpc of mice treated with PFF or α-syn monomer and breathing 21% or 11% O2 for 6 weeks. n = 6 in each group. d, MDA levels in the SN of mice treated with PFF or α-syn monomer and breathing 21% or 11% O2 for 6 weeks. n = 6 in each group. A two-way ANOVA followed by Tukey’s correction for post-hoc comparisons was conducted. bd, Data are presented as box plots showing the median and IQR, with the whiskers denoting the maximum and minimum values. a, Scale bars, 100 μm. SNpr, substantia nigra pars reticulata. Source data
Fig. 3
Fig. 3. PFF-induced α-syn aggregates result in dramatic transcriptomic changes in the SN in mice breathing 21% O2, but not in mice breathing 11% O2.
a, Volcano plot showing the log2 fold change of transcripts in the SN 12 weeks after striatal injection of PFF versus α-syn monomer in mice breathing 21% O2, plotted against the −log10(Padj). Significantly changing genes (log2fold change > 0.25, Padj < 0.05 from a DESeq2 Wald test with multiple testing using the Benjamini–Hochberg procedure) are denoted in black. b, Volcano plot showing the log2fold change of transcripts in the SN 12 weeks after striatal injection of PFF versus α-syn monomer in mice breathing 11% O2, plotted against the −log10(Padj). Significantly changing genes (log2fold change > 0.25, Padj < 0.05) are denoted in black. c,d, Box plot showing Tfrc (c) and Slc40a1 (Fpn) (d) expression. Significance is indicated using Padj calculated in the DESeq2 analysis of all genes (that is, DESeq2 Wald test with multiple testing correction using the Benjamini–Hochberg procedure). e, Box plot showing HIF targets upregulated in the SN of mice breathing 11% O2. The y axes in the box plots represent the transcripts per million (TPM) normalized for each gene to the mean TPM of α-syn-monomer-treated mice breathing 21% O2. The box plots are annotated with the adjusted P values calculated in the DESeq2 analysis of all genes (that is, DESeq2 Wald test with multiple testing correction using the Benjamini–Hochberg procedure). ae, The number of mice in each group was 21% O2, monomer (n = 11); 21% O2, PFF (n = 12); 11% O2, monomer (n = 9); and 11% O2, PFF (n = 10). f, Box plot showing HIF target proteins upregulated in the SN of mice breathing 11% O2. The y axes in the box plots represent the TMT intensity normalized for each gene to the mean intensity of α-syn-monomer-treated mice breathing 21% O2. The number of mice in each group was 21% O2, monomer (n = 3); 21% O2, PFF (n = 4); 11% O2, monomer (n = 3); and 11% O2, PFF (n = 3). Box plots are annotated with the adjusted P values calculated in the differential expression analysis of all proteins using limma (that is, a two-tailed moderated t-test with multiple testing correction using the Benjamini–Hochberg procedure). For all box plots, the center line shows the median, the box shows the IQR and the whiskers show the extent of the data distribution up to 1.5 times the IQR. Source data
Fig. 4
Fig. 4. Breathing 11% O2 remains beneficial 10 months after PFF-induced α-syn aggregation.
a, Schematic depicting the experimental groups and timeline. b,c, Results of the pole (b) and cage hang (c) tests in mice treated with PFF or α-syn monomer and exposed to 21% or 11% O2 for 10 months. b,c, The number of mice in each group was 21% O2, monomer (n = 8); 21% O2, PFF (n = 6); 11% O2, monomer (n = 8); and 11% O2, PFF (n = 7). d, Relative gene expression levels of Vegfa, Kdr and Adm in the SN of mice treated with PFF or α-syn monomer and exposed to 21% or 11% O2 for 10 months. The number of mice in each group was 21% O2, monomer (n = 8); 21% O2, PFF (n = 5 for Vegfa, n = 6 for Kdr and Adm); 11% O2, monomer (n = 8); and 11% O2, PFF (n = 7). bd, A two-way ANOVA followed by Dunnett’s correction for post-hoc comparisons was conducted. Data are presented as box plots showing the median value and IQR, with the whiskers denoting the maximum and minimum values. Source data
Fig. 5
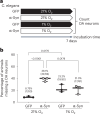
Fig. 5. Hypoxia prevents the loss of DA neurons in C. elegans overexpressing α-syn.
a, Schematic depicting the experimental groups and timeline. b, Percentage of C. elegans in which at least one DA cephalic (CEP) neuron is absent at day 7 of adulthood. Each point represents one cohort in which approximately 30 animals were analyzed (the number of C. elegans in each group was 21% O2, GFP (n = 80); 21% O2, α-syn (n = 84); 1% O2, GFP (n = 82); and 1% O2, α-syn (n = 81)). b, Data are presented as a box plot showing the median and IQR, with the whiskers denoting the maximum and minimum values. A Fisher’s exact test was conducted to compare each of two groups with a two-sided P value. Source data
Fig. 6
Fig. 6. Breathing 11% O2 starting 6 weeks after PFF injection reverses movement disorders and further loss of DA neurons in the SNpc.
a, Schematic depicting the experimental groups and time course. b,c, Results of pole (b) and cage hang (c) tests in mice that had a PFF injection in the ‘PFF, Nx-Nx’ and ‘PFF, Nx-Hx’ groups. n = 12 in each group. b,c, A two-way ANOVA followed by Tukey’s correction for post-hoc comparisons was conducted. Data are presented as the mean + s.e.m. *P < 0.05, **P < 0.01, ***P < 0.001 or ****P < 0.0001 versus day 0 in the same group, or #P < 0.05 or ###P < 0.001 versus the ‘PFF, Nx-Nx’ group at the same time point. d,e, Time in the inner zone (d) and the total distance (e) in the OFT in mice that were injected with the α-syn monomer or PFF in the ‘mon, Nx-Nx’, ‘PFF, Nx’, ‘PFF, Nx-Nx’ and ‘PFF, Nx-Hx’ groups. n = 12 in each group. d,e, A one-way ANOVA followed by Tukey’s correction for post-hoc comparisons was conducted. f, Heatmap showing the location of mice during the OFT. Each image shows the average latency of mice in each group. g, Deposition score of phosphorylated α-syn in the SNpc in mice that were treated with PFF in the ‘PFF, Nx’, ‘PFF, Nx-Nx’ and ‘PFF, Nx-Hx’ groups. n = 12 in each group. h, Representative photomicrograph of the SNpc stained for phosphorylated α-syn in mice injected with PFF in the ‘PFF, Nx’, ‘PFF, Nx-Nx’ and ‘PFF, Nx-Hx’ groups. n = 12 in each group. i, Number of TH+ neurons in the SNpc in mice treated with α-syn monomer or PFF in the ‘mon, Nx-Nx’, ‘PFF, Nx’, ‘PFF, Nx-Nx’ and ‘PFF, Nx-Hx’ groups. n = 12 in each group. j, Representative photomicrograph of the SNpc stained for TH in mice injected with α-syn monomer or PFF in the ‘mon, Nx-Nx’, ‘PFF, Nx’, ‘PFF, Nx-Nx’ and ‘PFF, Nx-Hx’ groups. n = 12 in each group. Nx, normoxia (breathing 21% O2); Hx, hypoxia (breathing 11% O2). g,i, A one-way ANOVA followed by Tukey’s correction for post-hoc comparisons was conducted. d,e,g,h, Data are presented as box plots showing the median and IQR, with the whiskers denoting the maximum and minimum values. h,j, Scale bars, 100 μm. Source data
Extended Data Fig. 1
Extended Data Fig. 1. Impact of PFF injection and hypoxia treatment on body weight, hemoglobin concentration and performance of behavior tests.
Changes in body weight (a) and hemoglobin concentration (b) in mice breathing 21% or 11% O2 for 12 weeks after injection of monomer or PFF. N = 8 in each group. Two-way ANOVA followed by Tukey’s correction for post-hoc comparisons was conducted for panel (a) and (b). The Pearson correlation coefficient (r) with two-tailed hypothesis was calculated for panel (c) and (d). N = 32. Source data
Extended Data Fig. 2
Extended Data Fig. 2. RNA-seq, TMT proteomics, qPCR.
(a) and (b): Venn diagrams show the numbers of shared and distinct downregulated (a) and upregulated (b) genes when comparing the transcriptomic effects of hypoxia treatment (11% O2, monomer vs 21% O2, monomer) to the effects of PFF treatment (21% O2, PFF vs 21% O2, monomer). (c) and (d): Heatmaps show the z-score scaled expression across condition for all 186 downregulated genes (c) and all 271 upregulated genes (d) in the 21% O2, PFF versus 21% O2, monomer comparison. Columns (genes) were hierarchically clustered using fastcluster.linkage (v1.2.6), with metric=euclidean and method=single. N = 12 in each group. Results of RT-qPCR for Iba1 (e), Vegfa (f), Tfrc (g), Slc16a3 (h) and Slc40a1 (i). N = 3-8. Two-way ANOVA followed by Dunnett’s correction for post-hoc comparisons was conducted for panel (ei). Source data
Extended Data Fig. 3
Extended Data Fig. 3. Impact of PFF injection and hypoxia treatment on body weight and performance of behavior tests.
Changes in body weight (a) in mice breathing 21% or 11% O2 for 10 months after injection of monomer or PFF. N = 6-8 in each group. Two-way ANOVA followed by Tukey’s correction for post-hoc comparisons was conducted for panel (a). The Pearson correlation coefficient (r) with two-tailed hypothesis was calculated for panel (b) and (c). N = 29. Source data
Extended Data Fig. 4
Extended Data Fig. 4. Representative images of C. elegans expressing GFP alone or α-syn and GFP.
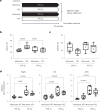
C. elegans normally have four DA CEP neurons in the head. In animals grown in 21% O2, four DA CEP neurons are present in the wild-type animal (dat-1::gfp) and three visible in this focal plane. Only three DA neurons are present in the transgenic animal expressing α-syn (dat-1::α-syn + dat-1::gfp). Lower GFP fluorescence in the α-syn-expressing animal is indicative of neurons in the process of degeneration.
Extended Data Fig. 5
Extended Data Fig. 5. Impact of PFF injection and hypoxia treatment on body weight, hemoglobin concentration and performance of behavior tests.
Changes in body weight (a) and hemoglobin concentration (b) in mice breathing 21% or 11% O2 for 12 weeks after injection of monomer or PFF. N = 12 in each group. Two-way ANOVA followed by Tukey’s correction for post-hoc comparisons was conducted for panel (a). Two-tailed t-test was conducted for panel (b). The Pearson correlation coefficient (r) with two-tailed hypothesis was calculated for panel (c) and (d). N = 16. Source data
Extended Data Fig. 6
Extended Data Fig. 6. Mild RNA-seq batch effect is successfully mitigated after correction.
Pairs of principal components analysis plots of the uncorrected data (a) and corrected data (b), with the left plot in each pair colored by experimental condition and the right plot in each pair colored by batch. Source data

References

    1. Bloem, B. R., Okun, M. S. & Klein, C. Parkinson’s disease. Lancet397, 2284–2303 (2021). - PubMed
    1. Fearnley, J. M. & Lees, A. J. Ageing and Parkinson’s disease: substantia nigra regional selectivity. Brain114, 2283–2301 (1991). - PubMed
    1. Lashuel, H. A., Overk, C. R., Oueslati, A. & Masliah, E. The many faces of α-synuclein: from structure and toxicity to therapeutic target. Nat. Rev. Neurosci.14, 38–48 (2013). - PMC - PubMed
    1. Volpicelli-Daley, L. A. et al. Exogenous α-synuclein fibrils induce Lewy body pathology leading to synaptic dysfunction and neuron death. Neuron72, 57–71 (2011). - PMC - PubMed
    1. Schapira, A. H. et al. Mitochondrial complex I deficiency in Parkinson’s disease. Lancet1, 1269 (1989). - PubMed

Substances