. 2025 Aug 6;20(1):89.
doi: 10.1186/s13024-025-00880-7.

LRRK2 kinase activity regulates Parkinson's disease-relevant lipids at the lysosome

Affiliations

LRRK2 kinase activity regulates Parkinson's disease-relevant lipids at the lysosome

Michael T Maloney et al. Mol Neurodegener. .

Abstract

Background: Pathogenic variants in LRRK2 lead to increased kinase activity, and LRRK2 kinase inhibition is being explored in clinical studies as a therapeutic approach for Parkinson's Disease (PD). LRRK2 inhibitors reduce urine levels of bis(monoacylglycerol)phosphate (BMP), a key endolysosomal lipid involved in glycosphingolipid (GSL) catabolism, in preclinical models and clinical subjects. However, how LRRK2 regulates BMP and its significance with respect to lysosomal dysfunction in PD are poorly defined.

Methods: Using a combination of genetic and pharmacological approaches to modulate LRRK2 kinase activity, we explored the mechanisms by which LRRK2 can regulate the levels of BMP and PD-relevant GSLs across cellular models, including iPSC-derived microglia, and in tissues and biofluids from mice using mass spectrometry. The impact of LRRK2 activity on various aspects of lysosomal function, including endolysosomal GCase activity, was assessed using live-cell imaging and lysosomal immunoprecipitation. We employed imaging mass-spectrometry and FACS-based methods to specifically examine how LRRK2 modulates BMP and GSL levels across different cell types and regions of the brain. To confirm the relevance of our findings to disease, we measured lysosomal biomarkers in urine and cerebrospinal fluid (CSF) from human subjects carrying variants in LRRK2 associated with PD risk and from subjects dosed with a LRRK2 kinase inhibitor.

Results: Our data demonstrate that LRRK2 can employ distinct mechanisms to control intracellular BMP levels and modulate lysosomal homeostasis depending on the tissue examined. We show that LRRK2 deletion or inhibition lowers urine BMP levels by reducing the secretion of BMP-containing vesicles from kidney into urine. In other cell types such as microglia, LRRK2-mediated inhibition of β-glucocerebrosidase (GCase), a PD-linked enzyme involved in GSL catabolism, leads to lysosomal GSL accumulation and increases BMP levels as a compensatory response to restore lysosomal homeostasis. LRRK2 inhibition normalizes lysosomal function and reduces GSL levels in preclinical models and CSF from LRRK2-PD patients.

Conclusions: Our study highlights the therapeutic potential of LRRK2 kinase inhibition to improve PD-associated lysosomal dysfunction and supports the utility of GSLs as CSF-based biomarkers of LRRK2 activity.

Trial registration: This work includes results from the following phase 1b study in PD patients: ClinicalTrials.gov ID: NCT03710707; https://clinicaltrials.gov/study/NCT03710707?intr=dnl201&rank=2 . The date of registration was 10/18/2018.

Keywords: BMP and glycosphingolipids; LRRK2; Lysosome; Parkinson’s disease.


Conflict of interest statement

Declarations. Ethics approval and consent to participate: Study protocols, amendments, and informed consent forms were reviewed and approved by local institutional review boards/independent ethics committees. Written informed consent was obtained from each participant. Consent for publication: Not applicable. Competing interests: The authors declare the following competing interests: M.T.M., X.W., R.G., S.V.A., R.M., S.T.M., M.A., G.A., V.V.B, J.C., C.C., S.S.D., A.C.H., H.N.N., N.E.P., O.B.D., G.D.P., A.A.E., J.V., J.W.L., A.A., J.H.S., S.H.R., and A.G.H. were full time employees and shareholders of Denali Therapeutics during the course of this work. X.W. M.A., A.A.E. and J.D.V. are currently employees of Tenvie Therapeutics.

Figures
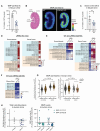
Fig. 1
Fig. 1
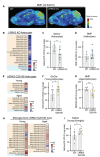
LRRK2 activity regulates peripheral BMP levels in preclinical models and in human subjects. A) Urine BMP(22:6/22:6) levels were measured from LRRK2 KO mice (n = 12) and wildtype (WT) littermates (n = 10). The relative abundance of urine BMP (22:6/22:6) levels were normalized to creatine, measured by LC-MS/MS, and then presented as a percent of median values measured in the WT group. Data are shown as geometric mean ratio percent and 95% confidence intervals, with statistical significance assessed based on Benjamini-Hochberg-adjusted p-values; ****p ≤ 0.0001. B) Matrix-assisted laser desorption/ionization mass spectrometry images were acquired from longitudinal kidney sections of WT and LRRK2 KO mice. Left panel: Representative hematoxylin and eosin photomicrograph of the kidney showing demarcated regions (cortex, outer medulla and inner medulla). Right panel: Representative mass spectrometry image showing the distribution of the signal at a mass/charge (m/z) ratio of 865.502, corresponding to BMP(22:6/22:6). Images depict the relative intensity of the signal from 0 to 100% with intensity normalized using total ion current. C) GlcCer(d18:1/24:0) levels in urine from LRRK2 KO mice (n = 12) and WT littermates (n = 10) were measured by LC-MS/MS and then presented as a percent of median values measured in the WT group. Data are shown as geometric means with 95% CI, with p-values based on an ANCOVA model with statistical significance assessed using on Benjamini-Hochberg (BH)-adjusted p-values; ***p ≤ 0.001. D) Heatmap showing the relative abundance of a panel of lipid species measured in the renal cortex and medulla from LRRK2 KO mice compared to WT littermates measured using LC-MS/MS; n = 11–12 animals for each group. The heatmap was generated as percent of change by normalizing the average of LRRK2 KO mice to the average of the WT group. The analytes included had nominal p-values (*p ≤ 0.10) for genotype differences and were grouped based on lipid class. White in the color scale depicts the WT-vehicle amounts, as 100%; red shows an accumulation (capped at 300%), and blue shows a reduction. E and F) LRRK2 G2019S knock-in (KI) mice and WT littermates were administered either vehicle or the tool LRRK2 kinase inhibitor MLi-2 (100 mg/kg) in chow, and a panel of lipid species were measured in renal cortex and renal medulla and in urine after 35 days of dosing using LC-MS/MS; n = 12 for WT-vehicle group, n = 12 for WT-MLi-2 group, n = 13 for LRRK2 G2019S-vehicle group, and n = 14 for LRRK2 G2019S-MLi-2 group. Heatmaps were generated as percent of change by normalizing the average of different groups to the average of the WT vehicle group. The analytes included had nominal p-values (* p ≤ 0.10) for genotype differences and were grouped based on lipid class. * p ≤ 0.10 annotated in the MLi-2 treatment groups are based on the MLi-2 vs. vehicle comparisons within the same genotype. White in the color scale depicts the WT-vehicle amounts, as 100%; red shows an accumulation (capped at 500% in panel E, capped at 150% in panel F), and blue shows a reduction. G) Association of urine BMP(22:6/22:6) levels and carrier status at the PD-risk LRRK2 G2019S variant and the PD-protective LRRK2 N551K variant in PPMI data. Urine BMP levels were normalized to creatinine levels, log transformed, and fit in a linear model against sex, age, disease status, and the first five principal components derived from whole genome sequencing data. Inverse normal transformed residuals from this linear model are plotted on the y-axis and used in association testing with LRRK2 variant status. Data are shown as mean ± SEM. H) Reduction of total lipid and BMP levels in urine exosomes collected from human subjects treated with DNL201 (n = 11) compared with the placebo group (n = 7). The total lipid abundance was calculated by summing up all the abundance of all the lipids analyzed. The percentage of changes from baseline (BL) was analyzed by calculating the lipid abundance change from the day 28-post-dose to pre-dose-baseline, and then normalizing the change to lipid abundance at pre-dose baseline. Lipid levels are expressed as percent change from pre- to post- dose, and data are shown as median with interquartile range (IQR)
Fig. 2
Fig. 2
LRRK2 activity regulates glycosphingolipids in mouse brain and mildly impacts BMP. A) Matrix-assisted laser desorption/ionization mass spectrometry images were acquired from sagittal brain sections of WT and LRRK2 KO mice. Representative mass spectrometry image showing the distribution of the signal at a mass/charge (m/z) ratio of 865.502, corresponding to BMP(22:6/22:6). Images depict the relative intensity of the signal from 0 to 20% with intensity normalized using total ion current. B) A heatmap representing the percent change in the levels of BMP-related lipids and GSLs measured in astrocytes isolated from LRRK2 KO mice compared to WT mice; n = 8 for LRRK2 KO mice and WT littermates. C and D) The levels of GalCer(d18:1/20:0) and BMP(22:6/22:6) were quantified from astrocytes isolated from LRRK2 KO mice and WT littermates. E-H) Astrocytes and microglia were isolated from young (5–6 month-old) and aged (18 month-old) LRRK2 G2019S KI mice and WT littermates, and their lipid profiles were assessed using LC-MS/MS; n = 8 for young LRRK2 G2019S KI and WT littermates and n = 7 for aged WT littermates and n = 9 for aged LRRK2 G2019S KI mice. E) Heatmaps representing the percent change in the levels of BMP-related lipids and GSLs measured in astrocytes isolated from young and aged LRRK2 G2019S KI mice compared to WT littermates. F and G) The levels of GlcCer(d18:1/24:0) and BMP(20:4/20:4) were quantified from astrocytes isolated from LRRK2 G2019S mice and WT littermates. H) Heatmaps representing the percent change in the levels of BMP-related lipids and GSLs measured in microglia isolated from young and aged LRRK2 G2019S KI mice compared to WT littermates. I) The levels of GalCer(d18:1/20:0) were quantified from microglia isolated from young LRRK2 G2019S mice and WT littermates. The heatmaps (B, E and H) were generated as percent change compared to levels measured in WT littermate controls. Shown are analytes with nominal p-values (*p ≤ 0.10) for genotype difference that were grouped based on lipid class. The BMP-related lipids were shaded in cyan, and GSL species were shaded in orange. In the color scale, white depicts the WT amounts, set to 100%, red shows an accumulation (capped at 200%) and blue shows a reduction. For plots (C, D, F, G and I), the relative abundance of the analytes was normalized to the median values of WT group. Data are plotted in log scale and shown as geometric mean ratio percent and 95% CIs with statistical significance assessed at nominal levels. *p ≤ 0.05, **p ≤ 0.01
Fig. 3
Fig. 3
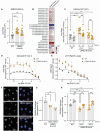
LRRK2 activity regulates glucosylceramide and BMP levels to maintain proper lysosomal function. A) BMP(22:6/22:6) levels were measured in WT parental A549 cells and two clones of LRRK2 R1441G KI A549 cells; data are shown as mean ± SEM; n = 17 independent experiments, and statistical significance was determined using one-way ANOVA following log transformation. B) Heatmap showing elevated glycosphingolipids including multiple GlcCer species in whole cell extracts from two clones of LRRK2 R1441G KI A549 cells as compared to parental WT cells. The heatmaps were generated as percent of change by normalizing the average of different groups to the average of the WT group; n = 14 independent experiments. The analytes included had nominal p-values (*p ≤ 0.10) for genotype difference in either clone and were grouped based on lipid class. White in the color scale depicts the WT-vehicle as 100%, red shows an accumulation (capped at 350%), and blue shows a reduction. C) WT and two clones of LRRK2 R1441G KI A549 cells were treated with vehicle or DNL151 (2µM) for 72 h, and the levels of GlcCer(d18:1/24:1) were measured using LC-MS/MS. Data are shown as mean ± SEM; n = 10 independent experiments, and statistical significance was determined using one-way ANOVA following log transformation. D) WT and one clonal line of LRRK2 R1441G KI A549 cells were treated with increasing concentrations of DNL151, and the levels of GlcCer(d18:1/24:1) were measured using LC-MS/MS. Data are shown as mean ± SEM; n = 4 independent experiments, and statistical significance was determined using non-linear fit following log transformation. E) Dose-response curves show the percent inhibition of LRRK2 kinase activity as measured by levels of phosphorylated T73 Rab10 in WT and one clonal line of LRRK2 R1441G A549 cells. Data are shown as mean ± SEM; n = 4 independent experiments, and statistical significance was determined using non-linear fit following log transformation. F) Representative images of DQ-BSA signals (left panels: black and white, right panels: red) in WT A549 cells (top panel), LRRK2 R1441G KI cells (middle panel) and LRRK2 R1441G KI cells treated with DNL151(bottom panel). Nuclei stained with NucBlue (blue); scale bar = 10 μm. G) The sum of spot intensities of DQ-BSA signal was quantified per cell in WT and two clones of LRRK2 R1441G KI A549 cells. The DQ-BSA signals were normalized to the median within each experiment and to the WT control. Data are shown as mean ± SEM; n = 3 independent experiments, and statistical significance was determined using one-way ANOVA following log transformation, *p ≤ 0.05, **p ≤ 0.01. H) WT and two clones of LRRK2 R1441G KI A549 cells were treated with vehicle or DNL151 (2µM) for 72 h, and lysosomal proteolysis was measured using the DQ-BSA-based assay. The sum spot intensities of DQ-BSA signal were quantified per cell. The DQ-BSA signals were normalized to the median within each experiment and to the WT vehicle control. Data are shown as mean ± SEM; n = 6 independent experiments, and statistical significance was determined using one-way ANOVA following log transformation. *p ≤ 0.05, **p ≤ 0.01, ***p ≤ 0.001
Fig. 4
Fig. 4
LRRK2 activity regulates endolysosomal GCase activity and GlcCer and BMP. levels in lysosomes. A) The levels of GSL species were measured in lysosomes isolated from WT and two clones of LRRK2 R1441G KI A549 cells. The percent change in signal from LRRK2 R1441G cells compared to WT cells is shown in the heatmap. The analytes included had nominal p-values (* p ≤ 0.10) for genotype difference and were grouped based on lipid class; n = 12 independent experiments. White in the color scale depicts the WT-vehicle as 100%, red shows an accumulation (capped at 200%), and blue shows a reduction. B and C) WT and one clonal line of LRRK2 R1441G KI A549 cells were treated with vehicle or DNL151 (2µM) for 72 h, lysosomes were rapidly immunoprecipitated, and the levels of GlcCer(d18:1/24:1) or BMP(20:4/20:4) were measured using LC-MS/MS. Data are shown as mean ± SEM; n = 8 independent experiments, and statistical significance was determined using one-way ANOVA following log transformation. D) Left: Representative images of GCase activity in WT, GBA1 KO, LRRK2 R1441G KI and LRRK2 KO A549 cells as shown by LysoFQ-GBA probe fluorescence (green). Nuclei stained with NucBlue (blue); scale bar = 10 μm. Right: Quantification of GCase activity as measured by the LysoFQ-GBA probe fluorescence signal. The sum of spot intensities of the LysoFQ-GBA signal was quantified per cell from WT, two clones of LRRK2 R1441G KI and two clones of LRRK2 KO A549 cells and was normalized to the median within each experiment and to the average of the WT controls across experiments. Data are shown as mean ± SEM; n = 7 independent experiments, and statistical significance was determined using one-way ANOVA following log transformation. E) GSL profiling of WT, one clonal line of LRRK2 R1441G KI, and one clonal line of GBA1 KO A549 cells was performed, and the percent change was measured by normalizing the average of each group to the average of WT cells. The analytes included had nominal p-values (* p ≤ 0.10) for genotype difference for either LRRK2 R1441G vs. WT or GBA1 KO vs. WT and were grouped based on lipid class; n = 3 independent experiments. White in the color scale depicts the WT reference level as 100%, red depicts an accumulation (capped at 350%), and blue depicts a reduction; *p ≤ 0.05, **p ≤ 0.01, ***p ≤ 0.001, ****p ≤ 0.0001
Fig. 5
Fig. 5
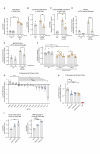
LRRK2 regulates GCase activity and levels of BMP and glucosylsphingosine in human iPSC-derived microglia. A) pT73 Rab10 levels and total LRRK2 were quantified from WT and LRRK2 G2019S KI iMicroglia using MSD-based assays. The ratio of pRab10/LRRK2 levels were quantified, and data are shown as mean ± SEM; n = 4 independent experiments, and statistical significance was determined using Student’s t-test. B and C) The levels of GlcSph and BMP (20:4/20:4) were measured using LC-MS/MS in cell lysates from WT, LRRK2 G2019S KI and LRRK2 KO iMicroglia. Data are shown as mean ± SEM; n = 6 independent experiments, and statistical significance was determined using one-way ANOVA and Tukey’s multiple comparison. D) Lysosomal GCase activity was assessed using the LysoFQ-GBA probe in WT cells, WT cells treated with the GCase inhibitor CBE, LRRK2 G2019S KI, and LRRK2 KO iMicroglia. The sum of the spot intensities per cell was quantified; data are shown as mean ± SEM; n = 3 independent experiments, and statistical significance was determined using one-way ANOVA and Tukey’s method for multiple comparisons. **p ≤ 0.01, ****p ≤ 0.0001
Fig. 6
Fig. 6
GCase is necessary and sufficient to mediate LRRK2’s effects on the levels of GCase substrates and BMP, and GCase activity is regulated by the LRRK2 substrates Rab10 and Rab12. A) WT and one clonal line of GBA1 KO A549 cells were treated with vehicle or DNL151 (2µM) for 72 h, and the levels of GlcCer species were measured using LC-MS/MS. The sum of all GlcCer species was measured, and data are shown as mean ± SEM; n = 6 independent experiments, and statistical significance was determined using one-way ANOVA following log transformation. B and C) WT and one clonal line of LRRK2 R1441G KI A549 cells were treated with vehicle or imiglucerase (2µM) for 72 h, and the levels of GlcCer and BMP (20:4/20:4) were measured using LC-MS/MS. Data are shown as mean ± SEM; n = 4 independent experiments, and statistical significance was determined using one-way ANOVA following log transformation. D and E) WT and LRRK2 G2019S iMicroglia were treated with vehicle or imiglucerase (1µM) for 72 h, and the levels of GlcSph and BMP (22:6/22:6) were measured using LC-MS/MS. Data are shown as mean ± SEM; n = 3 independent experiments, and statistical significance was determined using two-way ANOVA with Sidak’s multiple comparison test. F) WT and two clones of LRRK2 R1441G KI A549 cells were treated with vehicle, DNL151 (2µM), or imiglucerase (2µM) for 72 h. The sum of spot intensities of the DQ-BSA fluorescence signal was quantified per cell. DQ-BSA signal was normalized to the median within each experiment and to the average of the WT controls across experiments. Data are shown as mean ± SEM; n = 6 independent experiments and statistical significance was determined using two-way ANOVA with Sidak’s multiple comparison test following log transformation. G) siRNA KD screen of LRRK2 substrate Rabs identifies modifiers of GCase activity in A549 cells. Rab expression was transiently knocked down in WT A549 cells using transfection of pooled targeted siRNAs, and GCase activity was evaluated using the live cell LysoFQ-GBA probe. Data are shown as mean ± SEM; n = 7 independent experiments, and statistical significance was determined using one-way ANOVA following log transformation. H) Reduced GCase activity was confirmed in RAB10 KO and RAB12 KO A549 cells; Data are shown as mean ± SEM; n = 5 independent experiments, and statistical significance was determined using one-way ANOVA following log transformation. I) Levels of GlcCer(d18:1/24:0) and BMP(22:6/22:6) were measured in WT, RAB10 KO and RAB12 KO A549 cells using LCMS/MS. Data are shown as mean ± SEM; n = 5 independent experiments, and statistical significance was determined using one-way ANOVA following log transformation; *p ≤ 0.05, **p ≤ 0.01, ***p ≤ 0.001, ****p ≤ 0.0001
Fig. 7
Fig. 7
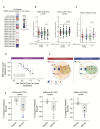
Lipidomic analysis of CSF shows alterations in GlcCer and BMP in PD patients with LRRK2 variants. Targeted analyses of CSF lipid levels were determined by LC-MS/MS in human subjects from the LCC cohort (Healthy controls without LRRK2 variants: n = 35; Healthy controls with LRRK2 variants: n = 37; PD patients without LRRK2 variants: n = 37; PD patients with LRRK2 variants: n = 26. A) Heatmap showing percent change in lipid abundance detected in CSF from PD patients with LRRK2 variant carriers compared to non-carriers. Percent changes and significance of effects were analyzed using robust linear model with sex and age as covariates. * unadjusted p ≤ 0.10. B) Relative abundance of BMP(22:6/22:6) and GlcCer(d18:1/24:1) levels were measured in CSF. Significance of change was analyzed by linear model with pairwise comparisons by Tukey’s honest significant difference test with significance set at unadjusted p value of 0.05. Main box and error bars depict interquartile ranges of top 75th or bottom 25th percentile and largest and smallest value with 1.5 times the interquartile ranges above and below 75th or 25th percentiles. Median 50th percentile is shown as midline within each boxplot. *p ≤ 0.05. C) The ratio of total GlcCer to total ceramide (Cer) levels were measured across study participants. Total GlcCer was calculated as sum of area ratios from GlcCer(d18:1/16:0), GlcCer(d18:1/18:0), GlcCer(d18:1/24:0), and GlcCer(d18:1/24:1). Total Cer was calculated as sum of area ratios from Cer lipids with identically matched acyl chain groups as GlcCer quantified. Significance of change was analyzed by linear model with pairwise comparisons by Tukey’s honest significant difference test. Ranges of values illustrated are the same as (B); *p ≤ 0.05. D) Pearson correlation coefficient and significance of correlations between BMP(22:6/22:6) and GlcCer(d18:1/24:1) in LRRK2 variant carriers with PD. E) The levels of GlcCer(d18:1/18:0), GalCer(d18:1/18:0), and GalCer(d18:1/24:1) were measured in CSF in PD subjects that carry a LRRK2 variant at baseline and following 28 days of dosing with placebo (n = 3) or DNL201 (n = 4). The percentage change from baseline was analyzed by calculating the lipid abundance change from the day 28-post-dose to pre-dose-baseline, and then normalizing the change to lipid abundance at pre-dose baseline. Data are shown as mean ± SEM. F) Model for mechanisms by which LRRK2 regulates BMP and GSL levels. Pathogenic variants in LRRK2 lead to an increased phosphorylation of relevant Rabs at the lysosome, impaired endolysosomal GCase activity, and reduced lysosomal proteolysis. We propose two potential mechanisms that are employed depending on the tissue examined in response to LRRK2-mediated lysosomal dysfunction: (1) in kidney, we propose that LRRK2 hyperactivity promotes increased secretion of BMP- and GSL-containing vesicles as a compensatory response to help clear accumulated lipids and proteins and (2) in other cell types, including in the brain, increased LRRK2 activity leads to an increase in intracellular GCase substrate levels, and BMP is upregulated as a compensatory response to boost GCase activity. LRRK2 kinase inhibition corrects lysosomal dysfunction and obviates the need for compensatory measures to restore lysosomal homeostasis, leading to a reduction in BMP and GSL secretion and BMP and GCase substrate accumulation in cells

References

    1. Abeliovich A, Gitler AD. Defects in trafficking Bridge Parkinson’s disease pathology and genetics. Nature. 2016;539:207–16. - PubMed
    1. Bandres-Ciga S, et al. Large-scale pathway specific polygenic risk and transcriptomic community network analysis identifies novel functional pathways in Parkinson disease. Acta Neuropathol. 2020;140:341–58. - PMC - PubMed
    1. Chang D, et al. A meta-analysis of genome-wide association studies identifies 17 new Parkinson’s disease risk loci. Nat Genet. 2017;49:1511–6. - PMC - PubMed
    1. Nalls MA, et al. Identification of novel risk loci, causal insights, and heritable risk for Parkinson’s disease: a meta-analysis of genome-wide association studies. Lancet Neurol. 2019;18:1091–102. - PMC - PubMed
    1. Reynolds RH, et al. Moving beyond neurons: the role of cell type-specific gene regulation in Parkinson’s disease heritability. Npj Parkinson’s Disease. 2019;5:6. - PMC - PubMed

Substances

Associated data