. 2025 Aug 6;23(1):875.
doi: 10.1186/s12967-025-06793-9.

COL6A2 in clear cell renal cell carcinoma: a multifaceted driver of tumor progression, immune evasion, and drug sensitivity

Affiliations

COL6A2 in clear cell renal cell carcinoma: a multifaceted driver of tumor progression, immune evasion, and drug sensitivity

Yashuang Yang et al. J Transl Med. .

Abstract

Background: Renal Cell Carcinoma (RCC) is a leading cause of cancer-related mortality worldwide, with Clear Cell Renal Cell Carcinoma (ccRCC) comprising 75% of cases. Surgical resection remains the cornerstone of treatment for localized RCC, but its asymptomatic progression and lack of reliable early biomarkers often result in advanced disease at diagnosis. Collagen VI alpha-2 chain (COL6A2), an extracellular matrix protein, has been implicated in tumor progression and metastasis. Despite its established roles in other malignancies, the specific contribution of COL6A2 to ccRCC pathogenesis is poorly understood.

Objective: This study aims to systematically investigate COL6A2 expression in ccRCC, its prognostic value, and its potential impact on the tumor immune microenvironment, cancer stem cell characteristics, and drug response.

Methods: The mRNA and protein expression data for ccRCC were sourced from TCGA, GEO, CPTAC, and ICPC. Single-cell and spatial transcriptomic data were processed using Seurat with quality control measures. Clinical correlations and survival analyses, including immune infiltration and COL6A2 expression, were assessed using Cox regression and Kaplan-Meier curves. Cancer stemness was evaluated using six stemness indices. Differential expression and pathway analyses (GO, KEGG, GSEA) were performed with DESeq2 and clusterProfiler. Drug sensitivity and immunotherapy response were predicted using GDSC, CTRP, and TIDE databases. Functional studies, including colony formation and invasion assays, as well as in vivo xenograft models, assessed the impact of COL6A2 on tumor progression and therapy response.

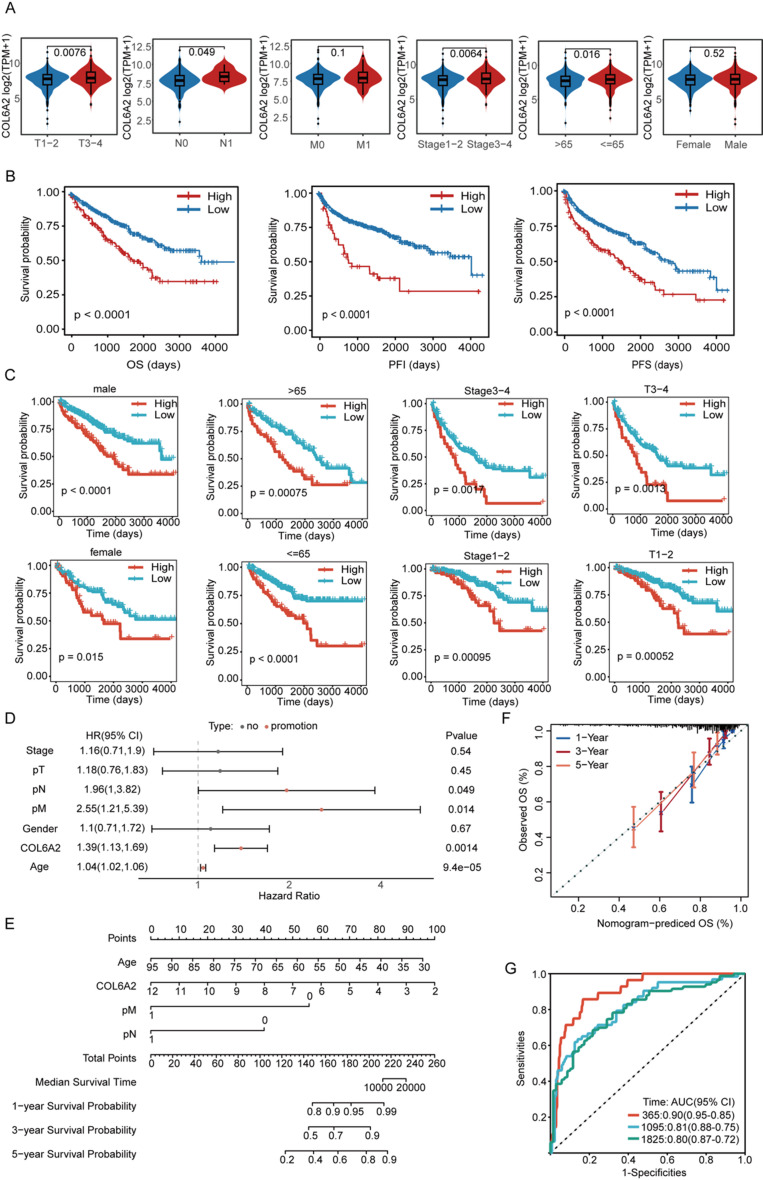
Results: COL6A2 expression was significantly upregulated in ccRCC compared to normal tissues. High COL6A2 expression correlated with poorer overall survival (OS), progression-free interval (PFI), and progression-free survival (PFS), establishing it as an independent prognostic factor for ccRCC. Additionally, COL6A2 expression was positively associated with immune-suppressive cell infiltration, suggesting an immunosuppressive tumor microenvironment. COL6A2 was also linked to enhanced stem cell-like properties, invasiveness, and metastatic potential. Pathway enrichment analyses revealed that COL6A2 may influence tumor progression by regulating the epithelial-mesenchymal transition (EMT) process and activating the PI3K-Akt signaling pathway. Notably, high COL6A2 expression correlated with enhanced responsiveness to sunitinib but resistance to immunotherapy, highlighting its dual role in therapy selection.

Conclusion: This study identifies COL6A2 as a powerful prognostic biomarker and a driver of ccRCC progression through EMT and immune suppression. Targeting COL6A2 holds promise for improving immunotherapy efficacy and personalizing treatment strategies, offering new hope for ccRCC patients facing limited options.

Keywords: COL6A2; Pharmacological prediction; Prognostic significance; Renal cancer; Tumor microenvironment.


Conflict of interest statement

Declarations. Ethics approval and consent to participate: For animal study: This study was approved by the Medical Ethics Committee of Zhongnan Hospital, Wuhan University (approval MRI2024-LAC209). For human study: not applicable. Consent for publication: Not applicable. Competing interests: The authors declare that they have no competing interests.

Figures

Fig. 1
Fig. 1
COL6A2 Expression and the Correlation with Prognostic Indicators in Pan-Cancer, Particularly ccRCC. A. RNA expression of COL6A2 across various cancers and normal tissues from TCGA. B. Univariate COX regression forest plot for OS, PFI, and PFS of COL6A2. The horizontal line segments represent the 95% confidence intervals, with the two ends representing the lower limit (lower 95% HR) and upper limit (higher 95% HR) of the 95% confidence interval; the dots represent the HR values for each variable, where blue dots indicate HR < 1 and red dots indicate HR > 1; there is a vertical dashed line at HR = 1. If the line segment of a variable does not intersect with the dashed line, it means that the 95% confidence interval of the variable’s HR does not include 1, the p-value is less than 0.05, and the variable has an impact on patient survival with statistical significance. C. Venn diagram displaying tumors with differential gene expression and significant univariate COX regression for OS, PFI, and PFS. D. Differential RNA expression of COL6A2 in paired tumor and normal samples from TCGA-KIRC. E. Protein expression of COL6A2 in ccRCC tumors and normal samples from the CPTAC. F. Immunohistochemical staining of COL6A2 in renal cancer and normal samples from HPA. G. RNA expression of COL6A2 in tumor and adjacent clinical samples. H. RNA expression of COL6A2 in cancer and adjacent samples from GEO datasets. I. Protein expression of COL6A2 in collected tumor and adjacent clinical samples
Fig. 2
Fig. 2
Association of COL6A2 with clinical characteristics and prognostic indicators in KIRC. A. Expression of COL6A2 across subgroups defined by age, gender, TNM, and stage in KIRC. Clinical characteristics (left to right): TNM stage, Clinical stage, Age, Gender. B. Kaplan-Meier survival curves for OS, PFI, and PFS in high vs. low COL6A2 expression groups. C. Kaplan-Meier survival curves for OS in high vs. low COL6A2 expression groups across clinical subgroups. D. Multivariate COX regression forest plot for OS including COL6A2 and clinical indicators. E. Nomogram based on significant indicators from multivariate COX regression for predicting OS. F. Calibration curves at 1, 3, and 5 years for the OS nomogram. G. Receiver operating characteristic (ROC) curves at 1, 3, and 5 years for the OS nomogram
Fig. 3
Fig. 3
Exploration of the Relationship Between COL6A2 and Immune Infiltration in ccRCC Using Various Immune Infiltration Analyses. A. ESTIMATE. B. TIMER. C. EPIC. D. Quantiseq. E. MCPcounter. F. CIBERSORT. TCGA-KIRC tumor samples were dichotomized into high-expression (red) and low-expression (blue) groups based on the median COL6A2 expression level, as stratified in the box plot
Fig. 4
Fig. 4
Relationship between COL6A2 and tumorigenesis in ccRCC: exploration of its function and molecular pathways. A. Distribution of tumorigenic scores in high vs. low COL6A2 expression groups. B. Volcano plot of differentially expressed genes between high and low COL6A2 expression groups. C. GSEA-KEGG enrichment bar plot for differentially expressed genes. D. GO Biological Process (BP) and KEGG enrichment bar plots for genes with high expression. E. GO-BP and KEGG enrichment bar plots for genes with low expression. F. Top 5 GSEA-GOBP enrichment plots for highly expressed genes. G. Uniform Manifold Approximation and Projection (UMAP) plot showing single-cell subtypes. H. UMAP plot showing COL6A2 expression across cell types. I. Volcano plot of differential analysis between tumor epithelial cells and normal renal tubular epithelial cells at the single-cell level. J. UMAP plot showing tumor cell subtypes. K. UMAP plot showing COL6A2 expression across tumor cell subtypes. L. UMAP plot showing EMT scores across tumor cell subtypes. M-N. Pseudotime trajectory plot for tumor cell subtypes. O. COL6A2 expression in the pseudotime trajectory plot
Fig. 5
Fig. 5
Functional exploration of COL6A2 in ccRCC at the cellular level. A. RNA expression of COL6A2 in HK2 and ccRCC cell lines. B. RNA expression of COL6A2 in OS-RC-2 and ACHN cell lines after knockdown. C. Cell proliferation curves of OS-RC-2 and ACHN cell lines following COL6A2 knockdown, measured by CCK-8 assay. D-F. Transwell Migration Assays, Colony formation assays, Scratch assays in OS-RC-2 and ACHN cell lines following COL6A2 knockdown. G. Bar graphs of Transwell Migration Assay, Colony formation assay, Scratch Assay results. H. Protein expression of COL6A2 and EMT-related markers in OS-RC-2 and ACHN cell lines following knockdown. I. Expression changes of PI3K-AKT and TGF-β signaling pathway-related markers in OS-RC-2 and ACHN cell lines following COL6A2 knockdown
Fig. 6
Fig. 6
Key Role of COL6A2 in Regulating Sensitivity to Sunitinib and Immunotherapy in ccRCC. A. Distribution of drug sensitivity scores for Sunitinib, Pazopanib, Axitinib, Cabozantinib, and Sorafenib in high vs. low COL6A2 expression groups. B. Distribution of TIDE prediction results, TIDE scores, and other immune infiltration scores for immune therapy response in high vs. low COL6A2 expression groups. C. IC50 curves of OS-RC-2 and ACHN cell lines in response to Sunitinib following COL6A2 knockdown. D-F. Tumor growth rate and body weight changes in BALB/c-nu mice following COL6A2 knockdown with/without Sunitinib. G-I. Tumor growth rate and body weight changes in BALB/c mice following COL6A2 knockdown with/without RMP1-14

References

    1. Bui TO, Dao VT, Nguyen VT, Feugeas J-P, Pamoukdjian F, Bousquet G. Genomics of clear-cell renal cell carcinoma: A systematic review and meta-analysis. Eur Urol. 2022;81:349–61. 10.1016/j.eururo.2021.12.010. - PubMed
    1. Hsieh JJ, Purdue MP, Signoretti S, Swanton C, Albiges L, Schmidinger M, Heng DY, Larkin J, Ficarra V. Renal cell carcinoma. Nat Rev Dis Primer. 2017;3:17009. 10.1038/nrdp.2017.9. - PMC - PubMed
    1. Cai Z, He Y, Yu Z, Hu J, Xiao Z, Zu X, Li Z, Li H. Cuproptosis-related modification patterns depict the tumor microenvironment, precision immunotherapy, and prognosis of kidney renal clear cell carcinoma. Front Immunol. 2022;13:933241. 10.3389/fimmu.2022.933241. - PMC - PubMed
    1. Young M, Jackson-Spence F, Beltran L, Day E, Suarez C, Bex A, Powles T, Szabados B. Renal cell carcinoma. Lancet. 2024;404:476–91. 10.1016/S0140-6736(24)00917-6. - PubMed
    1. Abbonante V, Malara A, Chrisam M, Metti S, Soprano P, Semplicini C, Bello L, Bozzi V, Battiston M, Pecci A, et al. Lack of COL6/collagen VI causes megakaryocyte dysfunction by impairing autophagy and inducing apoptosis. Autophagy. 2023;19:984–99. 10.1080/15548627.2022.2100105. - PMC - PubMed

MeSH terms

Substances

LinkOut - more resources