. 2025 Aug;15(8):e70436.
doi: 10.1002/ctm2.70436.

Single-cell atlas reveals heterogeneous response to FcRn blockade in anti-AChR antibody-positive generalised myasthenia gravis

Affiliations

Single-cell atlas reveals heterogeneous response to FcRn blockade in anti-AChR antibody-positive generalised myasthenia gravis

Hui-Ning Li et al. Clin Transl Med. 2025 Aug.

Abstract

Background: Myasthenia gravis (MG) is an autoimmune disease predominantly driven by autoantibodies targeting acetylcholine receptor (AChR), resulting in muscle weakness. Efgartigimod, a neonatal Fc receptor (FcRn) blocker, reduces pathogenic immunoglobulin G in anti-AChR antibody-positive generalised MG (gMG). This study aimed to identify immune mechanisms underlying MG pathology and response to efgartigimod.

Methods: We constructed a single-cell atlas of peripheral immune cells from treatment-naïve and efgartigimod-treated patients with gMG. Comprehensive immunophenotyping was performed to compare the clonal diversity of B- and T-cell populations, alongside experimental validation to assess the activation of Th17-related pathways before and after FcRn blockade.

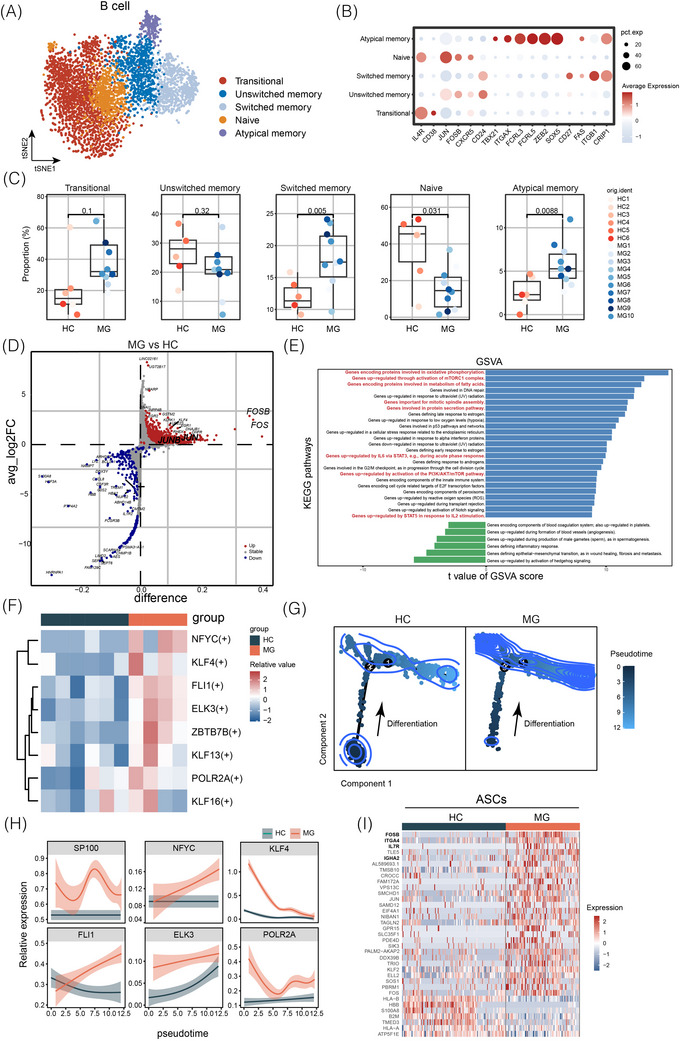
Results: B cells in patients with gMG exhibit heightened activation and differentiation, while T cells display distinct pro-inflammatory phenotypes. Enhanced intercellular signalling contributed to the pathogenicity associated with gMG. Efgartigimod mitigated upregulated antigen processing and presentation pathways in MG. Additionally, B-cell clonal diversity and IGHG1-bearing B-cell receptors increased. Transcriptional factor alterations were noted in suboptimal responders. Regulation of T-cell activity, particularly within Th17-related pathways, was associated with remission rates.

Conclusions: These findings underscore immune heterogeneity and dynamics during efgartigimod treatment, providing mechanistic insights into therapeutic response in gMG.

Key points: Aberrant B cells and pro-inflammatory T cells contribute critically to generalised myasthenia gravis (gMG) pathogenesis. Neonatal Fc receptor (FcRn) blockade induces immunoglobulin G (IgG) depletion feedback, reflected by increased class-switched BCRs. Th17 cell proliferation is attenuated following FcRn blockade. Antigen processing and presentation pathways are downregulated after FcRn blockade in gMG.

Keywords: FcRn blockade; myasthenia gravis; single‐cell RNA sequencing; therapeutic response.


Conflict of interest statement

The authors declare they have no conflicts of interest.

Figures

FIGURE 1
FIGURE 1
Peripheral immune landscapes in generalised myasthenia gravis (gMG). (A) Flowchart illustrating the study design, including single‐cell RNA sequencing (scRNA‐seq) analysis of immune repertoires in peripheral blood mononuclear cells (PBMCs) from healthy controls (HCs) and patients with gMG. Cohort #1 consisted of 10 immuno‐treatment‐naïve patients with gMG and six HCs, while cohort #2 comprised paired PBMC samples from seven patients with gMG before and after neonatal Fc receptor (FcRn) blockade treatment (four weekly infusions of efgartigimod [Efg], 10 mg/kg), using single‐cell transcriptomics and T/B‐cell receptor immune repertoire profiling. Post‐treatment samples were collected 1 week after the fourth Efg infusion (V5). If receiving corticosteroids and/or nonsteroidal immunosuppressive therapies (NSISTs), must be on a stable dose for ≥1 month prior to screening. (B) Uniform manifold approximation and projection (UMAP) of scRNA‐seq datasets showing 22 immune cell clusters across PBMCs from 10 patients with gMG and six HCs (n = 218 732 cells). (C) Bubble heatmap displaying expression levels of marker genes across identified cell type clusters. (D) UMAP plot indicating the number of upregulated and downregulated genes across PBMC clusters after FcRn blockade with Efg. (E) Boxplots showing immune cell cluster frequencies in HCs (n = 6), treatment‐naïve patients with gMG (n = 10) and patients treated with FcRn blockade (n = 7). Student's t‐test p‐values are shown for indicated comparisons.
FIGURE 2
FIGURE 2
B‐cell abnormalities in generalised myasthenia gravis (gMG). (A) Uniform manifold approximation and projection (UMAP) plot showing five B‐cell subtypes from healthy controls (HCs) and patients with gMG. Subtypes include naïve, transitional, unswitched memory, switched memory and atypical memory B cells. (B) Expression levels of marker genes across B‐cell subclusters. (C) Boxplots comparing proportions of B‐cell subclusters between HCs and patients with gMG. p‐Values are shown for indicated comparisons. (D) Volcano plot of differentially expressed genes (DEGs) in B cells from patients with gMG compared to HCs. (E) Gene set variation analysis (GSVA) enrichment of hallmark gene sets in B cells from patients with gMG versus HCs, with T values calculated by limma regression. (F) Heatmap of transcription factor activity in B cells from HC and gMG groups. (G) B‐cell development trajectories in HCs and patients with gMG, with colours indicating cell states from primitive (dark blue) to mature (light blue). (H) Trends in the expression of selected genes across B‐cell development trajectories. (I) Top DEGs in antibody‐secreting cells (ASCs) from HC and gMG groups.
FIGURE 3
FIGURE 3
T‐cell abnormalities in generalised myasthenia gravis (gMG). (A) Uniform manifold approximation and projection (UMAP) plot of 10 CD4+ T‐cell subtypes from healthy controls (HCs) and patients with gMG. (B) Expression levels of marker genes across CD4+ T‐cell subclusters. (C) Boxplots showing the proportions of CD4+ T‐cell subclusters in HCs and patients with gMG. p‐Values are indicated for comparisons. (D) Transcription factor activity ranked in CD4+ T cells from HC and gMG groups. (E) Kyoto Encyclopaedia of Genes and Genomes pathway enrichment analysis of upregulated genes in CD4+ T cells from patients with gMG. (F) Uniform manifold approximation and projection (UMAP) plot of six CD8+ T‐cell subtypes in HCs and patients with gMG. (G) Expression levels of marker genes across CD8+ T‐cell subclusters. (H) Boxplots comparing proportions of CD8+ T‐cell subclusters between HCs and patients with gMG. p‐Values are indicated for comparisons. (I) Ranked transcription factor regulon activity in CD8+ T cells from HC and gMG groups.
FIGURE 4
FIGURE 4
Gene expression, transcriptional regulon activity and BCR dynamics in B cells pre‐ and post‐neonatal Fc receptor (FcRn) blockade. (A) Differentially expressed genes (DEGs) in B‐cell subclusters from post‐treatment versus pre‐treatment samples. (B) Volcano plot of DEGs in antibody‐secreting cells (ASCs) post‐treatment. (C) Heatmap of transcription factor regulon activity in B cells from patients with adequate and suboptimal responses before and after FcRn blockade. The adequate and suboptimal responses were based on Myasthenia Gravis Activities of Daily Living (MG‐ADL) improvement (see Section 2). (D) Distribution of BCR clone sizes in four adequately responsive patients pre‐ and post‐treatment. (E) Distribution of BCR clone types across samples pre‐ and post‐treatment, highlighting IGHG1 changes.
FIGURE 5
FIGURE 5
Gene expression, transcriptional regulon activity and TCR dynamics in CD4+ T cells pre‐ and post‐neonatal Fc receptor (FcRn) blockade. (A) Differentially expressed genes (DEGs) in CD4+ T‐cell subclusters from post‐treatment versus pre‐treatment samples. (B) Heatmap of transcription factor regulon activity in CD4+ T cells from adequate and suboptimal response groups before and after FcRn blockade. (C) Quantification of T‐cell activation scores in individual patients. Genes marking T‐cell activation are included in Table S2. (D) Gene set variation analysis of downregulated pathways in post‐treatment versus pre‐treatment groups. (E) Distribution of TCR clone sizes in four adequately responsive patients pre‐ and post‐treatment. (F) Radar plots of IL‐17 signalling pathway‐related gene expression in four adequately responsive patients. (G) Quantification of pro‐inflammatory and anti‐inflammatory cytokines in cohort #3 with FcRn blockade treatment (Table S3). (H) Flow cytometry validating the effects of efgartigimod on the differentiation and proliferation of Th17 cells. Notably, a significant reduction in Th17 cells and CFSE proliferation was determined in the dosing group (< .05).
FIGURE 6
FIGURE 6
Intercellular communication and antigen presentation in neonatal Fc receptor (FcRn) blockade. NicheNet analysis of intercellular signals from T/NK cells to B cells (A) and signals from B cells to T/NK cells (B) in healthy control (HC) and generalised myasthenia gravis (gMG) groups (ranked by ligand activity). Similar analyses were performed for the comparison of signalling pre‐ and post‐FcRn blockade (C and D). (E) Flow cytometry analysis showing reduced expression of antigen‐presenting markers and T‐cell co‐stimulators in CD19+ B cells post‐treatment. (F) Scatter plots of incoming and outgoing signalling strengths in paired peripheral blood mononuclear cell (PBMC) samples pre‐ and post‐treatment. (G) Bar plots showing proportions of overall signalling flows in PBMC samples pre‐ and post‐treatment. (H) Dot plots highlighting significant changes in cell‐to‐cell communication pathways involving monocytes, dendritic cells and CD4+ T cells pre‐ and post‐treatment.

Similar articles

References

    1. Punga AR, Maddison P, Heckmann JM, et al. Epidemiology, diagnostics, and biomarkers of autoimmune neuromuscular junction disorders. Lancet Neurol. 2022;21:176‐188. doi: 10.1016/s1474-4422(21)00297-0 - DOI - PubMed
    1. Gilhus NE. Myasthenia gravis. N Engl J Med. 2016;375:2570‐2581. doi: 10.1056/nejmra1602678 - DOI - PubMed
    1. Zhang C‐J, Gong Y, Zhu W, et al. Augmentation of circulating follicular helper T cells and their impact on autoreactive B cells in myasthenia gravis. J Immunol. 2016;197:2610‐2617. doi: 10.4049/jimmunol.1500725 - DOI - PubMed
    1. Zhong H, Huan X, Zhao R, et al. Peripheral immune landscape for hypercytokinemia in myasthenic crisis utilizing single‐cell transcriptomics. J Transl Med. 2023;21:564. doi: 10.1186/s12967-023-04421-y - DOI - PMC - PubMed
    1. Neu KE, Tang Q, Wilson PC, Khan AA. Single‐cell genomics: approaches and utility in immunology. Trends Immunol. 2017;38:140‐149. doi: 10.1016/j.it.2016.12.001 - DOI - PMC - PubMed

LinkOut - more resources