. 2025 Aug;15(8):e70425.
doi: 10.1002/ctm2.70425.

Multi-omics profiling identifies TNFRSF18 as a novel marker of exhausted CD8⁺ T cells and reveals tumour-immune dynamics in colorectal cancer

Affiliations

Multi-omics profiling identifies TNFRSF18 as a novel marker of exhausted CD8⁺ T cells and reveals tumour-immune dynamics in colorectal cancer

Tengfei Jia et al. Clin Transl Med. 2025 Aug.

Abstract

Background: Colorectal cancer (CRC) ranks among the most prevalent malignant tumours of the digestive system globally and is associated with unfavourable survival outcomes. The exhaustion of CD8⁺ T cells serves a crucial role in facilitating tumour immune escape. Yet, the dynamic evolution of CD8⁺ T cell exhaustion and its impact on clinical prognosis across TNM (tumour-node-metastasis) stages in CRC remains incompletely characterized.

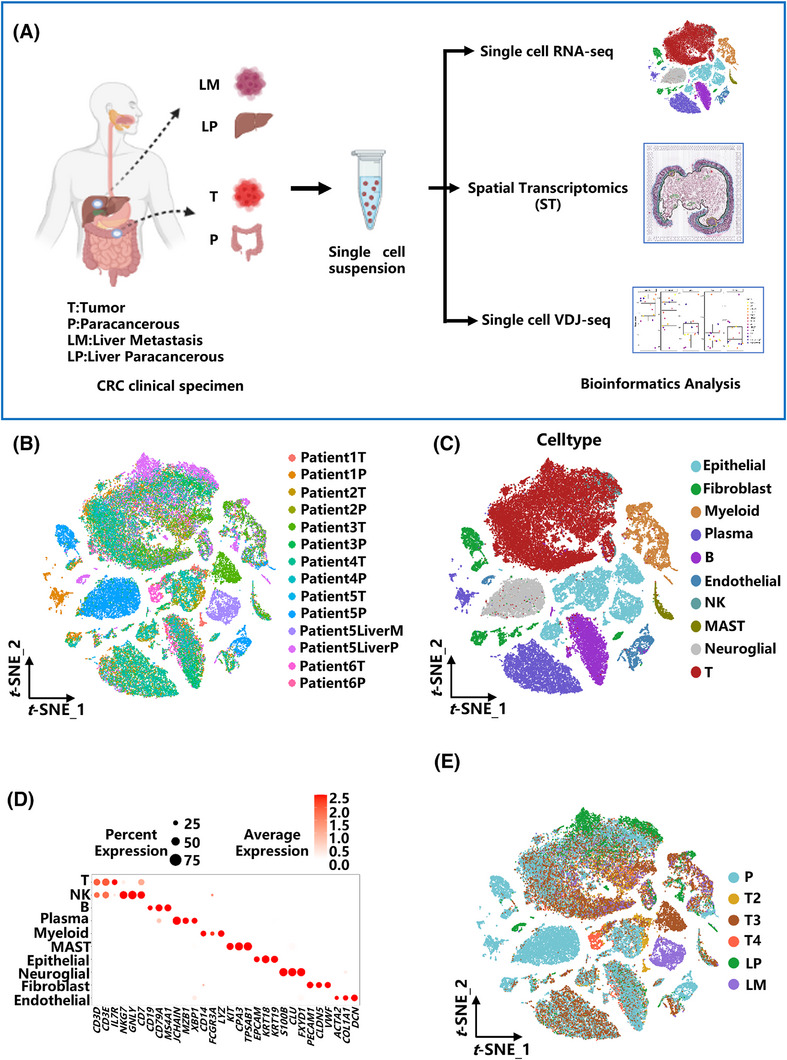
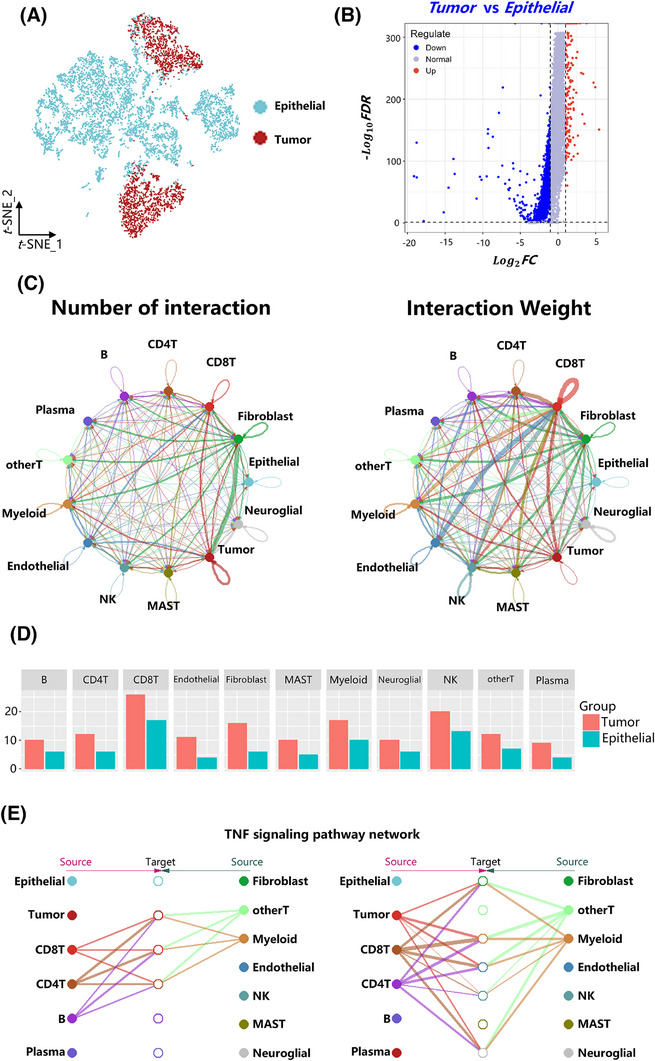
Methods: Tumour and adjacent tissues (20 samples total) from 6 CRC patients spanning diverse TNM stages were analyzed using integrated single-cell transcriptomic profiling (scRNA-seq), single-cell T cell receptor/B cell receptor sequencing (scVDJ-seq), and spatial transcriptomics. T cell exhaustion markers, immune clonality, gene expression profiles, and the spatial distribution of both tumour cells and immune cells were systematically profiled. Functional enrichment and intercellular communication analyses were conducted. Key findings were validated using immunofluorescence and public datasets.

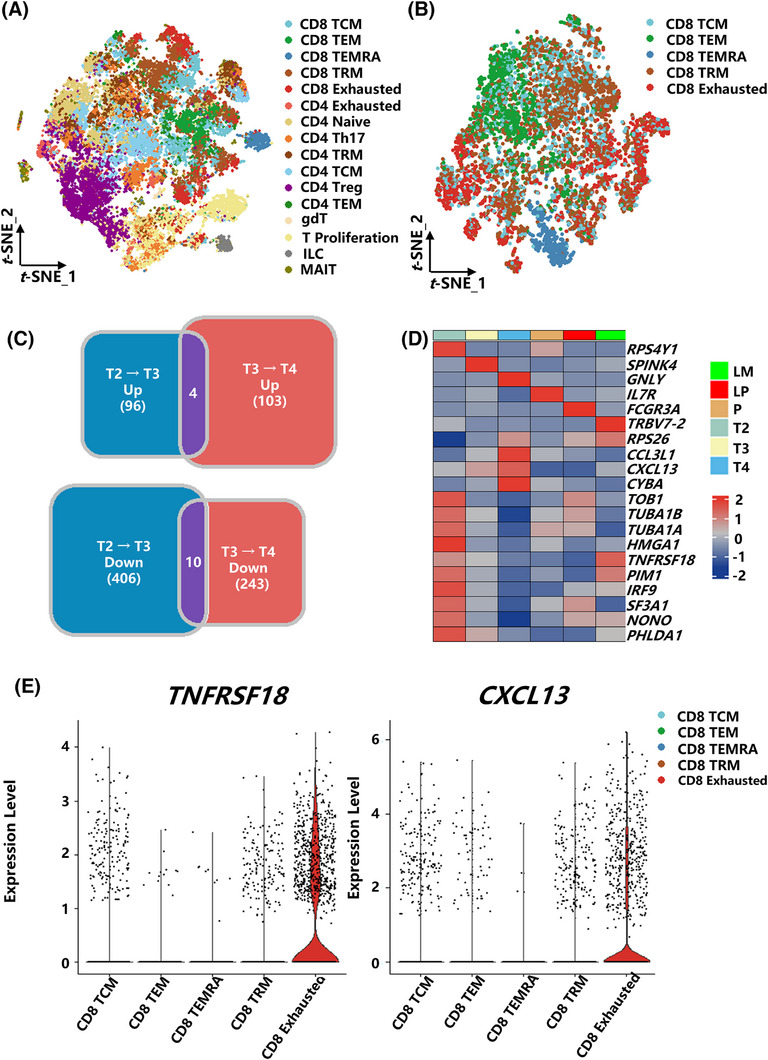
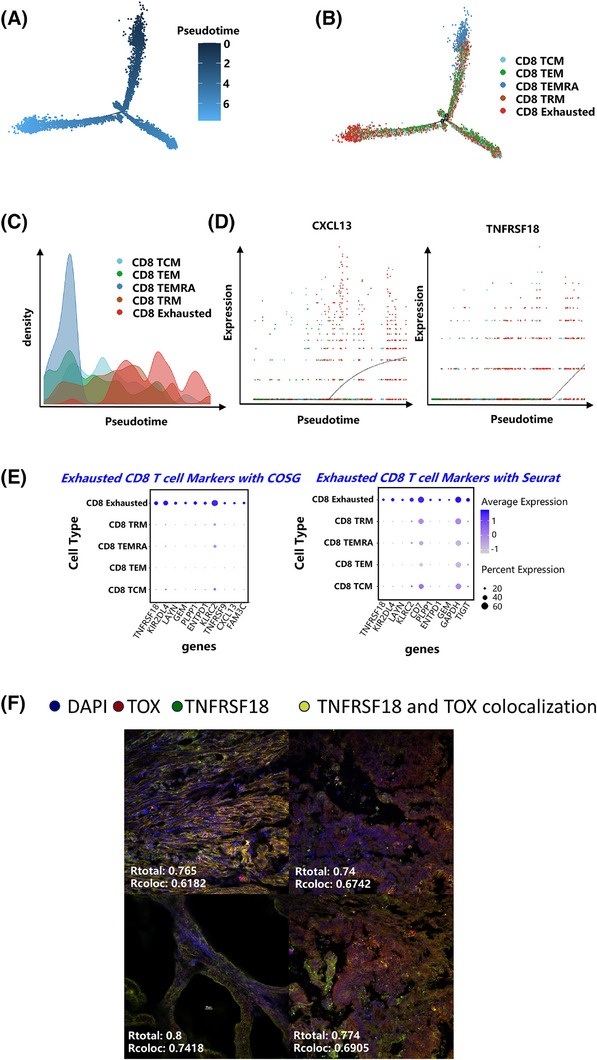
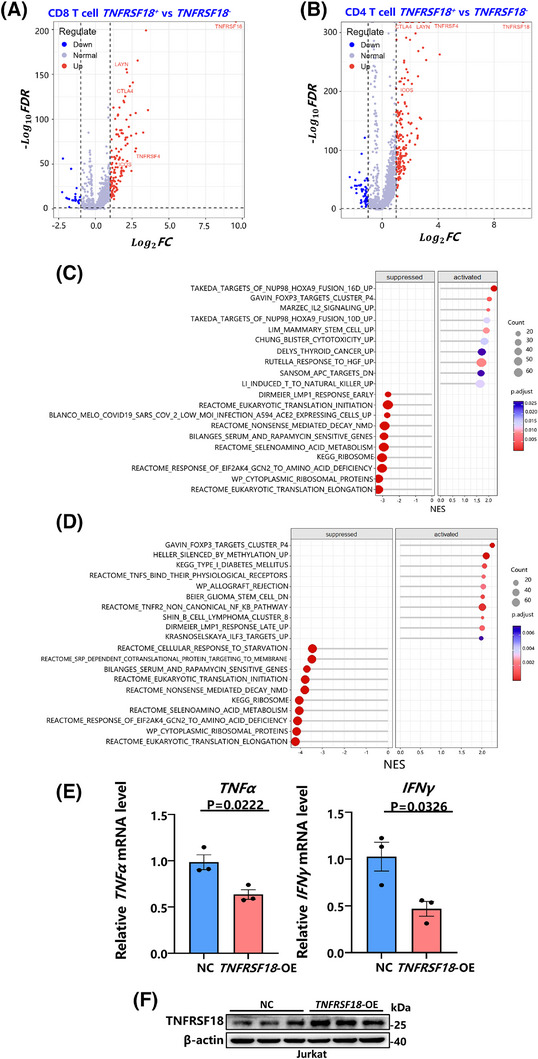
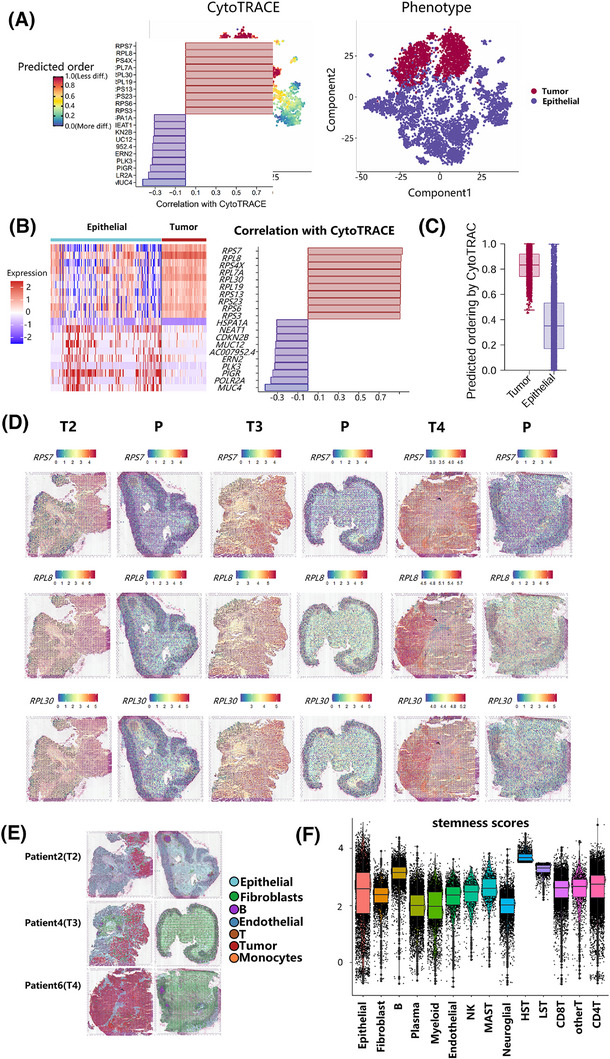
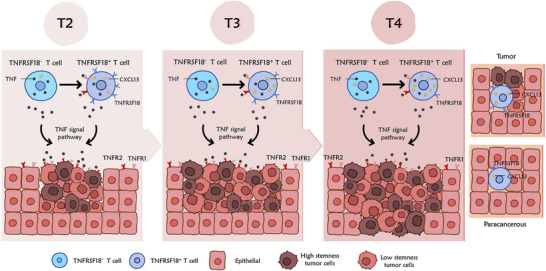
Results: Our results illustrate how advancing TNM stages in CRC shape CD8⁺ T cell exhaustion through divergent TNFRSF18/CXCL13 dynamics and ribosomal stemness. TNFRSF18 expression was notably higher in T cells infiltrating tumour tissues relative to their counterparts in adjacent non-tumorous areas, with high-expressing CD8⁺ T cells exhibiting marked exhaustion features. During CRC progression, TNM-stage-driven remodelling of the tumour microenvironment (TME) induced progressive CD8⁺ T cell exhaustion marked by declining TNFRSF18 and rising CXCL13 expression in tumour-infiltrating T cells elevation of both markers in the tumour compared with adjacent tissues. Moreover, we show that tumour cells displayed elevated expression of stemness-associated ribosomal genes (RPS7, RPL8, RPL30), peaking at stage T4, which correlated with poor prognosis and immune escape.

Conclusions: This integrative multi-omics study uncovers CD8⁺ T cell exhaustion dynamics and ribosomal stemness-mediated immune evasion across CRC progression. CXCL13, TNFRSF18, and ribosomal proteins (RPS7/RPL8/RPL30) are identified as novel biomarkers with direct prognostic value and therapeutic relevance, providing therapeutic targets for precision immunotherapy in CRC.

Key points: Multi-omics analysis reveals dynamic CD8+ T cell exhaustion patterns across CRC samples with different TNM stages. TNFRSF18 is highly expressed in exhausted tumour-infiltrating CD8+ T cells and declines with disease progression. Ribosomal stemness in tumour cells promotes immune evasion by impairing TNF-mediated CD8+ T cell function.

Keywords: T cell exhaustion; TNFRSF18 (GITR); TNM stage; colorectal cancer; singlecell RNA sequencing; spatial transcriptomics.


Conflict of interest statement

The authors declare no conflict of interest.

Figures

FIGURE 1
FIGURE 1
Multi‐omics sample processing, integration, and cellular atlas of the colorectal cancer microenvironment across TNM stages (A) Schematic overview of sample collection from CRC patients at varying TNM stages and matched adjacent non‐tumour tissues, followed by processing for integrated single‐cell RNA sequencing (scRNA‐seq), single‐cell VDJ sequencing (scVDJ‐seq), and spatial transcriptomics (stRNA‐seq) analysis. Twenty samples from each of the six patients were processed for sequencing and analyzed. (B) t‐SNE plot illustrating the cell distribution across different patients. Each dot represents an individual cell, with colour indicating the origin of the patient. (C) t‐SNE plot displaying the distribution of different cell types. Different colours represent different cell types. (D) The bubble chart shows marker genes used for definitive cell type identification. Bubble size represents the percentage of cells within a cluster expressing the gene. The colour intensity indicates the average normalized expression level. (E) TNM stage‐associated cellular landscape. t‐SNE visualization highlighting the distribution of cells grouped by their source tissue (tumour vs. paracancerous) and the clinical TNM stage of the originating tumour sample.
FIGURE 2
FIGURE 2
Stage‐dependent dynamics of T cell dysfunction and exhaustion markers in colorectal cancer progression. (A) t‐SNE plot illustrating the identified T‐cell subpopulations. (B) t‐SNE plot displaying the identified CD8⁺ T‐cell subpopulations. (C) The Venn diagram displays differentially expressed genes (DEGs) whose expression levels progressively increase or decrease with advancing clinical stage. Genes were selected based on a log2 fold change (log2FC) > .5 and a p‐value < .05. (D) Heatmap illustrating gene expression changes in CD8⁺ T cells across different clinical stages. Red indicates high expression, blue indicates low expression, and the colour bar at the top denotes different clinical stage groupings. (E) Violin plot showing the expression levels of TNFRSF18 and CXCL13 in CD8⁺ T cells.
FIGURE 3
FIGURE 3
TNFRSF18 is identified as a novel marker of exhausted CD8⁺ T cells in colorectal cancer progression. (A) Two‐dimensional visualization of the CD8⁺ T‐cell developmental trajectory constructed by Monocle 2 (based on the DDRTree algorithm), with colour indicating the pseudotime calculated by Monocle 2. (B) Cell types overlaid on trajectory as in (A), but with different colours and labels representing cell types, and the black line indicating the inferred cell differentiation trajectory. (C) Cell density plot illustrating the distribution of each cell type along the pseudotime trajectory. (D) Scatter plot showing the dynamic expression changes of TNFRSF18 and CXCL13 during cell differentiation (in pseudotime); each dot represents a cell, with colour indicating the cell type. (E) Bubble chart showing the expression of marker genes for exhausted CD8⁺ T (Tex) cells identified by the COSG and Seurat algorithms in CD8⁺ T cells. The size of the dot represents the proportion of cells expressing this gene, and the colour shade represents the average level of expression. (F) Immunofluorescence images (n = 3 patients) showing co‐staining of TNFRSF18 (GITR; green) and TOX (red) in colorectal cancer tissues. DAPI⁺ nuclei (blue) and areas of colocalization (yellow) are indicated. Scale bar: 20 µm.
FIGURE 4
FIGURE 4
The immune regulatory role of TNFRSF18 in T cells was investigated through differential expression analysis and overexpression experiments. (A) Volcano plots showing the differentially expressed genes (DEGs) between TNFRSF18⁺ and. TNFRSF18 CD8⁺ T cells. Significantly upregulated, downregulated, and non‐significant genes are represented by red, blue, and grey dots, respectively. (B) Volcano plots showing the differentially expressed genes (DEGs) between TNFRSF18⁺ and. TNFRSF18 CD4⁺ T cells. (C) Lollipop plots depict the significance and enrichment scores of major enriched pathways, along with adjusted p‐values, for DEGs between TNFRSF18⁺ and TNFRSF18 groups in CD8⁺ T cells. (D) Lollipop plots depict the significance and enrichment scores of major enriched pathways, along with adjusted p‐values, for DEGs between TNFRSF18⁺ and TNFRSF18 groups in CD4⁺ T cells. (E) TNFRSF18 overexpression impairs T cell effector function. qPCR validation of IFNγ and TNFα in TNFRSF18‐overexpressing Jurkat T cells in comparison to that in control groups (n = 3 replicates; *p < .05, unpaired t‐test). Data normalized to GAPDH (mean ± SEM). (F) Western blot analysis of TNFRSF18 expression in Jurkat cells. The left panel represents the negative control (NC) group with electroporation only, while the right panel shows the TNFRSF18 overexpression (TNFRSF18‐OE) group following plasmid transfection. Band intensity reflects relative protein expression levels. Each group included three biological replicates (n = 3).
FIGURE 5
FIGURE 5
Identification of malignant tumour cells and construction of an intercellular communication network. (A) tSNE plot visualization of different cell types. Each dot denotes an individual cell; the colour denotes cluster origin. (B) Volcano diagram demonstrating differentially expressed genes between tumour cells and epithelial cells. (C) Circle plot illustrating ligand–receptor interactions. The size of each dot represents the number of cells within the corresponding cluster, while the width of the connecting lines indicates the strength of communication between different cell clusters. (D) Bar plot showing the differences in the number of communications between epithelial cells and tumour cells with other cell types. (E) Cell communication network diagram, where the middle column represents the cell types receiving signals, and the sides represent the cell types sending signals. The thickness of the lines indicates the communication strength, with thicker lines representing stronger communication.
FIGURE 6
FIGURE 6
Spatial mapping of stemness signatures across colorectal cancer progression. (A) The results of the CytoTRACE analysis depict the stemness score of each cell. The colour on the left indicates the stemness level, while the colours on the right represent different cell subgroups. (B) Left: The heatmap displays the expression patterns of stemness‐related genes in tumour cells and epithelial cells. Right: Based on CytoTRACE analysis, the top 10 genes showing the strongest positive and negative correlations with the stem cell state were identified. (C) Comparison of CytoTRACE scores between tumour and epithelial cells. Higher scores indicate greater stemness potential. (D) Spatial transcriptomics maps displaying the expression patterns of RPS7, RPL8 and RPL30 across TNM stages II–IV. Colour intensity indicates expression levels. (E) Cell type localization mapped onto spatial transcriptomics tissue sections using the RCTD algorithm. (F) Violin plots comparing stemness scores across major TME compartments (HST, high stemness tumour cell; LST, low stemness tumour cell).
FIGURE 7
FIGURE 7
Schematic model for advancing TNM stages shape CD8⁺ T cell exhaustion via TNFRSF18/CXCL13 dynamics and ribosomal stemness in colorectal cancer. This schematic illustrates how advancing TNM stages in colorectal cancer (CRC) shape CD8⁺ T cell exhaustion through divergent TNFRSF18/CXCL13 dynamics and ribosomal stemness. During CRC progression, advancing TNM stages remodel the tumour microenvironment (TME), inducing progressive CD8⁺ T cell exhaustion marked by declining TNFRSF18 and rising CXCL13 expression in tumour‐infiltrating T cells despite significantly elevated expression of both markers in tumour compared with paratumour tissues. Concurrently, tumour cells upregulate stemness‐associated ribosomal proteins (RPS7, RPL30 and RPL8), enabling evasion of TNF signalling‐mediated immune surveillance. Dysfunction of TNF signalling, due to impaired TNFRSF18‐expressing exhausted T cells, fails to suppress high‐stemness tumour cell clusters, creating a feed‐forward loop that promotes immune escape. This TNFRSF18‐stemness axis may represent a potential therapeutic target for stage‐specific intervention in CRC.

Similar articles

References

    1. Morgan E, Arnold M, Gini A, et al. Global burden of colorectal cancer in 2020 and 2040: incidence and mortality estimates from GLOBOCAN. Gut. 2023;72(2):338‐344. doi: 10.1136/gutjnl-2022-327736 - DOI - PubMed
    1. Zeineddine FA, Zeineddine MA, Yousef A, et al. Survival improvement for patients with metastatic colorectal cancer over twenty years. NPJ Precision Oncol. 2023;7(1):16. doi: 10.1038/s41698-023-00353-4 - DOI - PMC - PubMed
    1. Galassi C, Chan TA, Vitale I, Galluzzi L. The hallmarks of cancer immune evasion. Cancer Cell. 2024;42(11):1825‐1863. doi: 10.1016/j.ccell.2024.09.010 - DOI - PubMed
    1. Peitzsch C, Tyutyunnykova A, Pantel K, Dubrovska A. Cancer stem cells: the root of tumor recurrence and metastases. Semin Cancer Biol. 2017;44:10‐24. doi: 10.1016/j.semcancer.2017.02.011 - DOI - PubMed
    1. Chen K, Collins G, Wang H, Toh JWT. Pathological features and prognostication in colorectal cancer. Curr Oncol. 2021;28(6):5356‐5383. doi: 10.3390/curroncol28060447 - DOI - PMC - PubMed

Substances