

Evaluation of Concomitant Imaging Dose in 4D-CBCT Guided Thoracic Radiotherapy
- PMID: 40770953
- PMCID: PMC12332341
- DOI: 10.1177/15330338251366729
Evaluation of Concomitant Imaging Dose in 4D-CBCT Guided Thoracic Radiotherapy
Abstract
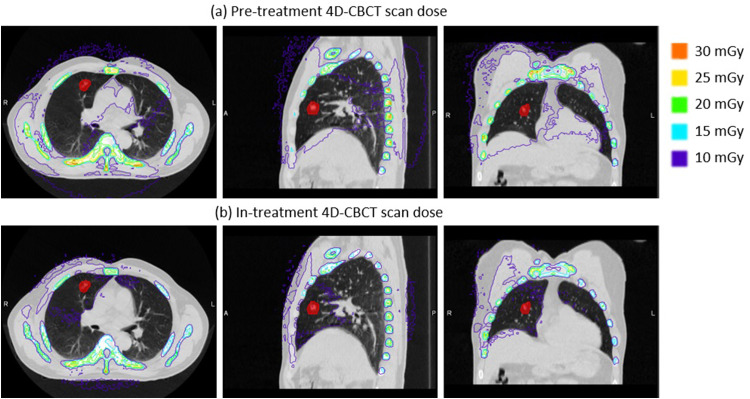
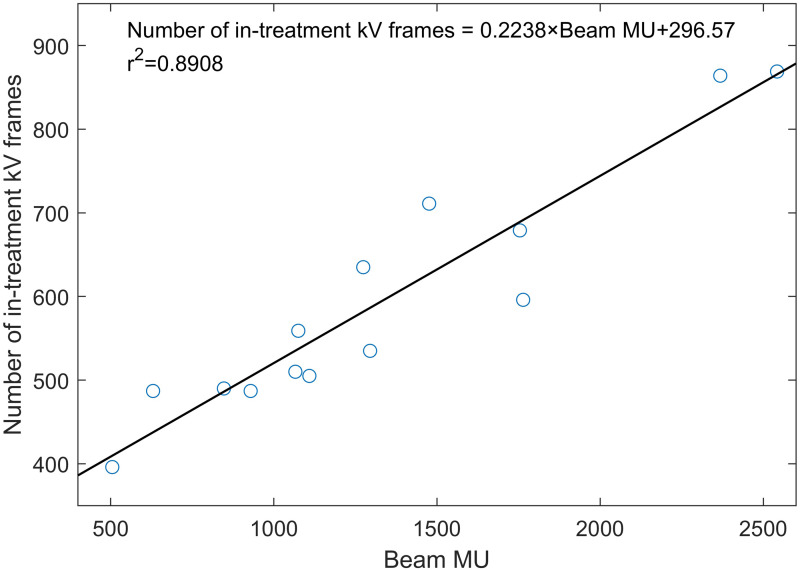
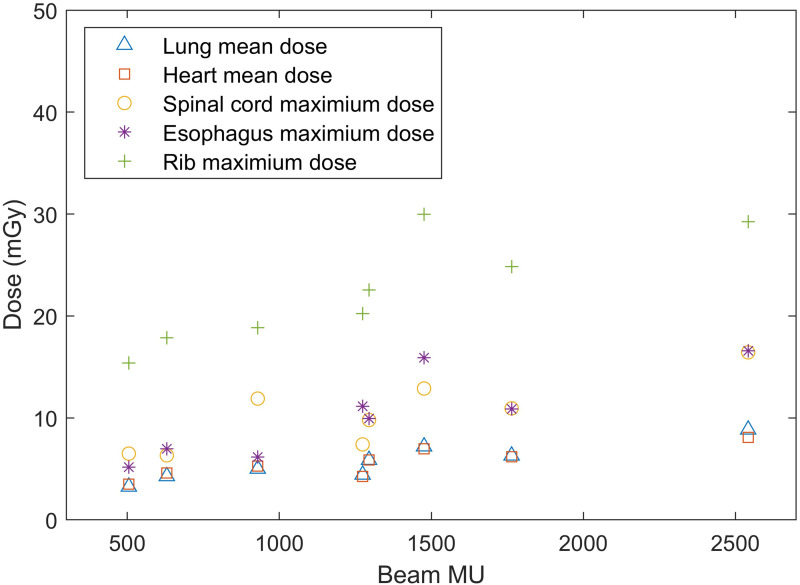
IntroductionThis retrospective study evaluated the imaging dose of 4D-CBCT in patients treated with thoracic radiotherapy.MethodsA geometric model of a 4D-CBCT system was built for Monte Carlo (MC) calculations. Percentage depth dose (PDD) and profiles of the system were measured and compared with MC calculations to verify the model. Eight lung cancer patients were retrospectively selected for 4D-CBCT imaging dose assessment. For each patient, the imaging dose was calculated using the CBCT log file, simulating CT and the MC model. Organ at risk (OAR) dose parameters from the imaging dose were calculated, and the effect of the imaging dose on OAR dose parameters when the imaging dose was added to the treatment dose was analyzed.ResultsDeviations between MC calculations and measurements for PDD and profiles were within 1.1% and 5%, respectively. For a pre-treatment 4D-CBCT scan, the mean lung and heart doses were 9.5 ± 1.4 mGy (mean value ± standard deviation, hereafter the same) and 9.7 ± 1.4 mGy, and the maximum spinal cord, esophagus and ribs doses were 17.6 ± 4.2 mGy, 17.1 ± 3.3 mGy and 37.8 ± 5.3 mGy, respectively. For an in-treatment 4D-CBCT scan, the dose parameters were 5.6 ± 1.8 mGy, 5.6 ± 1.5 mGy, 10.3 ± 3.5 mGy, 10.3 ± 4.3 mGy and 22.4 ± 5.3 mGy, respectively. The OAR dose parameters for in-treatment 4D-CBCT scans showed a relatively strong linear relationship with beam MU and number of frames. For patients receiving 5-fraction treatments and one pre-treatment and one in-treatment 4D-CBCT for each fraction, the increases in lung V20, lung V5, mean lung and heart doses, maximum spinal cord, esophagus and ribs doses were 0.04 ± 0.03%, 0.29 ± 0.23%, 76.3 ± 14.4 mGy, 76.5 ± 12.0 mGy, 76.3 ± 20.2 mGy, 70.5 ± 13.1 mGy and 101.2 ± 20.5 mGy, respectively. The increase in OAR dose parameters was proportional to the number of fractions.ConclusionThe imaging dose of pre-treatment and in-treatment 4D-CBCT was calculated using a validated MC model. For 5-fraction treatments, the imaging dose will likely have minimal clinical impact on OAR dose parameters.
Keywords: 4D-CBCT; Monte Carlo method; imaging dose; in-treatment 4D-CBCT; thoracic radiotherapy.
Conflict of interest statement
Declaration of Conflicting InterestsThe authors declared no potential conflicts of interest with respect to the research, authorship, and/or publication of this article.
Figures


References
-
- Liang J, Lack D, Zhou J, Liu Q, Grills I, Yan D. Intrafraction 4D-cone beam CT acquired during volumetric arc radiotherapy delivery: KV parameter optimization and 4D motion accuracy for lung stereotactic body radiotherapy (SBRT) patients. J Appl Clin Med Phys. 2019 Dec;20(12):10-24. doi: 10.1002/acm2.12755 - DOI - PMC - PubMed
MeSH terms
LinkOut - more resources
Full Text Sources
Medical
Research Materials
