. 2025 Jul 23:17:1607289.
doi: 10.3389/fnagi.2025.1607289. eCollection 2025.

Ambroxol confers neuroprotection against scopolamine-induced Alzheimer's-like pathology by modulating oxidative stress, neuroinflammation, and cognitive deficits via Nrf-2/JNK/GSK-3β signaling pathways

Affiliations

Ambroxol confers neuroprotection against scopolamine-induced Alzheimer's-like pathology by modulating oxidative stress, neuroinflammation, and cognitive deficits via Nrf-2/JNK/GSK-3β signaling pathways

Waqas Ahmad et al. Front Aging Neurosci. .

Abstract

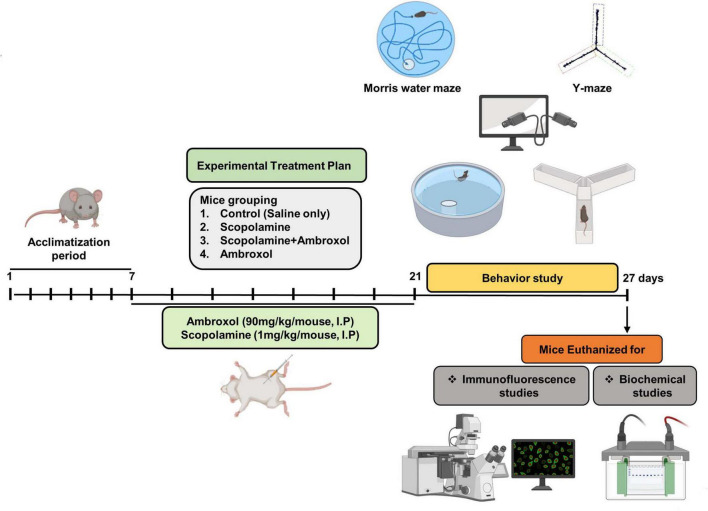
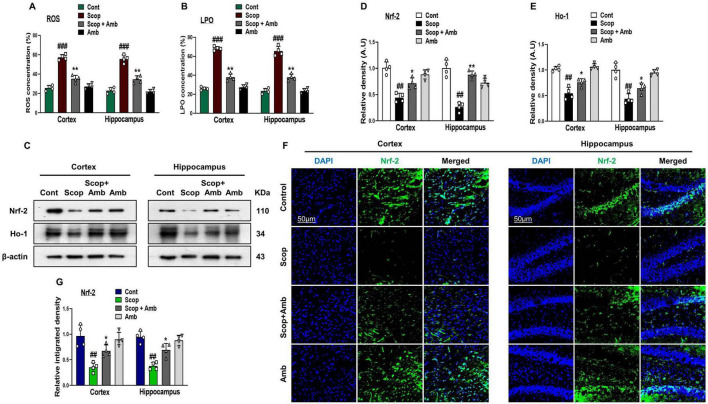
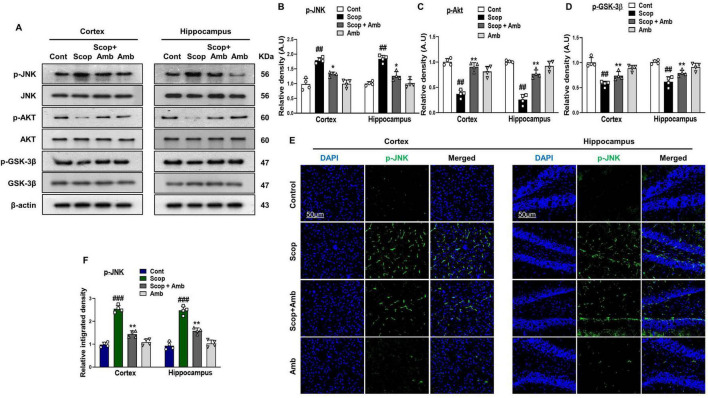
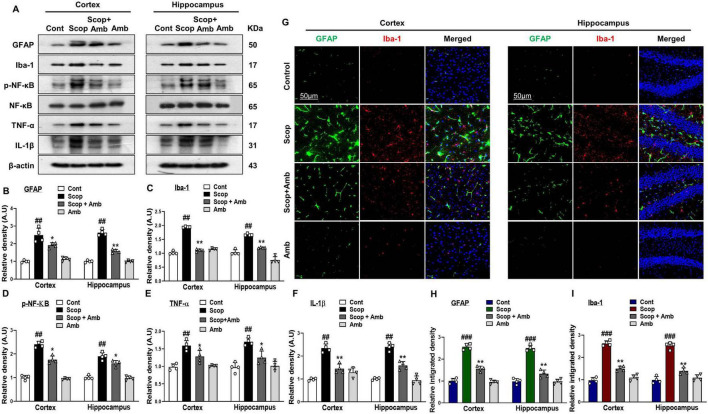
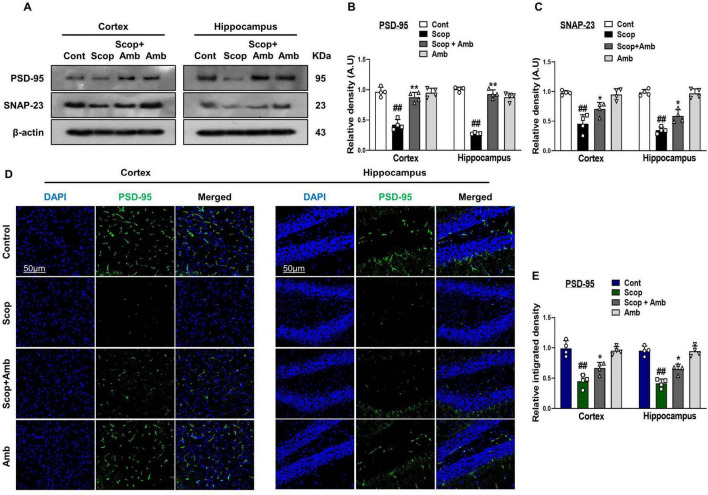
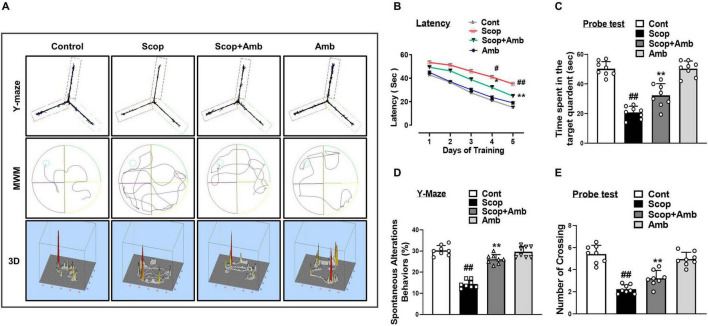
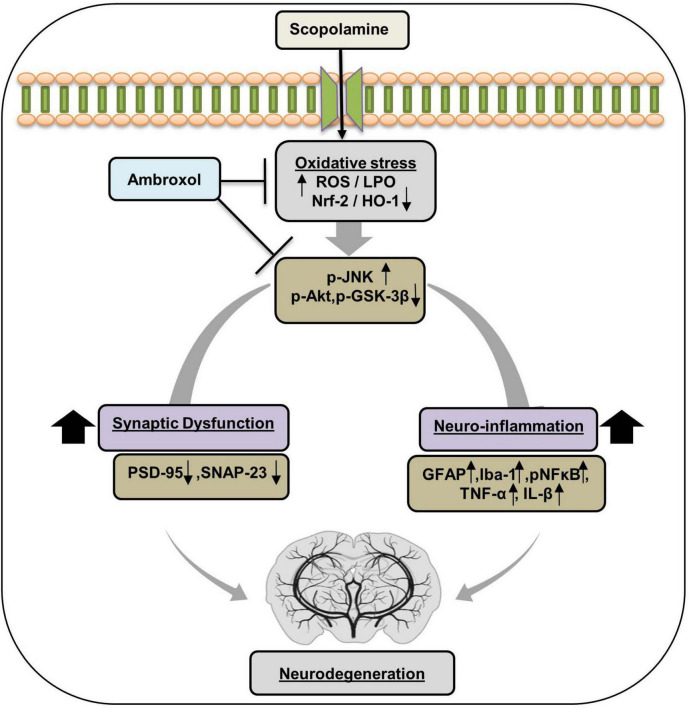
Alzheimer's disease (AD) is the most common and costly chronic progressive neurodegenerative disorder, with the highest impact on public health worldwide. Pathological hallmarks of AD include progressive cognitive decline and memory impairment, dominantly mediated by oxidative neurodegeneration. Oxidative stress is commonly recognized as a key factor in the pathophysiological progression of AD. Despite significant advancements, a definitive and effective therapeutic intervention for AD remains elusive. In this study, we investigate the neuroprotective potential of ambroxol (Amb), known for its potent anti-inflammatory and antioxidant properties. Given ambroxol's potential neuroprotective effects, we explore the underlying molecular mechanisms, explicitly examining its role in attenuating scopolamine-induced oxidative stress-mediated activation of the c-Jun N-terminal kinase (JNK) pathway, as well as its modulation of Akt and glycogen synthase kinase-3 beta (GSK-3β) signaling, which is a key contributor to neuroinflammation, synaptic dysfunction and neurodegeneration. AD pathology is induced by scopolamine administration, leading to excessive lipid peroxidation (LPO) and reactive oxygen species (ROS) generation, which leads to a decline in critical antioxidant proteins, including nuclear factor erythroid 2-related factor 2 (Nrf-2) and heme oxygenase-1 (HO-1). However, ambroxol treatment effectively attenuated oxidative stress by reducing the production of reactive oxidative species while restoring the expression of key antioxidant proteins. Similarly, ambroxol attenuated oxidative stress-induced JNK activation and modulated Akt and GSK-3β alterations. Immunofluorescence and western blot analyses revealed that ambroxol attenuated reactive gliosis by suppressing the expression of GFAP and Iba-1, alongside the downregulation of key pro-inflammatory mediators, such as IL-1β, TNF-α, and phosphorylated NF-κB (p-p65). Scopolamine also compromised synaptic integrity and induced deficits in memory formation and spatial learning. In contrast, ambroxol promoted synaptic integrity by upregulating the expression of SNAP-23 and PSD-95, thereby ameliorating scopolamine-induced impairments in spatial learning and memory.

Keywords: Alzheimer’s disease; ambroxol; neuroinflammation; oxidative stress; scopolamine; synaptic dysfunction..


Conflict of interest statement

MOK was employed by the company Alz-Dementia Korea Co. The remaining authors declare that the research was conducted in the absence of any commercial or financial relationships that could be construed as a potential conflict of interest.

Figures

Experimental timeline for studying mice behavior and treatment. Mice undergo a seven-day acclimatization, followed by treatment groups: control, scopolamine, scopolamine plus ambroxol, and ambroxol. Dosages are 90 milligrams per kilogram for ambroxol and 1 milligram per kilogram for scopolamine, administered intraperitoneally. Behavioral studies are conducted on day twenty-one using the Morris water maze and Y-maze. On day twenty-seven, mice are euthanized for immunofluorescence and biochemical studies, illustrated with lab equipment icons.
FIGURE 1
Diagrammatic representation of the treatment regimens, animal groupings, and experimental setup. Following a 7 days acclimatization period, mice were randomly allocated into four experimental groups. The animals received intraperitoneal (i.p.) injections of scopolamine and ambroxol (Amb) for 14 days. Subsequent to behavioral assessments, the animals were euthanized for subsequent biochemical and immunofluorescence analyses.
A series of panels present data and images related to oxidative stress and protein expression in the cortex and hippocampus. Panels A and B show bar graphs of ROS and LPO concentrations, with various treatments (Cont, Scop, Scop + Amb, Amb) affecting levels differently. Panels D and E depict relative density of Nrf-2 and Ho-1 proteins, while Panel C shows Western blot images for Nrf-2, Ho-1, and β-actin. Panel F features fluorescence microscopy images of Nrf-2 in cortex and hippocampus sections. Panel G displays graphs of relative integrated density for Nrf-2. Statistical significance is indicated by asterisks and hash symbols.
FIGURE 2
Ambroxol reduced reactive oxygen species (ROS) and lipid peroxidation (LPO) levels and concurrently upregulated the expression of nuclear factor erythroid 2-related factor 2 (Nrf-2) and heme oxygenase-1 (HO-1) in the brains of scopolamine-treated mice. (A,B) Representative histograms of ROS and LPO assays in the mice brain cortex and hippocampus. (C) Images of western blot analysis illustrating the protein expression levels of Nrf-2 and HO-1 in the cortex and hippocampus. (D,E) Histograms of Nrf-2 and HO-1 protein expression. (F) Immunofluorescence images depicting the immunoreactivity of Nrf-2 protein in the cortex and hippocampus. (G) Corresponding bar graphs of Nrf-2 immunofluorescence. β-actin was used as the loading control. Band intensities were cropped and quantified using ImageJ software, and the variations are illustrated in the corresponding histogram; Magnification 10×. Scale bar 50 μm. All data are presented as mean ± S.E.M, with corresponding bar graphs. An asterisk (*) denotes a significant difference from the normal saline-treated group; hash (#) indicates a significant difference from the scopolamine-treated group. Significance: *P ≤ 0.05, **P ≤ 0.01, ***P ≤ 0.001; #P ≤ 0.05, ##P ≤ 0.01; ###P ≤ 0.001.
A composite image showing multiple panels of biochemical and histological data. Panel A: Western blots display protein expression in the cortex and hippocampus across different treatments, labeled Cont, Scop, Scop + Amb, and Amb. Panels B-D: Bar graphs represent relative density measurements of p-JNK, p-AKT, and p-GSK-3β, each comparing treatment effects in cortex and hippocampus. Panel E: Microscopic images show DAPI and p-JNK staining in cortex and hippocampus, with merged views for each treatment condition. Panel F: A bar graph quantifies p-JNK levels, illustrating significant differences between treatments.
FIGURE 3
Ambroxol modulates the expression of p-JNK, p-Akt, and p-GSK-3β in the mouse brain, thereby alleviating scopolamine-induced stress. (A) Images of western blot analysis illustrating the protein expression levels of p-JNK, p-Akt, and p-GSK-3β in the cortex and hippocampus. (B–D) Histograms of p-JNK, p-Akt, and p-GSK-3β protein expression. (E) Immunofluorescence images depicting the immunoreactivity of p-JNK protein in the cortex and hippocampus. (F) Corresponding bar graphs of p-JNK immunofluorescence. β-actin was used as the loading control. Band intensities were cropped and quantified using ImageJ software, and the variations are illustrated in the corresponding histogram; Magnification 10x. Scale bar 50 μm. All data are presented as mean ± S.E.M, with corresponding bar graphs. An asterisk (*) denotes a significant difference from the normal saline-treated group; hash (#) indicates a significant difference from the scopolamine-treated group. Significance: *P ≤ 0.05, **P ≤ 0.01, ***P ≤ 0.001; #P ≤ 0.05, ##P ≤ 0.01; ###P ≤ 0.001.
Western blot analysis and microscopy images illustrating protein expression in cortex and hippocampus under different conditions: Control, Scopolamine (Scop), Scop plus Ambroxol (Amb), and Ambroxol. Panels A-I show protein bands for GFAP, Iba-1, p-NF-κB, NF-κB, TNF-α, and IL-1β with corresponding quantitative graphs. Microscopy sections display GFAP and Iba-1 immunofluorescence with merged images, highlighting cell morphology changes. Bar graphs depict relative density and integrated intensity of these markers across conditions.
FIGURE 4
Ambroxol inhibited scopolamine-induced glial cell activation and suppressed the upregulation of inflammatory proteins in the mice brain. (A) Images of western blot analysis illustrating the protein expression levels of GFAP, Iba-1, p-NF-κB (p-p65), TNF-α, and IL-1β in the cortex and hippocampus. (B–F) Histograms of GFAP, Iba-1, p-NF-κB (p-p65), TNF-α, and IL-1β protein expression. (G) Immunofluorescence images depicting the immunoreactivity of GFAP and Iba-1 protein in the cortex and hippocampus. (H,I) Corresponding bar graphs of GFAP and Iba-1 immunofluorescence. β-actin was used as the loading control. Band intensities were cropped and quantified using ImageJ software, and the variations are illustrated in the corresponding histogram; Magnification 10x. Scale bar 50 μm. All data are presented as mean ± S.E.M, with corresponding bar graphs. An asterisk (*) denotes a significant difference from the normal saline-treated group; hash (#) indicates a significant difference from the scopolamine-treated group. Significance: *P ≤ 0.05, **P ≤ 0.01, ***P ≤ 0.001; #P ≤ 0.05, ##P ≤ 0.01; ###P ≤ 0.001.
Western blot and immunofluorescence analyses display data on protein expression in cortex and hippocampus samples. Panel A shows protein bands for PSD-95, SNAP-23, and β-actin. Panels B and C present bar graphs of relative density for PSD-95 and SNAP-23 across different treatments. Panel D provides immunofluorescence images showing expression of PSD-95 with DAPI staining in cortex and hippocampus. Panel E shows a bar graph for PSD-95 relative integrated density across treatments. Statistical significance is indicated by asterisks and hashtags.
FIGURE 5
Effect of Ambroxol on scopolamine-induced synaptic dysfunction and memory impairment in mice brain. (A) Images of western blot analysis illustrating the protein expression levels of PSD-95 and SNAP-23 in the cortex and hippocampus. (B,C) Histograms of PSD-95 and SNAP-23 protein expression. (D) Immunofluorescence images depicting the immunoreactivity of PSD-95 protein in the cortex and hippocampus. (E) Corresponding bar graphs of PSD-95 immunofluorescence. β-actin was used as the loading control. Band intensities were cropped and quantified using ImageJ software, and the variations are illustrated in the corresponding histogram; Magnification 10×. Scale bar 50 μm. All data are presented as mean ± S.E.M, with corresponding bar graphs. An asterisk (*) denotes a significant difference from the normal saline-treated group; hash (#) indicates a significant difference from the scopolamine-treated group. Significance: *P ≤ 0.05, **P ≤ 0.01, ***P ≤ 0.001; #P ≤ 0.05, ##P ≤ 0.01; ###P ≤ 0.001.
Panel A contains three sets of images comparing Control, Scop, Scop+Amb, and Amb groups. The first row shows Y-maze paths, the second row displays Morris Water Maze (MWM) paths, and the third row presents 3D heat maps. Panel B is a line graph depicting latency times over five days of training for each group, with Control showing the fastest learning. Panels C, D, and E are bar graphs illustrating the time spent in the target quadrant, spontaneous alternation behavior, and the number of crossings, respectively, with statistical significance indicated for certain comparisons.
FIGURE 6
Ambroxol enhances learning memory and improves spontaneous alteration behavior in mice with scopolamine-induced memory impairment. (A) Trajectories of Y-maze and Morris water maze analysis. (B) Mean escape latency to reach the hidden platform during the training sessions. (C) Time spent in the platform quadrant, where the hidden platform was located, during the trial session. (D) The percentage of spontaneous alteration behavior during the Y-maze analysis. (E) The average number of target crossings at the hidden platform during the Morris water maze (MWM) test probe trial. For the behavioral study, each experimental group consisted of eight mice (n = 8). All data are presented as mean ± S.E.M, with corresponding bar graphs. An asterisk (*) denotes a significant difference from the normal saline-treated group; hash (#) indicates a significant difference from the scopolamine-treated group. Significance: *P ≤ 0.05, **P ≤ 0.01, ***P ≤ 0.001; #P ≤ 0.05, ##P ≤ 0.01; ###P ≤ 0.001.
Diagram illustrating the effects of scopolamine on oxidative stress, leading to neuro-inflammation and synaptic dysfunction. Scopolamine increases oxidative stress markers (ROS/LPO) and reduces Nrf-2/HO-1, affecting signaling pathways (p-JNK, p-Akt). This results in synaptic dysfunction (reduced PSD-95, SNAP-23) and neuro-inflammation (increased GFAP, Iba-1, pNFκB, TNF-α, IL-β), contributing to neurodegeneration. Ambroxol inhibits these pathways. Arrows indicate the flow of influence.
FIGURE 7
Diagrammatic representation of Ambroxol’s suggested neuroprotective mechanism against oxidative stress, neuroinflammation, synaptic dysfunction, and memory impairment against scopolamine.

Similar articles

References

    1. Abu Almaaty A. H., Mosaad R. M., Hassan M. K., Ali E. H., Mahmoud G. A., Ahmed H., et al. (2021). Urtica dioica extracts abolish scopolamine-induced neuropathies in rats. Environ. Sci. Pollut. Res. Int. 28 18134–18145. 10.1007/s11356-020-12025-y - DOI - PubMed
    1. Ahmad S., Choe K., Badshah H., Ahmad R., Ali W., Rehman I. U., et al. (2024). Physcion mitigates LPS-induced neuroinflammation, oxidative stress, and memory impairments via TLR-4/NF-κB signaling in adult mice. Pharmaceuticals 17:1199. 10.3390/ph17091199 - DOI - PMC - PubMed
    1. Ahmadi E., Afrooghe A., Soltani Z. E., Elahi M., Shayan M., Ohadi M. A. D., et al. (2024). Beyond the lungs: Exploring diverse applications of bromhexine and ambroxol. Life Sci. 353:122909. 10.1016/j.lfs.2024.122909 - DOI - PubMed
    1. Ali J., Khan A., Park J. S., Tahir M., Ahmad W., Choe K., et al. (2023). Neuroprotective effects of N-methyl-(2S, 4R)-trans-4-hydroxy-L-proline (NMP) against Amyloid-β-induced Alzheimer’s disease mouse model. Nutrients 15:4986. 10.3390/nu15234986 - DOI - PMC - PubMed
    1. Ali T., Badshah H., Kim T. H., Kim M. (2015). Melatonin attenuates D-galactose-induced memory impairment, neuroinflammation and neurodegeneration via RAGE/NF-KB/JNK signaling pathway in aging mouse model. J. Pineal Res. 58 71–85. 10.1111/jpi.12194 - DOI - PubMed

LinkOut - more resources