. 2025 Jul 23:17:1626021.
doi: 10.3389/fnagi.2025.1626021. eCollection 2025.

Neuropeptide Y mRNA expression in the aging inferior colliculus of fischer brown norway rats

Affiliations

Neuropeptide Y mRNA expression in the aging inferior colliculus of fischer brown norway rats

Laila S Almassri et al. Front Aging Neurosci. .

Abstract

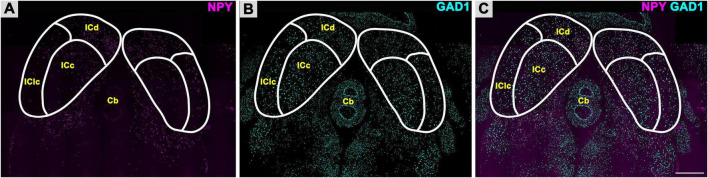
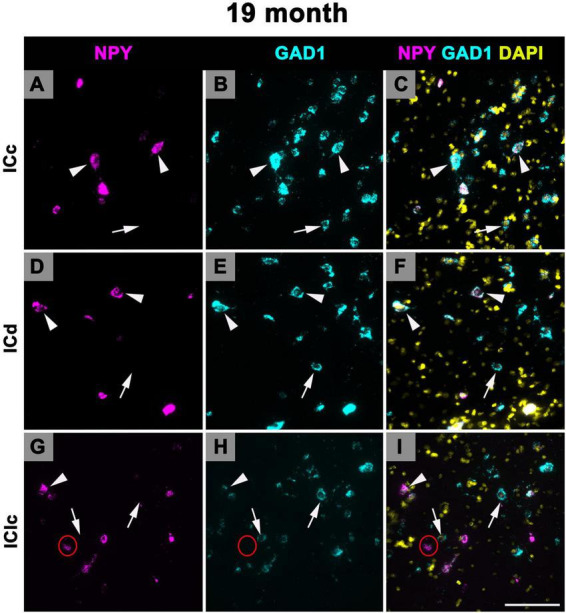
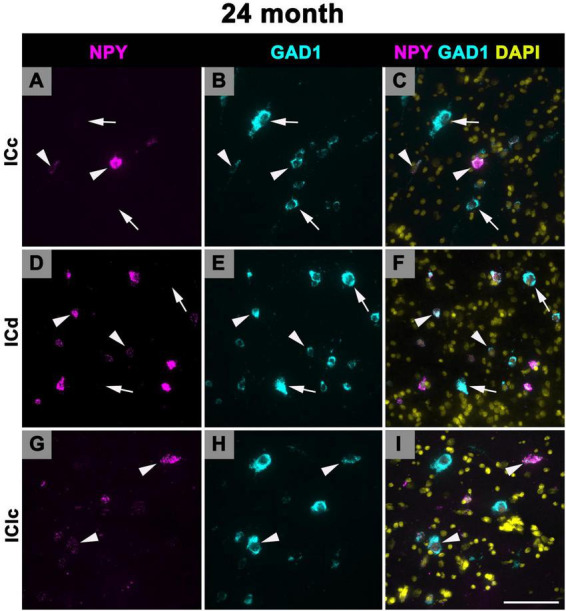
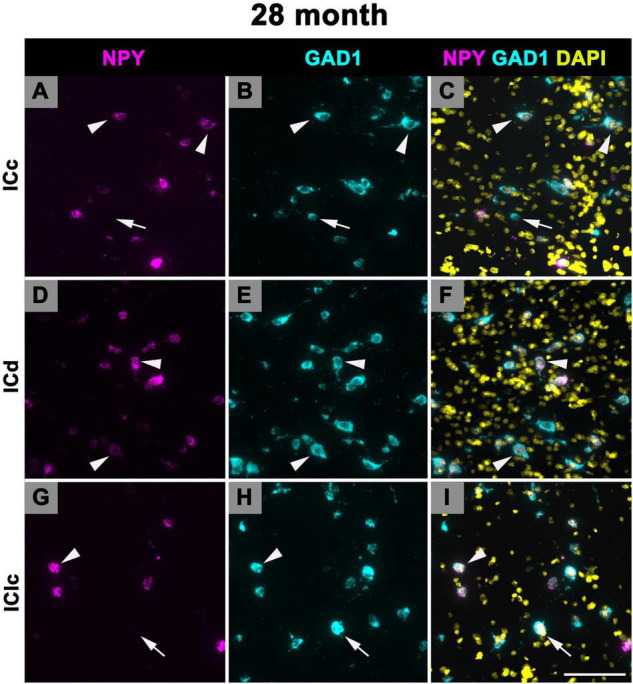
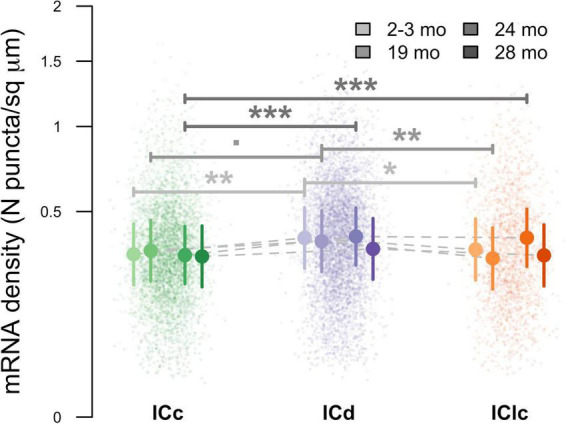
Introduction: A major contributor to age-related hearing loss is the decline of GABAergic inhibition, particularly in the inferior colliculus (IC), which is the midbrain hub of the central auditory system. The initial loss of inhibition is thought to be a compensatory mechanism in response to decreased peripheral excitation. However, the downregulation of inhibition in the IC persists with age and leads to functional disruptions and central neural gain. Neuropeptide Y (NPY) is co-expressed by a sub-population of GABAergic IC cells whose age-related changes remain unexplored. We sought to characterize GABAergic cells in the major subdivisions of the IC that express NPY mRNA to determine whether NPY mRNA is altered in aging IC cells.

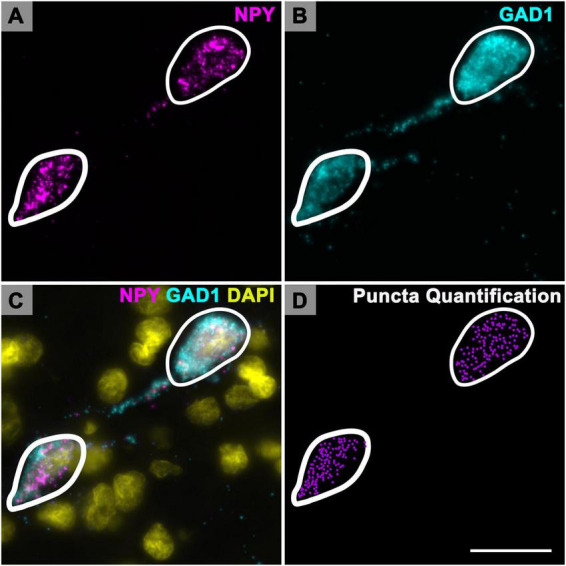
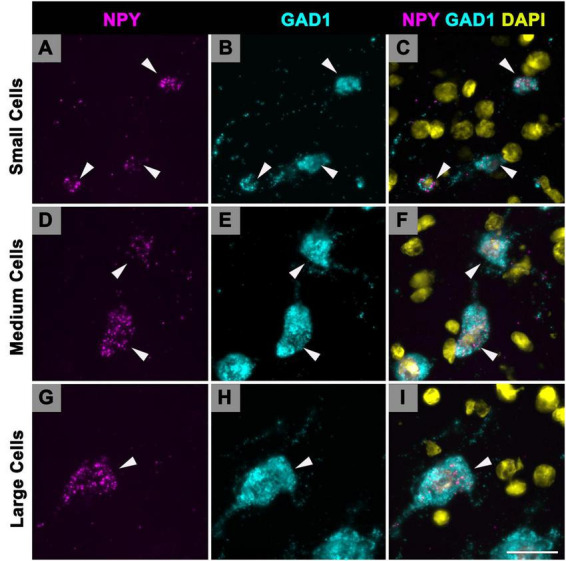
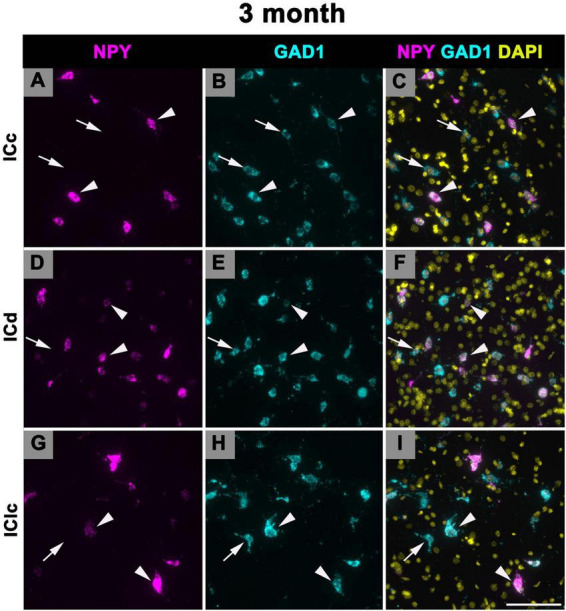
Methods: We used multiplexed fluorescent in situ hybridization (smFISH) to label lemniscal and non-lemniscal IC cells that express NPY mRNA and/or GAD1 mRNA in four age groups of Fischer Brown Norway (FBN) rats.

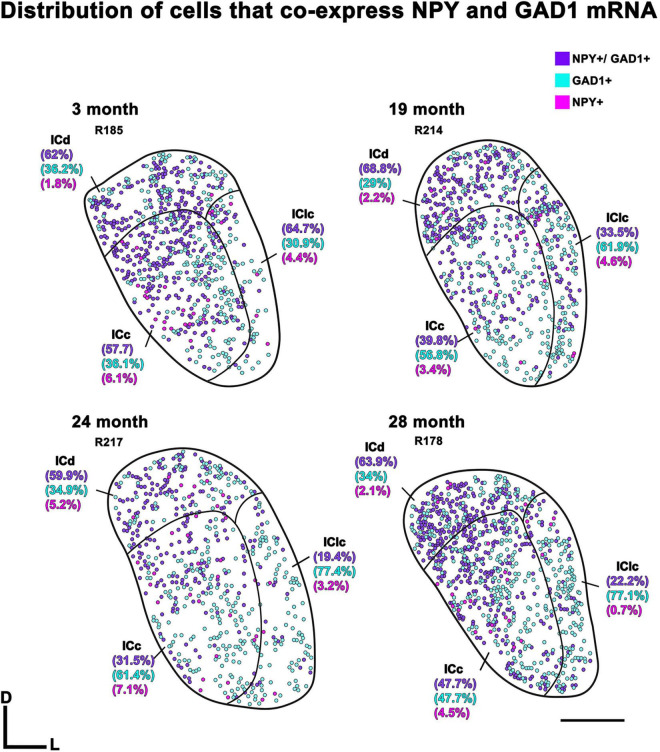
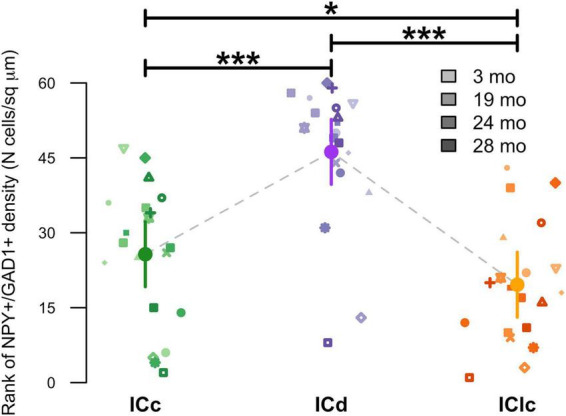
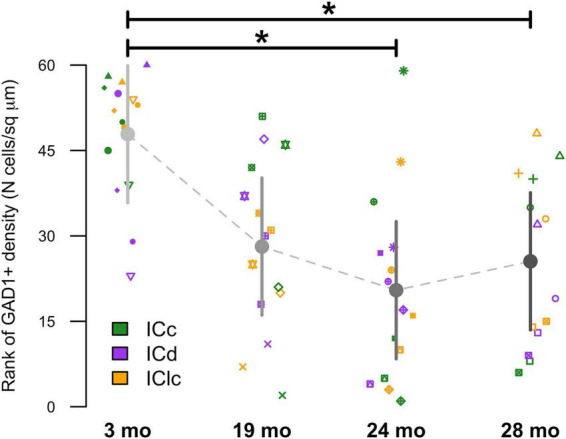
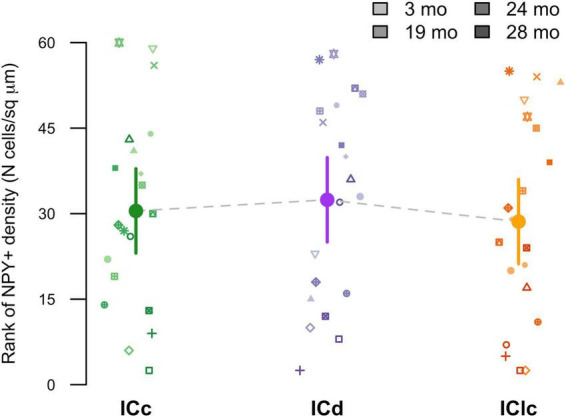
Results: The data demonstrate that ∼38% of GABAergic IC cells co-express NPY, the largest proportion of NPY cells is in the non-lemniscal dorsal IC (ICd), the majority of NPY cells have medium profile areas, and the expression of individual NPY mRNA is unaffected by age.

Discussion: While GABAergic inhibition is reduced with age, it appears that NPY driven inhibition may remain intact. GABAergic neurons that co-express NPY may represent a marked population that persists throughout aging, suggesting that they are not the primary contributor to age-related loss of inhibition.

Keywords: GAD1 mRNA; NPY; NPY mRNA; aging; inferior colliculus; smFISH.


Conflict of interest statement

The authors declare that the research was conducted in the absence of any commercial or financial relationships that could be construed as a potential conflict of interest.

Figures

Four-panel microscopic image showing stained cells. Panel A highlights NPY in magenta. Panel B displays GAD1 in cyan. Panel C shows NPY, GAD1, and DAPI combined in magenta, cyan, and yellow, respectively. Panel D focuses on puncta quantification as magenta dots. Each panel is labeled and distinct cellular structures are outlined in white.
FIGURE 1
Quantification of Neuropeptide Y (NPY) messenger ribonucleic acid (mRNA) puncta in inferior colliculus (IC) cells. High magnification photomicrographs showing cells expressing NPY mRNA (magenta) and glutamate decarboxylase 1 (GAD1) mRNA (cyan) in the ICd of a middle aged (19 months) animal. At 150× magnification the individual mRNA signals are optically resolved. (A) Each magenta signal represents a single mRNA for NPY. (B) Same cells imaged to show GAD1 mRNA expression. (C) Merged image showing colocalization of NPY mRNA and GAD1 mRNA in each cell. DAPI (yellow) counterstain. (D) Plot of the same cells. White contours outline the somatic profile area of each cell (profile areas: 278.6 μm2, left cell; 333.9 μm2, right cell). Profile area was determined by counterstaining the tissue with NeuroTrace (not shown). Each purple puncta represents a single mRNA for NPY. Scale bar = 25 μm.
Three panels show brain regions with distinct labels and colors. Panel A displays NPY in magenta, highlighting regions ICd, ICc, IClc, and Cb outlined in white. Panel B shows GAD1 in cyan with similar regions. Panel C merges both colors, showing overlap. Each panel is outlined with the same brain region markers.
FIGURE 2
Fluorescent in situ hybridization for Neuropeptide Y (NPY) and glutamate decarboxylase 1 (GAD1) messenger ribonucleic acid (mRNA). NPY mRNA is expressed in all subdivisions of the inferior colliculus (IC). (A) Low magnification image of NPY mRNA (magenta) expression in the ICc, ICd, and IClc. (B) Expression of GAD1 mRNA (cyan) in the ICc, ICd, and IClc. (C) Merged image showing differential expression of NPY mRNA as compared to GAD1 mRNA across the IC. Scale bar = 1 mm.
Cell distribution diagrams showing co-expression of NPY and GAD1 mRNA at 3, 19, 24, and 28 months. Each panel displays clusters of colored dots: purple for NPY+/GAD1+, blue for GAD1+, and pink for NPY+. Regions ICd, IClc, and ICc are labeled with percentages of each expression type. A scale bar and directional markers are included.
FIGURE 3
Plots showing the distribution of inferior colliculus (IC) cells that co-express Neuropeptide Y (NPY) messenger ribonucleic acid (mRNA) and glutamate decarboxylase 1 (GAD1) mRNA (purple circles), only express NPY mRNA (pink circles), or only express GAD1 mRNA (blue circles) across four age groups. Percentage of IC cells that co-express NPY mRNA and GAD1 mRNA for the individual subdivisions are shown in parentheses. Plotted sections were chosen between interaural levels 0.12–0.48 mm; (Paxinos and Watson, 1998). D, dorsal; L, lateral. Transverse sections at a mid-rostrocaudal level of the IC. Scale bar = 1 mm.
Scatter plot showing the rank of NPY+/GAD1+ cell density across three groups: ICc, ICd, and IClc. Symbols represent different age groups at 3, 19, 24, and 28 months. ICc is in green, ICd in purple, and IClc in orange. Error bars indicate variability within groups. Asterisks denote statistically significant differences between groups, with more asterisks indicating higher significance.
FIGURE 4
Variation in NPY+/GAD1+ density as a function of age and inferior colliculus (IC) subdivision [i.e., central (ICc), dorsal cortex (ICd), or lateral cortex (IClc)]. Raw data were rank-transformed prior to analysis due to departure from distributional normality (Wood and Games, 1990). Small markers indicate measurements of individual animals, with different symbols representing individuals and darker hues indicating older ages, as shown in the legend. Large circles with error bars represent estimated marginal means within each IC subdivision, and 95% confidence intervals around these means, respectively, as predicted by the mixed-effects regression model. Horizontal bars indicate significant differences between groups (*, p < 0.05; ***, p < 0.001).
Scatter plot showing rank of GAD1+ density (number of cells per square micrometer) over time, at 3, 19, 24, and 28 months. Data points are marked in different shapes for ICc, ICd, and IClc, using green squares, purple squares, and yellow squares, respectively. Averages are connected with a dotted line, with error bars. Significant differences are indicated with asterisks over horizontal lines.
FIGURE 5
Variation in GAD1+ as a function of age and inferior colliculus (IC) subdivision [i.e., central (ICc), dorsal cortex (ICd), or lateral cortex (IClc)]. Raw data were rank-transformed prior to analysis due to departure from distributional normality (Wood and Games, 1990). Small markers indicate measurements of individual animals, with different symbols representing individuals. Large circles with error bars represent the estimated marginal means at each age, and 95% confidence intervals around these means, respectively, as predicted by the mixed-effects regression model. Horizontal bars indicate significant differences between groups (*, p < 0.05).
Scatter plot showing the rank of NPY+ cell density across three groups: ICc, ICd, and IClc, with data points in shades of green, purple, and orange. Different symbols represent months: 3, 19, 24, and 28. Vertical error bars indicate variation within each group.
FIGURE 6
Variation in NPY+ density as a function of age and IC subdivision [i.e., central (ICc), dorsal cortex (ICd), or lateral cortex (IClc)]. Raw data were rank-transformed prior to analysis due to departure from distributional normality (Wood and Games, 1990). Small markers indicate measurements of individual animals, with different symbols representing individuals and darker sha. Large circles with error bars represent estimated marginal means at each age, and 95% confidence intervals around these means, respectively, as predicted by the mixed-effects regression model.
Fluorescent microscopy images showing small, medium, and large cells. Columns A, D, G display NPY in magenta, columns B, E, H show GAD1 in cyan, and columns C, F, I combine NPY, GAD1, and DAPI in yellow. Arrowheads indicate highlighted areas in each panel.
FIGURE 7
Cells that express Neuropeptide Y (NPY) messenger ribonucleic acid (mRNA) vary in soma profile area. High magnification (150×) photomicrographs showing NPY mRNA expression in small, medium, and large cells, based on soma size classification of GAD1+ cells in previous studies (small, < 124 μm2; medium, 124–411 μm2; large, > 411 μm2). NPY mRNA is shown in magenta, glutamate decarboxylase 1 (GAD1) mRNA is shown in cyan, and DAPI is shown in yellow. Each row represents a single cell size. (A–C) Photomicrographs of small cells (arrowheads) in the ICd of a young (3 months) animal (top cell, 119.6 μm2; middle cell, 116.5 μm2; bottom cell, 69.8 μm2). (D–F) Photomicrographs of medium cells (arrowheads) in the ICd of a young (3 months) animal (top cell, 233.4 μm2; bottom cell, 365.6 μm2). (G–I) Photomicrographs of large cells (arrowheads) in the ICc of a young (3 months) animal (center cell, 587.4 μm2). Scale bar = 25 μm.
Labeled “3 month,” this image contains three rows and three columns, showing fluorescent microscopy results. The columns represent NPY (magenta), GAD1 (cyan), and a merged view with DAPI (yellow) stainings. The rows are labeled Icc, Icd, and IClc, with each panel displaying cellular structures highlighted by arrows and arrowheads. Panels A, D, and G show NPY; B, E, and H show GAD1; and C, F, I are the merged images displaying all markers together.
FIGURE 8
Structured illumination fluorescence images, taken at 0.2 μm steps, showing cells that co-express Neuropeptide Y (NPY) messenger ribonucleic acid (mRNA) and glutamate decarboxylase 1 (GAD1) mRNA (arrowheads) and cells that only express GAD1 mRNA (arrows) in a young (3 months) animal. NPY mRNA is shown in magenta, GAD1 mRNA is shown in cyan, and DAPI is shown in yellow. Each row represents a subdivision of the IC. (A–C) Photomicrographs from the ICc. (D–F) Photomicrographs from the ICd. (G–I) Photomicrographs from the IClc. Scale bar = 100 μm.
Fluorescent microscopy images labeled A to I showing brain sections at 19 months. Panels A, D, and G display NPY in magenta; B, E, and H show GAD1 in cyan; C, F, and I combine NPY, GAD1, and DAPI in yellow. Arrowheads and arrows indicate regions of interest. Circles appear in G and H. Sections are labeled ICc, ICd, and IClc.
FIGURE 9
Structured illumination fluorescence images, taken at 0.2 μm steps, showing cells that co-express Neuropeptide Y (NPY) messenger ribonucleic acid (mRNA) and glutamate decarboxylase 1 (GAD1) mRNA (arrowheads) and cells that only express GAD1 mRNA (arrows) in an early middle age (19 months) animal. NPY mRNA is shown in magenta, GAD1 mRNA is shown in cyan, and DAPI is shown in yellow. Each row represents a subdivision of the IC. (A–C) Photomicrographs from the ICc. (D–F) Photomicrographs from the ICd. (G–I) Photomicrographs from the IClc. Red circle depicts a cell that is expressing NPY mRNA only. Scale bar = 100 μm.
Fluorescent microscopy images of brain tissue at 24 months showing three markers: NPY in magenta, GAD1 in cyan, and DAPI in yellow. Panels A, D, and G show NPY, panels B, E, and H show GAD1, and panels C, F, and I show merged colors. Arrowheads and arrows indicate specific cell locations across the ICC, ICd, and IClc regions.
FIGURE 10
Structured illumination fluorescence images, taken at 0.2 μm steps, showing cells that co-express Neuropeptide Y (NPY) messenger ribonucleic acid (mRNA) and glutamate decarboxylase 1 (GAD1) mRNA (arrowheads) and cells that only express GAD1 mRNA (arrows) in a late middle age (24 months) animal. NPY mRNA is shown in magenta, GAD1 mRNA is shown in cyan, and DAPI is shown in yellow. Each row represents a subdivision of the IC. (A–C) Photomicrographs from the ICc. (D–F) Photomicrographs from the ICd. (G–I) Photomicrographs from the IClc. Scale bar = 100 μm.
Fluorescent microscopy images showing brain tissue at twenty-eight months. Panels A, D, and G display NPY in magenta. Panels B, E, and H show GAD1 in cyan. Panels C, F, and I combine NPY, GAD1, and DAPI staining, resulting in magenta, cyan, and yellow respectively. Each row represents different regions: ICc, ICd, and IClc. Arrowheads and arrows highlight specific areas or structures within the tissue.
FIGURE 11
Structured illumination fluorescence images, taken at 0.2 μm steps, showing cells that co-express Neuropeptide Y (NPY) messenger ribonucleic acid (mRNA) and glutamate decarboxylase 1 (GAD1) mRNA (arrowheads) and cells that only express GAD1 mRNA (arrows) in an old (28 months) animal. NPY mRNA is shown in magenta, GAD1 mRNA is shown in cyan, and DAPI is shown in yellow. Each row represents a subdivision of the IC. (A–C) Photomicrographs from the ICc. (D–F) Photomicrographs from the ICd. (G–I) Photomicrographs from the IClc. Scale bar = 100 μm.
Dot plot showing mRNA density (N puncta/sq. µm) across three groups: ICc, ICd, and IClc, with data points in green, purple, and orange respectively. Different symbols represent age groups: 2-3, 19, 24, and 28 months. Statistical significance is indicated with asterisks, with three asterisks denoting p < 0.001, two for p < 0.01, and one for p < 0.05. Horizontal brackets show comparisons.
FIGURE 12
Variation in messenger ribonucleic acid (mRNA) density as a function of age and inferior colliculus (IC) subdivision [i.e., central (ICc), dorsal cortex (ICd), or lateral cortex (IClc)]. Raw data were log-transformed prior to analysis to improve distributional normality. Small circles indicate replicate measurements of individual animals. Large circles with error bars represent estimated marginal means within each age group and IC subdivision, and 95% confidence intervals around these means, respectively, as predicted by the mixed-effects regression model. For both small and large circles, darker colors indicated older ages, as shown in the legend. Horizontal bars indicate significant differences between ages within groups (= p < 0.1; *, p < 0.05; **, p < 0.01; ***, p < 0.001).

Similar articles

References

    1. Altschuler R. A., Tong L., Holt A. G., Oliver D. L. (2008). Immunolocalization of vesicular glutamate transporters 1 and 2 in the rat inferior colliculus. Neuroscience 154 226–232. 10.1016/j.neuroscience.2008.03.036 - DOI - PMC - PubMed
    1. Anair J. D., Silveira M. A., Mirjalili P., Beebe N. L., Schofield B. R., Roberts M. T. (2022). Inhibitory NPY neurons provide a large and heterotopic commissural projection in the inferior colliculus. Front. Neural Circuits 16:871924. 10.3389/fncir.2022.871924 - DOI - PMC - PubMed
    1. Angelucci F., Gelfo F., Fiore M., Croce N., Mathé A. A., Bernardini S., et al. (2014). The effect of neuropeptide Y on cell survival and neurotrophin expression in in-vitro models of Alzheimer’s disease. Can. J. Physiol. Pharmacol. 92 621–630. 10.1139/cjpp-2014-0099 - DOI - PubMed
    1. Aoki C., Pickel V. M. (1990). Neuropeptide Y in cortex and striatum. Ultrastructural distribution and coexistence with classical neurotransmitters and neuropeptides. Ann. N. Y. Acad. Sci. 611 186–205. 10.1111/j.1749-6632.1990.tb48931.x - DOI - PubMed
    1. Auerbach B. D., Radziwon K., Salvi R. (2019). Testing the central gain model: Loudness growth correlates with central auditory gain enhancement in a rodent model of hyperacusis. Neuroscience 407 93–107. 10.1016/j.neuroscience.2018.09.036 - DOI - PMC - PubMed

LinkOut - more resources