. 2025 Jul 23:12:1628847.
doi: 10.3389/fnut.2025.1628847. eCollection 2025.

Partially hydrolyzed, whey-based infant formula with six human milk oligosaccharides, B. infantis LMG11588, and B. lactis CNCM I-3446 is safe, well tolerated, and improves gut health: a staged analysis of a randomized trial

Affiliations

Partially hydrolyzed, whey-based infant formula with six human milk oligosaccharides, B. infantis LMG11588, and B. lactis CNCM I-3446 is safe, well tolerated, and improves gut health: a staged analysis of a randomized trial

Jean-Charles Picaud et al. Front Nutr. .

Abstract

Background and aims: Gut health and microbiome development are closely linked in early life, with human milk oligosaccharides (HMOs) playing a key role. This study reports results through 4 months of age from a trial evaluating an infant formula containing a synbiotic blend of HMOs and probiotics, focusing on growth, gastrointestinal (GI) tolerance, and gut health biomarkers from birth to 15 months.

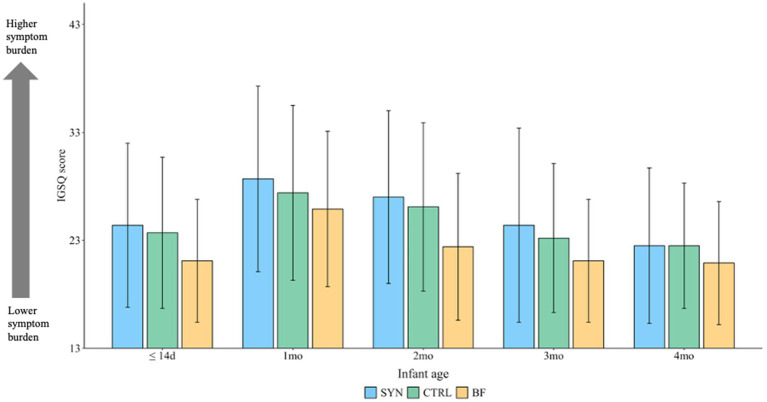
Materials and methods: Healthy infants aged ≤14 days were randomized to receive either the experimental formula (SYN; control formula supplemented with six HMOs and two probiotics [B. infantis, B. lactis]) or the control formula (CTRL; partially hydrolyzed 100% whey-based formula). A non-randomized breastfed (BF) group served as a reference. The primary endpoint was weight gain velocity in SYN vs. CTRL through 4 months of age. Secondary endpoints included fecal outcomes (abundance of bifidobacteria, immune and gut health markers), GI tolerance, and adverse events (AEs).

Results: The full analysis set (FAS) included 313 infants (118 in SYN, 114 in CTRL, and 81 BF), while the per-protocol population (PP) included 227 infants (84 in SYN, 84 in CTRL, and 59 BF). Weight gain velocity through 4 months in the SYN group was non-inferior to that in the CTRL group in both FAS and PP analyses (both p < 0.0001). Parent-reported GI tolerance and stool patterns were similar between SYN and CTRL groups through 4 months. At 3 months, Bifidobacteria abundance was significantly higher in the SYN group compared to the CTRL group (p = 0.004). Fecal pH was lower in the SYN group than in the CTRL group (p = 0.018) and more closely resembled that of the BF group. Immune and gut health markers were similar between the SYN and BF groups. No significant differences in AEs were observed across groups.

Conclusion: The synbiotic-supplemented infant formula supported healthy, age-appropriate growth, good GI tolerance, and increased the abundance of beneficial bifidobacteria through 4 months of age.

Clinical trial registration: https://clinicaltrials.gov/study/NCT04962594.

Keywords: bifidobacteria; gastrointestinal tolerance; growth; gut health; microbiota.


Conflict of interest statement

Authors LL, CF, ISZ, BZ, NPH, and NS are employed by Société des Produits Nestlé S.A. Author JM Moll is employed by Cmbio, and author PRG was employed by Cmbio at the time of completion of this work. The remaining authors declare that the research was conducted in the absence of any commercial or financial relationships that could be construed as a potential conflict of interest. The author(s) declared that they were an editorial board member of Frontiers, at the time of submission. This had no impact on the peer review process and the final decision.

Figures

Figure 1
Figure 1
Infant disposition flowchart. Breastfed infants were enrolled in the breastfed reference group (BF), while formula-fed infants were randomized to receive either experimental formula (SYN) or control formula (CTRL). FAS, full analysis set; PP, per-protocol population; SAS, safety analysis set.
Figure 2
Figure 2
Weight gain velocity through 4 months for the full analysis and per-protocol sets. CI, confidence interval; CTRL, control formula group; FAS, full analysis set; PP, per-protocol population; SYN, experimental formula group. Analyses were performed using ANCOVA, correcting for baseline weight, sex, mode of delivery, and study center. The mean difference was calculated as SYN minus CTRL. Non-inferiority of weight gain velocity for infants in the SYN group compared to the CTRL group was accepted if the lower bound of the two-sided 95% CI on the model-based treatment difference was above the non-inferiority margin of -3 g/day (p < 0.001 for both FAS and PP).
Figure 3
Figure 3
Infant anthropometric z-scores through 4 months for the full analysis set. BF, breastfed group; CTRL, control formula-fed group; HC, head circumference; SYN, experimental formula-fed group. Analyses were performed using propensity score-adjusted ANCOVA, correcting for baseline value, sex, mode of delivery, and study center. *SYN and CTRL were significantly different from BF (p < 0.05). #SYN was significantly different from BF (p < 0.05). p-values were adjusted for multiple comparisons using Benjamini-Hochberg correction.
Figure 4
Figure 4
Mean Infant Gastrointestinal Symptom Questionnaire (IGSQ) scores through 4 months for the full analysis set. BF, breastfed group; CTRL, control formula-fed group; SYN, experimental formula-fed group. The IGSQ index score is calculated from the IGSQ questionnaire and ranges from 13 to 65. Scores from 13 to 23 indicate good GI tolerance, scores >23 to 30 suggest some GI distress, and scores >30 to 65 indicate clinically meaningful GI discomfort. Values are presented as mean ± SD and were analyzed using propensity score-adjusted ANCOVA, correcting for baseline value, age, and study center. p-values were adjusted for multiple comparisons using Benjamini-Hochberg correction. There were no significant differences between groups at any time point (all p > 0.05).
Figure 5
Figure 5
Abundance of (A) Bifidobacterium species, (B) infant-type Bifidobacterium species, (C) B. infantis and (D) B. lactis at baseline (≤14 days [d]) and 3 months (3mo) for the full-analysis set. BF, breastfed group; CTRL, control formula-fed group; SYN, experimental formula-fed group. Box and whisker plots are shown with individual subjects plotted as circles. Statistical significance between groups is indicated by p-values from a cross-sectional, bias-corrected mixed-effects model, which corrects for baseline age and study center.
Figure 6
Figure 6
B. infantis strain tracking at baseline (≤14 days [d]) and 3 months (3mo) for the full analysis and per-protocol sets. (A) B. infantis strain categorization based on SNV-level variation shown for each infant (horizontal rows) in the per-protocol and full analysis set at each visit, stratified by intervention group. The white area indicates unavailable samples. Infants in the per-protocol analysis are grouped. (B) Relative abundance of B. infantis stratified by B. infantis strain categorization and visit across all three study groups in the full analysis set. BF, breastfed group; CTRL, control formula-fed group; SYN, experimental formula-fed group.
Figure 7
Figure 7
Abundance of potentially pathogenic species at baseline (≤14 days [d]) and 3 months (3mo) for the full analysis set. BF, breastfed group; CTRL, control formula-fed group; SYN, experimental formula-fed group. The following species were detected: Campylobacter jejuni (C. jejuni), toxigenic Clostridiodes difficile (C. difficile), pathogenic Escherichia coli (E. coli), and Sarcina perfringens (S. perfringens; formerly Clostridium perfringens).
Figure 8
Figure 8
Fecal (A) pH (presented as mean ± SD); values below the lower limit of quantification [LLOQ] were imputed by LLOQ/2, and values above the upper limit of quantification [ULOQ] were imputed by ULOQ; (B) IgA; (C) calprotectin; and (D) alpha-1 antitrypsin (all presented as geometric mean and geometric SD) at baseline (≤14 days [d]) and 3 months (3mo). BF, breastfed group; CTRL, control formula-fed group; SYN, experimental formula-fed group. All outcomes were analyzed using propensity score-adjusted ANCOVA, correcting for baseline value, age, and study center. p-values were adjusted for multiple comparisons using Benjamini-Hochberg correction.

Similar articles

References

    1. Moossavi S, Miliku K, Sepehri S, Khafipour E, Azad MB. The prebiotic and probiotic properties of human milk: implications for infant immune development and pediatric asthma. Front Pediatr. (2018) 6:197. doi: 10.3389/fped.2018.00197, PMID: - DOI - PMC - PubMed
    1. Bode L. Human milk oligosaccharides: every baby needs a sugar mama. Glycobiology. (2012) 22:1147–62. doi: 10.1093/glycob/cws074, PMID: - DOI - PMC - PubMed
    1. Storm HM, Shepard J, Czerkies LM, Kineman B, Cohen SS, Reichert H, et al. 2′-fucosyllactose is well tolerated in a 100% whey, partially hydrolyzed infant formula with Bifidobacterium lactis: a randomized controlled trial. Glob Pediatr Health. (2019) 6:2333794x19833995. doi: 10.1177/2333794X19833995, PMID: - DOI - PMC - PubMed
    1. Marriage BJ, Buck RH, Goehring KC, Oliver JS, Williams JA. Infants fed a lower calorie formula with 2'FL show growth and 2'FL uptake like breast-fed infants. J Pediatr Gastroenterol Nutr. (2015) 61:649–58. doi: 10.1097/MPG.0000000000000889, PMID: - DOI - PMC - PubMed
    1. Puccio G, Alliet P, Cajozzo C, Janssens E, Corsello G, Sprenger N, et al. Effects of infant formula with human Milk oligosaccharides on growth and morbidity: a randomized multicenter trial. J Pediatr Gastroenterol Nutr. (2017) 64:624–31. doi: 10.1097/MPG.0000000000001520, PMID: - DOI - PMC - PubMed

Associated data