

Integrating multimodal ultrasound imaging for improved radiomics sentinel lymph node assessment in breast cancer
- PMID: 40771387
- PMCID: PMC12322757
- DOI: 10.21037/gs-2025-223
Integrating multimodal ultrasound imaging for improved radiomics sentinel lymph node assessment in breast cancer
Abstract
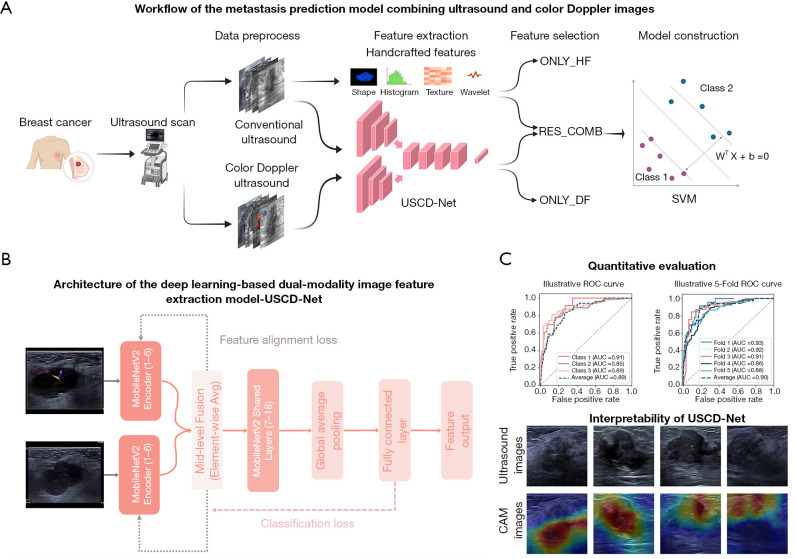
Background: Accurate preoperative assessment of sentinel lymph node (SLN) is critical for treatment planning in breast cancer (BC). While SLN biopsy (SLNB) remains the gold standard, it is invasive and may be unnecessary for all patients, particularly those with clinically node-negative disease. Combining conventional B-mode ultrasound (BMUS) and color Doppler ultrasound (CDUS) with new techniques like radiomics and deep learning may improve SLN prediction, but this approach has not been widely studied yet. This retrospective study aims to develop and validate a deep learning radiomics model that combining BMUS and CDUS imaging to noninvasively predict SLN metastasis in patients with BC.
Methods: A total of 450 women with invasive BC who were treated at 2 hospitals between October 2021 and March 2025 were retrospectively analyzed. Patients were divided into training (n=276), external validation (n=105), and testing (n=69) sets. Handcrafted features were extracted from the breast lesion areas and its surrounding areas in BMUS images. Deep learning-based features were derived by applying a fine-tuned dual-stream MobileNetV2-based model, ultrasound and color doppler network, to both BMUS and CDUS images. The extracted deep features were then subjected to dimensionality reduction using principal component analysis. Following this, both handcrafted and deep learning features underwent further feature selection and dimensionality reduction process via application of inter- and intraclass correlation coefficient filtering, Pearson correlation analysis, and least absolute shrinkage and selection operator (LASSO) regression. Three models were constructed: only handcrafted features (ONLY_HF), only deep-learning features (ONLY_DF), and combined features (COMB). Each model's performance was evaluated using the area under the curve (AUC).
Results: The COMB model integrated ten features (six handcrafted and four deep learning) following LASSO regression. In predicting SLN metastasis between N0 and N≥1, COMB achieved a higher AUC (0.888, 0.861, and 0.837 in the training, validation, and testing sets, respectively) compared to ONLY_HF (0.792, 0.765, and 0.739) and ONLY_DF (0.781, 0.748, and 0.717). The negative prediction value of COMB was the highest (88.89%, 76.60%, and 71.23%), followed by ONLY_HF (83.33%, 72.00%, and 43.10%), and ONLY_DF (78.38%, 67.57%, and 52.69%).
Conclusions: By integrating BMUS and CDUS imaging with advanced deep learning techniques, the COMB model achieved a high negative predictive value, which could guide axillary treatment decisions and reducing unnecessary invasive procedures. These findings highlight the potential of multimodal imaging and machine learning strategies to serve as noninvasive, supplementary tools for personalized BC management.
Keywords: Sentinel lymph node metastasis (SLN metastasis); breast cancer (BC); deep learning; ultrasound.
Copyright © 2025 AME Publishing Company. All rights reserved.
Conflict of interest statement
Conflicts of Interest: All authors have completed the ICMJE uniform disclosure form (available at https://gs.amegroups.com/article/view/10.21037/gs-2025-223/coif). The authors have no conflicts of interest to declare.
Figures


Similar articles
-
Development and validation of a prediction model for lymph node metastasis in thyroid cancer: integrating deep learning and radiomics features from intra- and peri-tumoral regions.Gland Surg. 2025 Jul 31;14(7):1272-1282. doi: 10.21037/gs-2025-50. Epub 2025 Jul 28. Gland Surg. 2025. PMID: 40771372 Free PMC article.
-
Clinical benefits of deep learning-assisted ultrasound in predicting lymph node metastasis in pancreatic cancer patients.Future Oncol. 2025 Aug;21(18):2335-2345. doi: 10.1080/14796694.2025.2520149. Epub 2025 Jun 23. Future Oncol. 2025. PMID: 40548666
-
A Multimodal MRI-Based Model for Colorectal Liver Metastasis Prediction: Integrating Radiomics, Deep Learning, and Clinical Features with SHAP Interpretation.Curr Oncol. 2025 Jul 30;32(8):431. doi: 10.3390/curroncol32080431. Curr Oncol. 2025. PMID: 40862800 Free PMC article.
-
Cost-effectiveness of using prognostic information to select women with breast cancer for adjuvant systemic therapy.Health Technol Assess. 2006 Sep;10(34):iii-iv, ix-xi, 1-204. doi: 10.3310/hta10340. Health Technol Assess. 2006. PMID: 16959170
-
Positron emission tomography (PET) and magnetic resonance imaging (MRI) for the assessment of axillary lymph node metastases in early breast cancer: systematic review and economic evaluation.Health Technol Assess. 2011 Jan;15(4):iii-iv, 1-134. doi: 10.3310/hta15040. Health Technol Assess. 2011. PMID: 21276372 Free PMC article.
References
-
- Gentilini OD, Botteri E, Sangalli C, et al. Sentinel Lymph Node Biopsy vs No Axillary Surgery in Patients With Small Breast Cancer and Negative Results on Ultrasonography of Axillary Lymph Nodes: The SOUND Randomized Clinical Trial. JAMA Oncol 2023;9:1557-64. 10.1001/jamaoncol.2023.3759 - DOI - PMC - PubMed
LinkOut - more resources
Full Text Sources
Research Materials
Miscellaneous