

Worldwide and time trends in sodium and potassium intakes in children and adolescents: a systematic review and meta-analysis
- PMID: 40771492
- PMCID: PMC12322561
- DOI: 10.1136/bmjnph-2024-001016
Worldwide and time trends in sodium and potassium intakes in children and adolescents: a systematic review and meta-analysis
Abstract
Background: High sodium (Na) and low potassium (K) intakes in childhood have health effects across the life course. The objective was to estimate global, regional and national Na and K intakes in children since 1990.
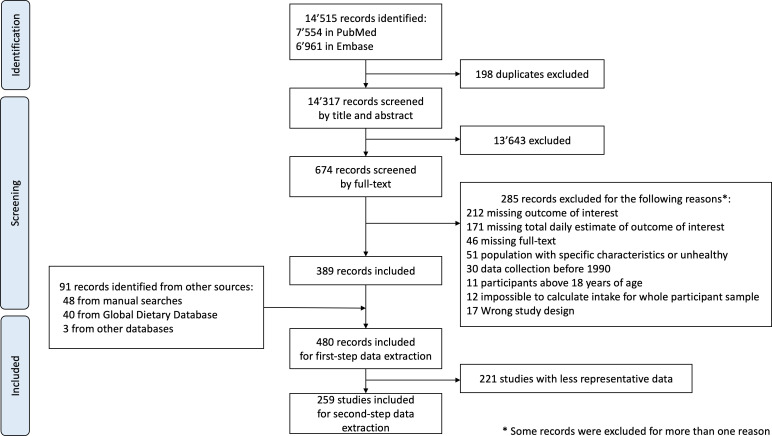
Methods: A systematic search of cross-sectional and longitudinal studies measuring Na or K intake in children aged 0-18 years of age since 1990 was conducted. Random effects multilevel meta-analyses and meta-regressions were performed to investigate age and time trends, country and regional differences, and to derive a worldwide average intake.
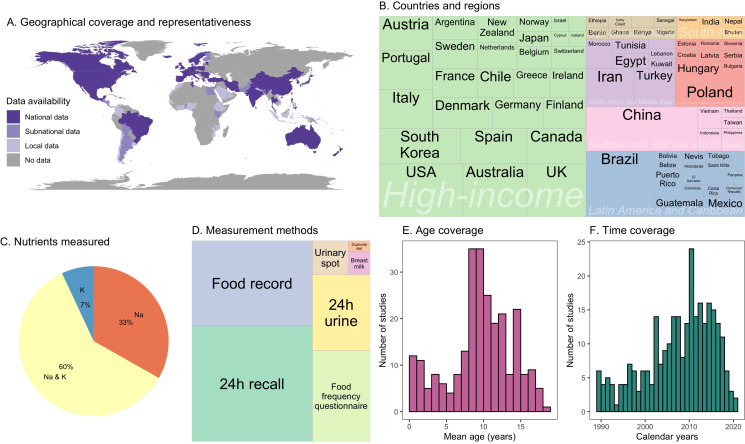
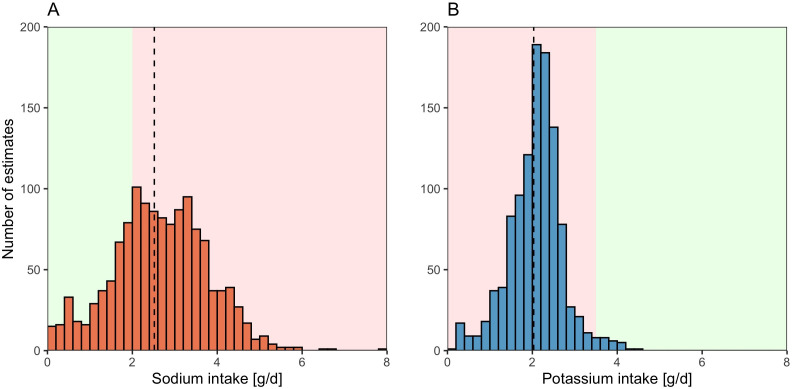
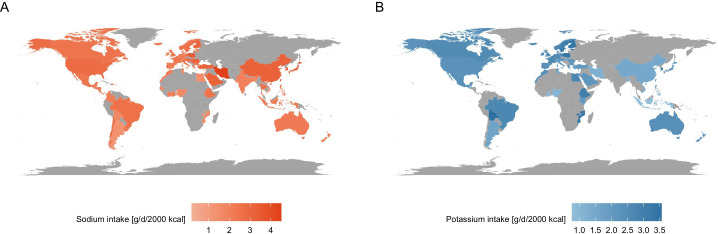
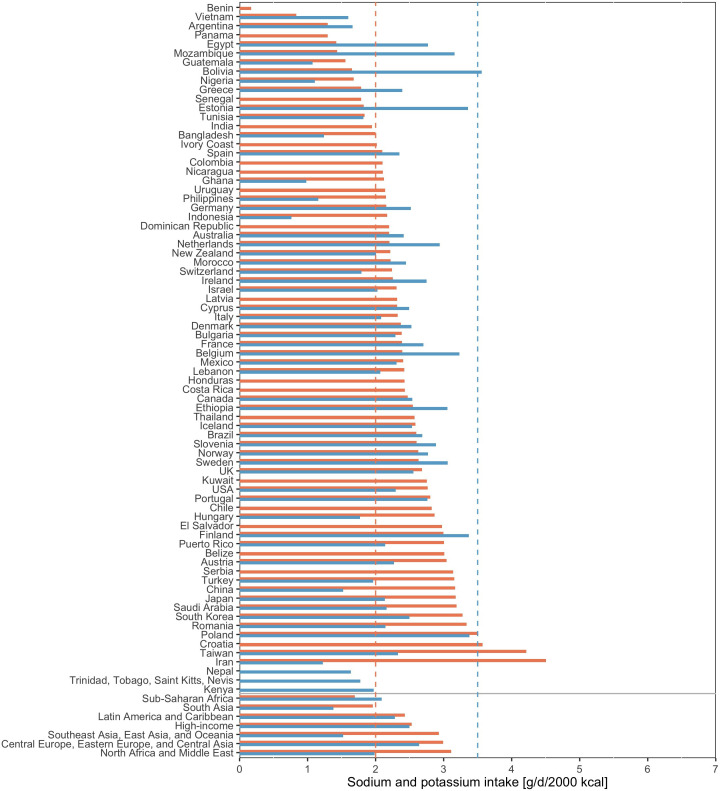
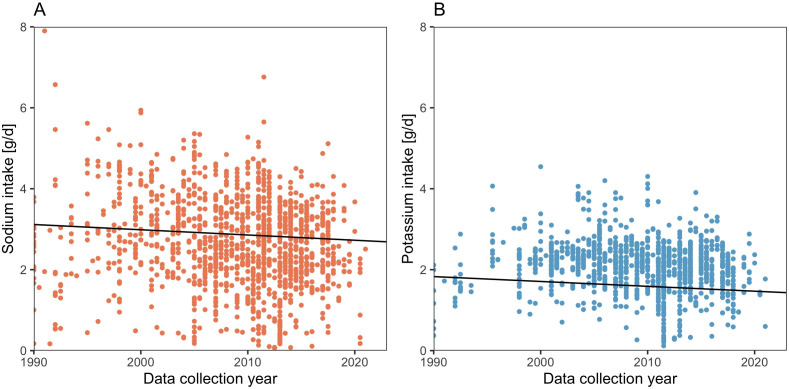
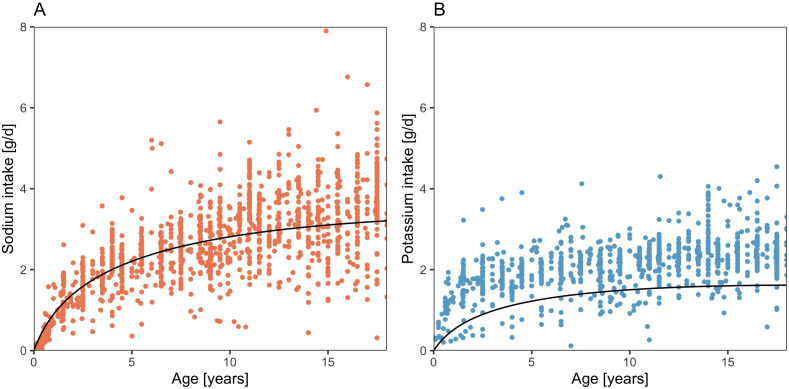
Results: A total of 259 studies with 520 630 children aged 0-18 years of age (mean 9.7 years) conducted between 1990 and 2021 in 79 different countries (mostly high-income countries) were included. The pooled Na and K intakes were 2.5 g/d (95% CI 2.4, 2.6) and 2.0 g/d (95% CI 1.9, 2.1), respectively. An estimated 73% of children had high Na intake (≥2 g/d/2000 kcal) and 89% had low K intake (<3.5 g/d/2000 kcal). Na intake was the lowest in Sub-Saharan Africa and the highest in North Africa and the Middle East. K intake was the lowest in South Asia and the highest in Central-Eastern Europe and Central Asia. Na and K intakes tended to decrease slightly linearly between 1990 and 2021 and increased logarithmically with age.
Conclusion: Globally, children's Na intake was too high, while K intake was too low. Data were lacking in many countries. Interventions are needed to reduce Na and increase K from childhood, and monitoring should be improved.
Keywords: Blood pressure lowering; Nutrition assessment.
Copyright © Author(s) (or their employer(s)) 2025. Re-use permitted under CC BY-NC. No commercial re-use. See rights and permissions. Published by BMJ Group.
Conflict of interest statement
None declared.
Figures
Similar articles
-
Worldwide trends in diabetes prevalence and treatment from 1990 to 2022: a pooled analysis of 1108 population-representative studies with 141 million participants.Lancet. 2024 Nov 23;404(10467):2077-2093. doi: 10.1016/S0140-6736(24)02317-1. Epub 2024 Nov 13. Lancet. 2024. PMID: 39549716 Free PMC article.
-
Effectiveness and safety of vitamin D in relation to bone health.Evid Rep Technol Assess (Full Rep). 2007 Aug;(158):1-235. Evid Rep Technol Assess (Full Rep). 2007. PMID: 18088161 Free PMC article.
-
Replacing salt with low-sodium salt substitutes (LSSS) for cardiovascular health in adults, children and pregnant women.Cochrane Database Syst Rev. 2022 Aug 10;8(8):CD015207. doi: 10.1002/14651858.CD015207. Cochrane Database Syst Rev. 2022. PMID: 35944931 Free PMC article.
-
Effects of a gluten-reduced or gluten-free diet for the primary prevention of cardiovascular disease.Cochrane Database Syst Rev. 2022 Feb 24;2(2):CD013556. doi: 10.1002/14651858.CD013556.pub2. Cochrane Database Syst Rev. 2022. PMID: 35199850 Free PMC article.
-
Interventions for myopia control in children: a living systematic review and network meta-analysis.Cochrane Database Syst Rev. 2025 Feb 13;2(2):CD014758. doi: 10.1002/14651858.CD014758.pub3. Cochrane Database Syst Rev. 2025. PMID: 39945354
References
LinkOut - more resources
Full Text Sources