

Changes in household purchasing of soft drinks following the UK soft drinks industry levy by household income and composition: controlled interrupted time series analysis, March 2014 to November 2019
- PMID: 40771512
- PMCID: PMC12322548
- DOI: 10.1136/bmjnph-2024-000981
Changes in household purchasing of soft drinks following the UK soft drinks industry levy by household income and composition: controlled interrupted time series analysis, March 2014 to November 2019
Abstract
Background: The WHO recommends taxes on sugar sweetened beverages (SSBs) to improve population health. We examined changes in volume of and amount of sugar in purchases of soft drinks according to household income and composition, 19 months following the implementation of the UK soft drinks industry levy.
Methods: Data were from the Kantar Fast Moving Consumer Goods panel, a market research panel which collects data on weekly household purchases (mean weekly number of households=21 908), March 2014-November 2019. Interrupted time series analysis of volume and sugar purchases was used to estimate absolute and relative differences in the volume and amount of sugar in soft drinks, confectionery and alcohol purchased weekly by household income (<£20 000, £20-50 000 or >£50 000) and composition (presence of children (<16 years) in the household (yes or no)), 19 months after soft drinks industry levy (SDIL) implementation, compared with the counterfactual scenario based on pre-announcement trends and using a control group (toiletries).
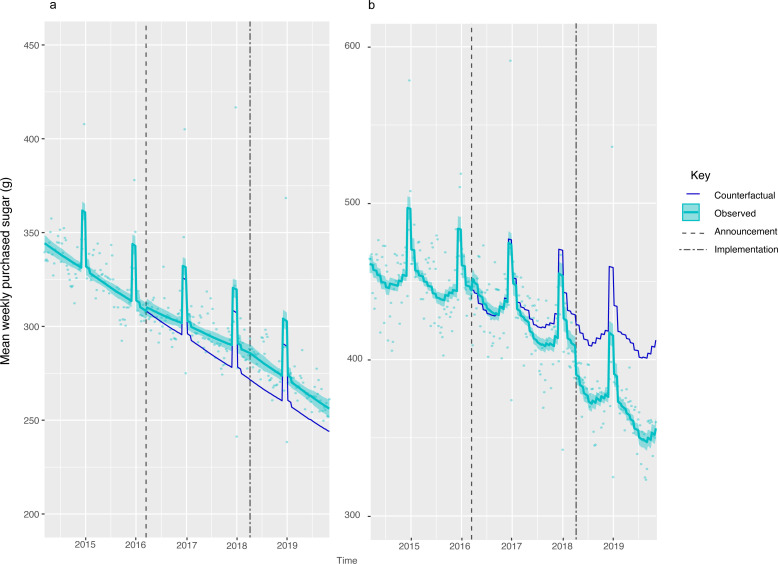
Results: By November 2019, purchased weekly sugar in soft drinks fell by 7.46 g (95% CI: 12.05, 2.87) per household but volumes of drinks purchased remained unchanged, compared with the counterfactual. In low-income households, weekly sugar purchased in soft drinks decreased by 14.0% (95% CI: 12.1, 15.9) compared with the counterfactual but in high-income households increased by 3.4% (1.07, 5.75). Among households with children, sugar purchased decreased by 13.7% (12.1, 15.3) but increased in households without children by 5.0% (3.0, 7.0). Low-income households and those with children also reduced their weekly volume of soft drinks purchased by 5.7% (3.7, 7.7) and 8.5% (6.8, 10.2) respectively. There was no evidence of substitution to confectionary or alcohol.
Conclusion: In the second year following implementation of the SDIL, effects on sugar purchased were greatest in those with the highest pre-SDIL purchasing levels (low-income households and those with children). The SDIL may contribute to reducing dietary inequalities.
Trial registration number: ISRCTN18042742. Registered: August 2017.
Keywords: Dietary patterns; Nutrition assessment; Nutritional treatment.
Copyright © Author(s) (or their employer(s)) 2025. Re-use permitted under CC BY. Published by BMJ Group.
Conflict of interest statement
None declared.
Figures


Similar articles
-
Anticipatory changes in British household purchases of soft drinks associated with the announcement of the Soft Drinks Industry Levy: A controlled interrupted time series analysis.PLoS Med. 2020 Nov 12;17(11):e1003269. doi: 10.1371/journal.pmed.1003269. eCollection 2020 Nov. PLoS Med. 2020. PMID: 33180869 Free PMC article.
-
Changes in soft drinks purchased by British households associated with the UK soft drinks industry levy: controlled interrupted time series analysis.BMJ. 2021 Mar 10;372:n254. doi: 10.1136/bmj.n254. BMJ. 2021. Retraction in: BMJ. 2023 Dec 5;383:p2705. doi: 10.1136/bmj.p2705. PMID: 33692200 Free PMC article. Retracted.
-
Chile's 2014 sugar-sweetened beverage tax and changes in prices and purchases of sugar-sweetened beverages: An observational study in an urban environment.PLoS Med. 2018 Jul 3;15(7):e1002597. doi: 10.1371/journal.pmed.1002597. eCollection 2018 Jul. PLoS Med. 2018. PMID: 29969444 Free PMC article.
-
Calorie (energy) labelling for changing selection and consumption of food or alcohol.Cochrane Database Syst Rev. 2025 Jan 17;1(1):CD014845. doi: 10.1002/14651858.CD014845.pub2. Cochrane Database Syst Rev. 2025. PMID: 39820897
-
Nutritional labelling for healthier food or non-alcoholic drink purchasing and consumption.Cochrane Database Syst Rev. 2018 Feb 27;2(2):CD009315. doi: 10.1002/14651858.CD009315.pub2. Cochrane Database Syst Rev. 2018. PMID: 29482264 Free PMC article.
References
-
- World Health Organization Together let’s beat NCDs. Taxes on sugary drinks: why do it? 2017
LinkOut - more resources
Full Text Sources