

Overlap between ultra-processed food and food that is high in fat, salt or sugar: analysis of 11 annual waves of the UK National Diet and Nutrition Survey 2008/2009-2018/2019
- PMID: 40771514
- PMCID: PMC12322569
- DOI: 10.1136/bmjnph-2024-001035
Overlap between ultra-processed food and food that is high in fat, salt or sugar: analysis of 11 annual waves of the UK National Diet and Nutrition Survey 2008/2009-2018/2019
Abstract
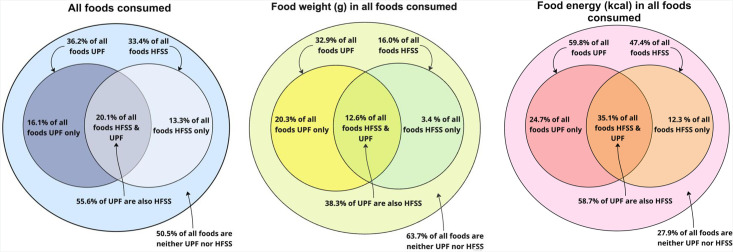
While many countries use guidance and policies based on nutrients and food groups to support citizens to consume healthy diets, fewer have explicitly adopted the concept of ultra-processed foods (UPF). UPF consumption is associated with many adverse health outcomes in cohort studies. In the UK, a nutrient profiling model (NPM) is used to identify foods high in fat, salt or sugar (HFSS) and several policies target these. It is not known how well the NPM also captures UPF. We aimed to quantify the proportion of food and drink items consumed in the UK that are HFSS, UPF, both or neither and describe the food groups making the largest contributions to each category. We analysed data from the National Diet and Nutrition Survey, between 2008/2009 and 2018/2019, using descriptive statistics. We used three metrics of food consumption: all foods, percentage of energy in all foods (reflecting that different foods are consumed in different portion sizes and are of different energy densities) and percentage of food weight in all foods (reflecting that some UPFs have few calories but are consumed in large volumes). We found that 33.4% of foods, 47.4% of energy and 16.0% of food weight were HFSS; 36.2%, 59.8% and 32.9%, respectively, were UPFs; 20.1%, 35.1% and 12.6% were both and 50.5%, 27.9% and 63.7% were neither. In total, 55.6% of UPF foods, 58.7% of energy from UPFs and 38.3% of food weight from UPF consumed were also HFSS. The most common food groups contributing to foods that were UPF but not HFSS were low-calorie soft drinks and white bread. The UK NPM captures at best just over half of UPFs consumed in the UK. Expanding the NPM to include ingredients common in UPFs (eg, non-nutritive sweeteners, emulsifiers) would capture a larger percentage of UPFs and could incentivise 'deformulation' of UPF products.
Keywords: Malnutrition; Nutrient deficiencies; Nutrition assessment.
Copyright © Author(s) (or their employer(s)) 2025. Re-use permitted under CC BY. Published by BMJ Group.
Conflict of interest statement
VK has received funding from the ESRC, Gambling Commission (including from regulatory settlements) and Gambling Research Exchange Ontario.
Figures
Similar articles
-
A policy approach to identifying food and beverage products that are ultra-processed and high in added salt, sugar and saturated fat in the United States: a cross-sectional analysis of packaged foods.Lancet Reg Health Am. 2024 Mar 8;32:100713. doi: 10.1016/j.lana.2024.100713. eCollection 2024 Apr. Lancet Reg Health Am. 2024. PMID: 38495314 Free PMC article.
-
Food in the news: effects of exposure to information about ultra-processed vs. high in nutrients of concern foods on consumer perceptions and intake.Appetite. 2025 Jul 3;214:108217. doi: 10.1016/j.appet.2025.108217. Online ahead of print. Appetite. 2025. PMID: 40617256
-
Definitions of ultra-processed foods beyond NOVA: a systematic review and evaluation.Food Nutr Res. 2025 Jun 16;69. doi: 10.29219/fnr.v69.12217. eCollection 2025. Food Nutr Res. 2025. PMID: 40655201 Free PMC article. Review.
-
Nutritional labelling for healthier food or non-alcoholic drink purchasing and consumption.Cochrane Database Syst Rev. 2018 Feb 27;2(2):CD009315. doi: 10.1002/14651858.CD009315.pub2. Cochrane Database Syst Rev. 2018. PMID: 29482264 Free PMC article.
-
Portion, package or tableware size for changing selection and consumption of food, alcohol and tobacco.Cochrane Database Syst Rev. 2015 Sep 14;(9):CD011045. doi: 10.1002/14651858.CD011045.pub2. Cochrane Database Syst Rev. 2015. PMID: 26368271 Free PMC article.
References
-
- Rayner M, Scarborough P, Lobstein T. London: OfCom; 2009. The UK ofcom nutrient profiling model: defining ‘healthy’and ‘unhealthy’foods and drinks for tv advertising to children.
-
- Davies S. Time to solve childhood obesity; 2019. Department of health social care.
LinkOut - more resources
Full Text Sources