. 2025 Jul 23:16:1600146.
doi: 10.3389/fmicb.2025.1600146. eCollection 2025.

Genomic analysis of the 2017 Aotearoa New Zealand outbreak of Mycoplasma bovis and its position within the global population structure

Affiliations

Genomic analysis of the 2017 Aotearoa New Zealand outbreak of Mycoplasma bovis and its position within the global population structure

Barbara M Binney et al. Front Microbiol. .

Abstract

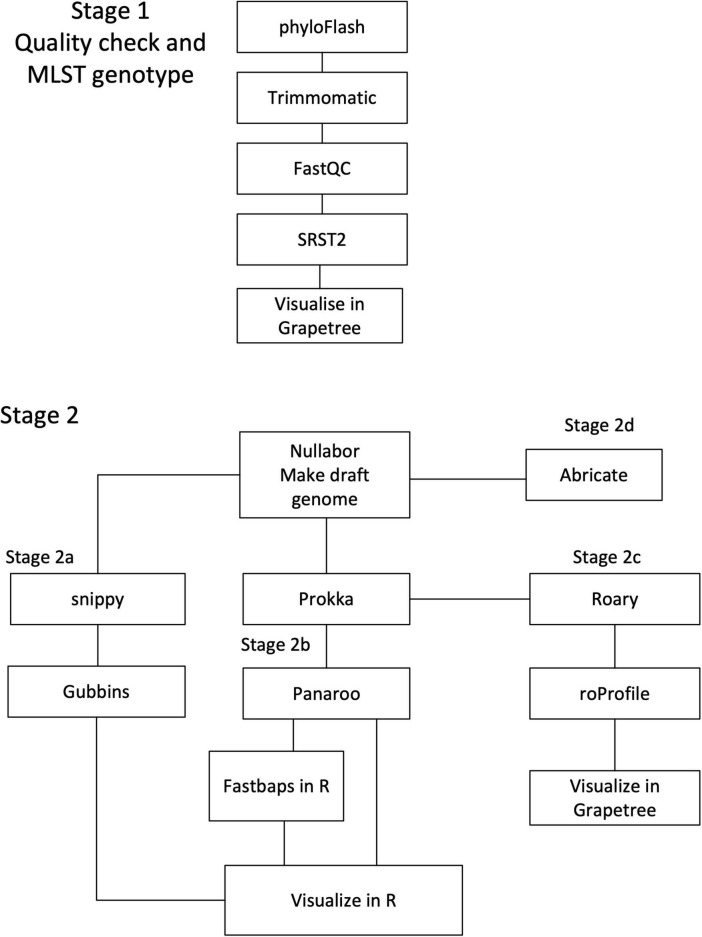
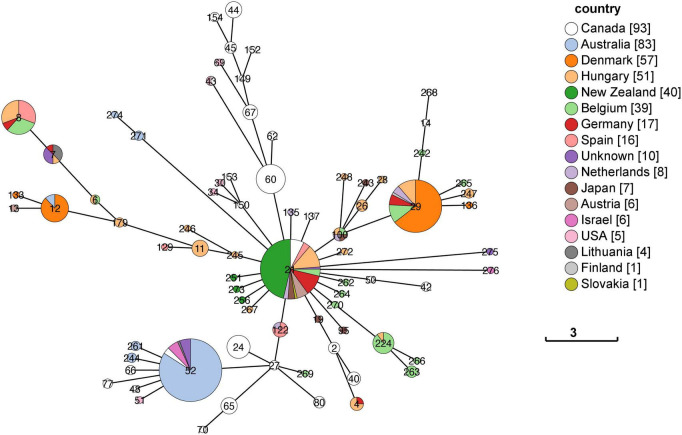
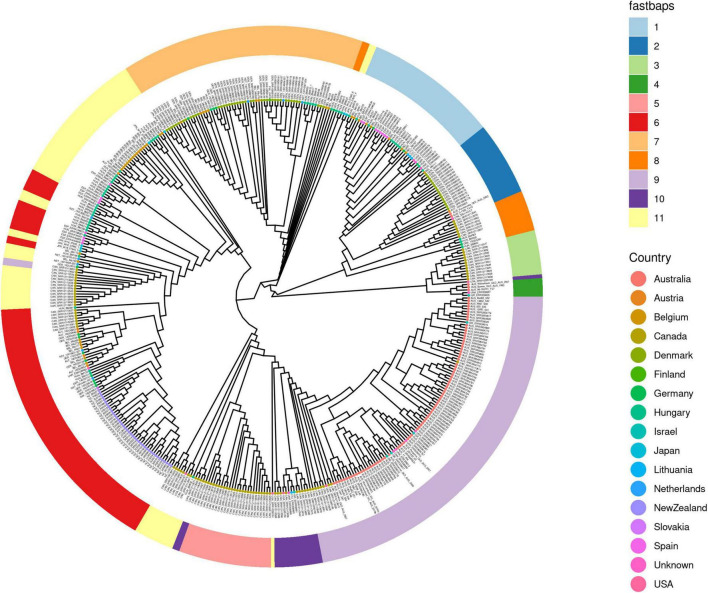
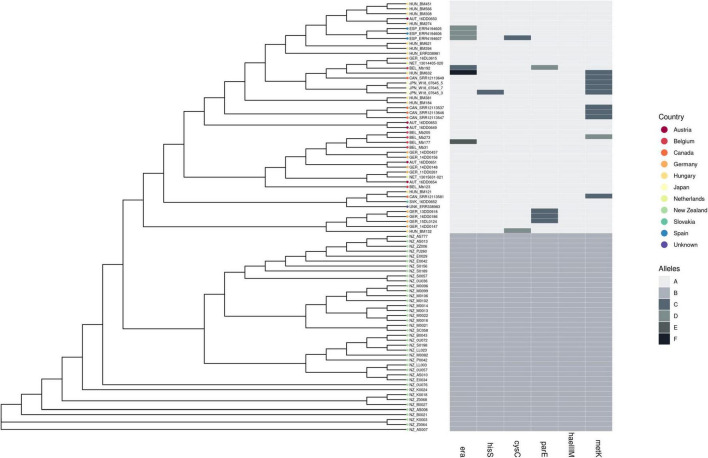
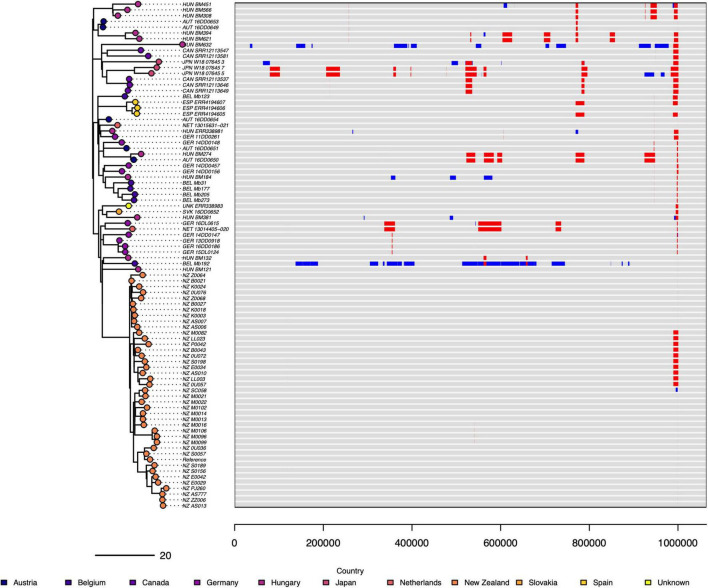
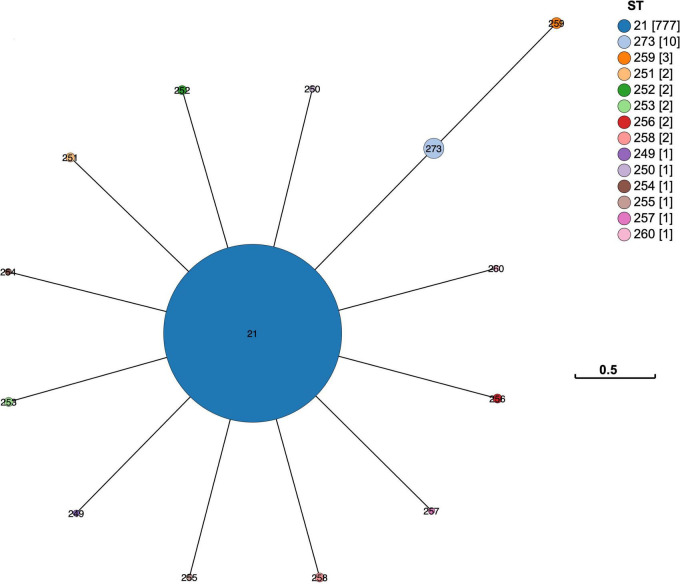
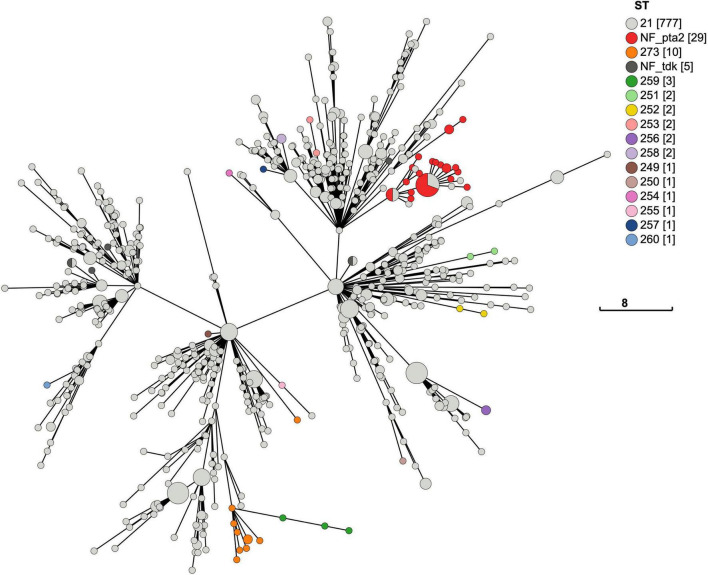
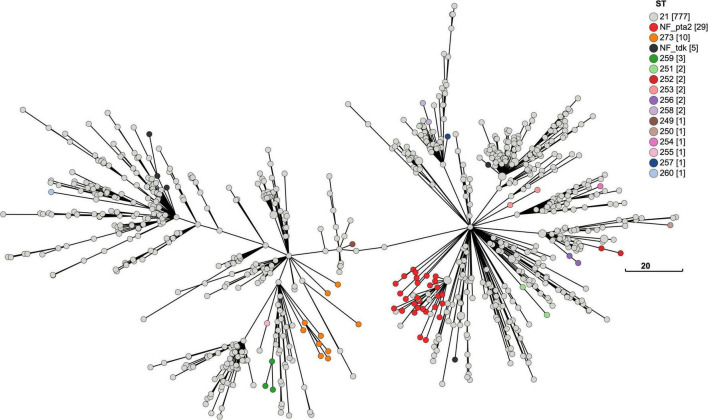
In 2017 an outbreak of Mycoplasma bovis (M. bovis), an infectious agent of cattle, was identified in Aotearoa New Zealand. This study characterizes the genomic population structure of the outbreak in New Zealand and compares it with the known global population structure using multilocus sequence typing (MLST) and genomic analysis. The New Zealand outbreak strain was MLST genotyped as ST21. A comprehensive collection of 840 genomes from the New Zealand outbreak showed a pattern of clonal expansion when characterized by MLST, core genome MLST (cgMLST) and whole genome MLST (wgMLST). A lineage of genomes was found with no in silico identifiable pta2 locus, a housekeeping gene used in the MLST scheme. We compared a sample set of 40 New Zealand genomes to 47 genomes from other countries. This group had 79 ST21 genomes and eight genomes that were single nucleotide polymorphism (SNP) variants within the MLST loci of ST21. Two of the 47 international genomes showed signs of extensive unique recombination. Unique alleles in six genes were identified as present only in the New Zealand genomes. These novel variants were in the genes; haeIIIM encoding for cytosine-specific methyltransferase, cysC encoding for cysteinyl tRNA synthetase, era encoding for GTPase Era, metK encoding for S-adenosylmethionine synthase, parE encoding for DNA topoisomerase, and hisS encoding for histidine-tRNA ligase. This finding could be due to a population bottleneck, genetic drift, or positive selection. The same sample set of 40 New Zealand genomes were compared using MLST to 404 genomes from 15 other countries and 11 genomes without a known country. A FastBAPS analysis of 455 genomes showed a global population structure with 11 clusters. Some countries, such as Canada, Denmark and Australia contained both internally closely related genomes and some genomes that were more closely related to genomes found in other countries. Our results support the need for Whole Genome Sequencing (WGS) as well as MLST genotyping in M. bovis outbreaks. They also support the importance of understanding the national and international movement patterns of cattle and their genetic material, as possible routes of transmission, when managing the spread of M. bovis.

Keywords: Mycoplasma bovis; core genome MLST; genomic epidemiology; multilocus sequence typing (MLST); outbreak; whole genome MLST.


Conflict of interest statement

The authors declare that the research was conducted in the absence of any commercial or financial relationships that could be construed as a potential conflict of interest.

Figures

FIGURE 1
FIGURE 1
Workflow of Bioinformatic analysis. The workflows followed in analyzing the three genomic datasets. All samples followed Stage 1 for sequencing quality checks and MLST genotyping. In the second Stage, the 2a workflow is for SNP variance and recombination analysis. The 2b workflows includes core gene alignment analysis with the option of using FastBAPS for population structure. Stage 2c produces the core genome MLST and whole genome MLST. Stage 2d uses Abricate to check the genomes for putative adhesion- and virulence-related genes.
FIGURE 2
FIGURE 2
Minimum spanning tree of the MLST distribution of M. bovis by country. The MST of the 7-gene MLST scheme developed by Register et al. (2020) showed the ST distribution for 444 genomes across 16 countries and 10 from an unknown country. Each of the STs are represented as a node, and each node is colored in proportion to the number present from each country. The legend has a tally in square brackets of the total genomes from each country. Several countries (including Australia, Denmark, and Canada) have STs that are quite different to each other, e.g., Denmark has ST29 and ST12 genomes. The branch length between nodes represents the number of loci that differ between each ST node. The scale bar shows the distance for differences at three of the 7-loci.
FIGURE 3
FIGURE 3
The population structure of 455 M. bovis genomes using FastBAPS clustering. A FastBAPS clustering analysis was made using the international dataset core gene alignments for 455 genomes from 16 countries and 11 from an unknown country of origin (Supplementary Table 1). The tips of the neighbor-joining tree are color-coded according to the country in which the genomes were found. The branch lengths are all equivalent. The FastBAPS clusters are in the outer ring and divide the genomes into 11 clusters. The FastBAPS cluster for each genome is designated by a color in the ring and aligns to the genome at the tip of the rooted neighbor joining tree. Some of the FastBAPS clusters, e.g., 5 and 1 are in a single clade, while some, e.g., 10 and 11 are not. The countries with larger sample sizes tend to have genomes more widely spread around the tree, e.g., Australia and Canada. The neighbor-joining tree is based on a distance matrix derived from SNP differences in the core gene alignment.
FIGURE 4
FIGURE 4
Comparison of 87 of M. bovis genomes (ST21 and one SNP variants) and six genes with allelic variants. A comparison of ST21 (n = 79) and one SNP variants of ST21 (n = 8) from a dataset composed of 40 NZ genomes and 47 other country genomes. The neighbor-joining tree was made from a distance matrix based on SNP differences between the core gene alignments. The branch lengths are equal. Six genes (era, hisS, cysC, parE, haeIIIM, and metK) were identified as showing one or more sequence variants (alleles) present only in the New Zealand genomes and different to the sequences found in the ST21 overseas genomes.
FIGURE 5
FIGURE 5
Estimated recombination events in of 87 M. bovis genomes (ST21 and one SNP variants). The putative recombination events detected by Gubbins in 87 genomes, is visualized by aligning the genomes against a reference genome on the right and comparing them in a phylogenetic tree on the left. The New Zealand reference genome (NZ_B0132) is 1,064,188 bp. The size and position of recombination events are in red and blue. Red indicates the recombination event was found in multiple genomes and blue signals the recombination event was limited to one genome that is present. There is variation in the position and size of estimated recombination events across the group of genomes. Two genomes (HUN_BM632, BEL_Mb192) show large areas of their genome are affected by these putative unique recombination events. The phylogenetic tree on the left is a maximum likelihood tree produced in Gubbins, and it shows the sample of 40 NZ genomes are closely related and have few identified recombination events.
FIGURE 6
FIGURE 6
Minimum-spanning tree of the M. bovis multilocus sequence types found in the New Zealand ST21 Outbreak. The MST based on the 7-gene MLST profiles for 806 New Zealand genomes shows most are ST21 (n = 777) with 29 variants. There are 13 new STs, most of these variants (n = 26) are one SNP changes within the MLST loci. Three genomes shared the same one SNP change in the gltX loci with ST273 (n = 10) and have another one SNP change in the dnaA loci to become ST259. Overall, this pattern is consistent with a clonal expansion of the ST21 outbreak in New Zealand.
FIGURE 7
FIGURE 7
Minimum-spanning tree of the cgMLST for New Zealand M. bovis. A MST of the cgMLST for M. bovis genomes in New Zealand (n = 840). The size of each node represents the number of genomes with the same cgMLST profile made from the 386 shared loci. The 7-loci MLST ST21 dominates (n = 777), and the most common variant (n = 29) lacks a in silico detectable pta2 locus (NF_pta2). Most genomes with this variant cluster together. Genomes lacking a tdk locus (n = 5) are called NF_tdk. Each new variant with a full MLST profile makes a new ST. The new STs appear to be randomly spread across the MST. But when there is more than one of the same sequence variation or new ST, they tend to cluster together suggesting a lineage. The legend shows how the nodes are colored by the 7-gene MLST scheme developed by Register et al. (2020). The legend has a tally of the total number of genomes for each ST, which are shown in square brackets. The total number of allele differences between each node are represented by the branch length. The scale bar shows the length for a branch with eight allelic differences.
FIGURE 8
FIGURE 8
Minimum-spanning tree of the wgMLST for New Zealand M. bovis. A MST of the wgMLST for M. bovis in New Zealand (n = 840). Each node represents a genome with a unique wgMLST profile made from 1340 loci. The wgMLST includes more loci than the cgMLST (1,340 > 386 loci), enabling more variation between the genomes to be shown by including accessory loci that are not present in all the genomes. The occurrence of a new variant sequence within the MLST loci appear to be randomly spread across the MST but when there is more than one of the same new ST variants, they tend to cluster together. The most common variant (n = 29) in the 7-gene MLST scheme lacks an in silico detectable pta2 locus (NF_pta2). Most genomes with this variant cluster together. Genomes lacking a pta2 locus are called NF_pta2 and those lacking a tdk locus are called NF_tdk. The legend shows the nodes are colored by the 7-gene MLST scheme developed by Register et al. (2020). The legend has a tally of the total number of genomes for each ST, which shown in square brackets. The total number of allele differences between each node are represented by the branch length. The scale bar shows the length for a branch with 20 allelic differences.

Similar articles

References

    1. Aebi M., Bodmer M., Frey J., Pilo P. (2012). Herd-specific strains of Mycoplasma bovis in outbreaks of Mycoplasmal mastitis and pneumonia. Vet. Microbiol. 157 363–368. 10.1016/j.vetmic.2012.01.006 - DOI - PubMed
    1. Andrews S. (2010). FastQC: A quality control tool for high throughput sequence data. Cambridge: Babraham Bioinformata.
    1. Becker C. A., Thibault F. M., Arcangioli M. A., Tardy F. (2015). Loss of diversity within Mycoplasma bovis isolates collected in France from bovines with respiratory diseases over the last 35 years. Infect. Genet. Evol. 33 118–126. 10.1016/j.meegid.2015.04.019 - DOI - PubMed
    1. Bell-Rogers P., Parker L., Cai H. Y. (2018). Multi-locus sequence types of Mycoplasma bovis isolated from Ontario, Canada in the past three decades have a temporal distribution. J. Vet. Diagn. Invest. 30 130–135. 10.1177/1040638717731491 - DOI - PMC - PubMed
    1. Binney B. M., Biggs P. J., Carter P. E., Holland B. R., French N. P. (2014). Quantification of historical livestock importation into New Zealand 1860-1979. New Zealand Vet. J. 62 309–314. 10.1080/00480169.2014.914861 - DOI - PubMed

LinkOut - more resources