

Pharmacokinetic and pharmacodynamic integration and resistance analysis of cefquinome against Streptococcus uberis in vitro dynamic model
- PMID: 40771689
- PMCID: PMC12325258
- DOI: 10.3389/fmicb.2025.1533892
Pharmacokinetic and pharmacodynamic integration and resistance analysis of cefquinome against Streptococcus uberis in vitro dynamic model
Abstract
Introduction: Streptococcus uberis (S. uberis) is a major pathogen that causes acute clinical mastitis and its recurrent episodes in dairy cows.
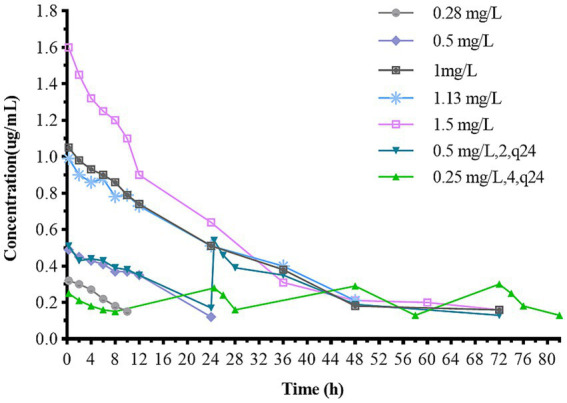
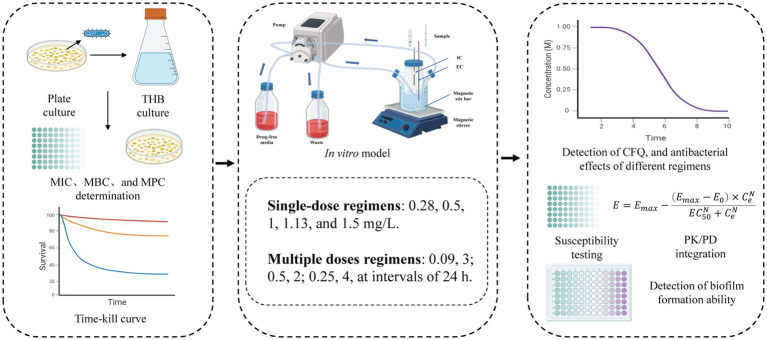
Methods: In this study, a peristaltic pump one-compartment open model was established to investigate the relationship between the pharmacokinetic and pharmacodynamic (PK/PD) indices of cefquinome (CFQ) against S. uberis. Bactericidal effects of single high-dosage versus multiple low-dosage administrations within the same drug dosage and best-fit dosage were assessed.
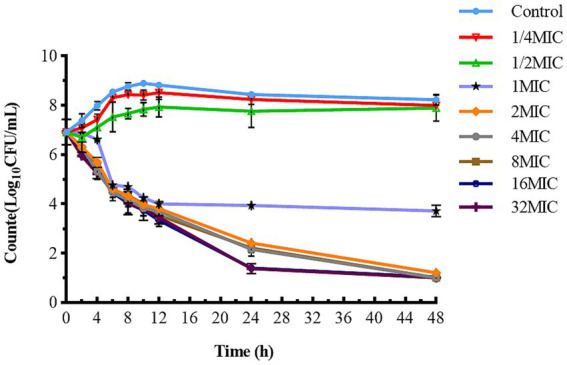
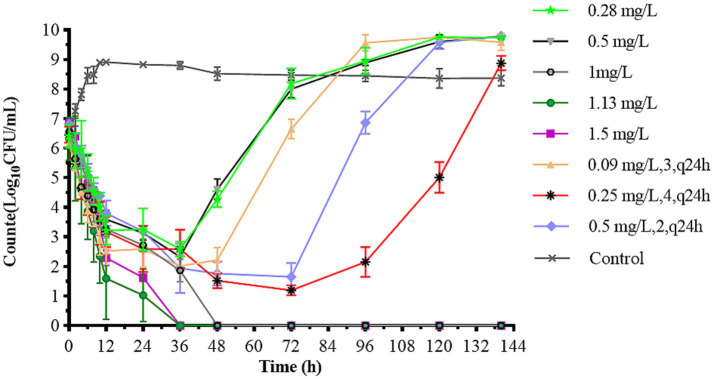
Results: Static time-killing curves showed that the population of S. uberis was not changed when the drug concentration was below 1 × MIC. The maximum antibacterial effect was observed at 24 h, when the concentration exceeded 2 × MIC, showing a reduction by 5.73 log10 (CFU/mL), and the maximum kill rate was 0.22 h-1. S. uberis were cleared at 120 h when the concentration was ≥1 mg/L within single high-dosage groups, except for the 0.28 and 0.5 mg/L groups. The multiple-dose groups decreased below 2.22 log10 (CFU/mL) at 48 h and increased to 9 log10 (CFU/mL) at 120 h, but the group of 0.25 mg/L (4, q24) increased at 144 h. As the frequency of administration increased, the lag time increased following a population decline. The correlation coefficients between AUC0-72h/MBC, %T > MBC, and the antibacterial effects were 0.90 and 0.99%, respectively. %T > MBC was the best-fit PK/PD parameter of CFQ against S. uberis. The MIC of S1-S5 strains ranged from 0.0156-0.0625 μg/mL, and biofilm formation ability increased.
Discussion: In conclusion, CFQ showed good efficacy and time-dependence. This study provides a reference for optimizing CFQ administration in S. uberis.
Keywords: dynamic model; multiple low-dosage; pharmacodynamic; pharmacokinetic; simulation; single high dosage.
Copyright © 2025 Li, Wang, Guo, Zhang, Chen, Wang, Cao and Yu.
Conflict of interest statement
The authors declare that the research was conducted in the absence of any commercial or financial relationships that could be construed as a potential conflict of interest.
Figures


References
-
- Booker B. M., Smith P. F., Forrest A., Bullock J., Kelchlin P., Bhavnani S. M., et al. (2005). Application of an in vitro infection model and simulation for reevaluation of fluoroquinolone breakpoints for Salmonella enterica serotype typhi. Antimicrob. Agents Chemother. 49, 1775–1781. doi: 10.1128/aac.49.5.1775-1781.2005, PMID: - DOI - PMC - PubMed
LinkOut - more resources
Full Text Sources
Research Materials