. 2025 Jul 23:16:1592259.
doi: 10.3389/fimmu.2025.1592259. eCollection 2025.

Harnessing multi-omics and artificial intelligence: revolutionizing prognosis and treatment in hepatocellular carcinoma

Affiliations

Harnessing multi-omics and artificial intelligence: revolutionizing prognosis and treatment in hepatocellular carcinoma

Zhen Wang et al. Front Immunol. .

Abstract

Background: Hepatocellular carcinoma (HCC) is the most prevalent form of liver cancer, characterized by elevated mortality rates and heterogeneity. Despite advancements in treatment, the development of personalized therapeutic strategies for HCC remains a substantial challenge due to the intricate molecular characteristics of the disease. A multi-omics approach has the potential to offer more profound insights into HCC subtypes and enhance patient stratification for personalized treatments.

Methods: A comprehensive data set comprising clinical, transcriptomic, genomic and epigenomic information from HCC patients was retrieved from the TCGA, ICGC, GEO and CPTAC databases. To identify distinct molecular subtypes, a multi-omics data integration approach was employed, utilizing 10 distinct clustering algorithms. Survival analysis, immune infiltration profiling and drug sensitivity predictions were then used to evaluate the prognostic significance and therapeutic responses of these subtypes. Furthermore, machine learning models were employed to develop the artificial intelligence-derived risk score (AIDRS) with the aim of predicting patient outcomes and guiding personalized therapy. In vitro and vivo experiments were conducted to assess the role of CEP55 in tumor progression.

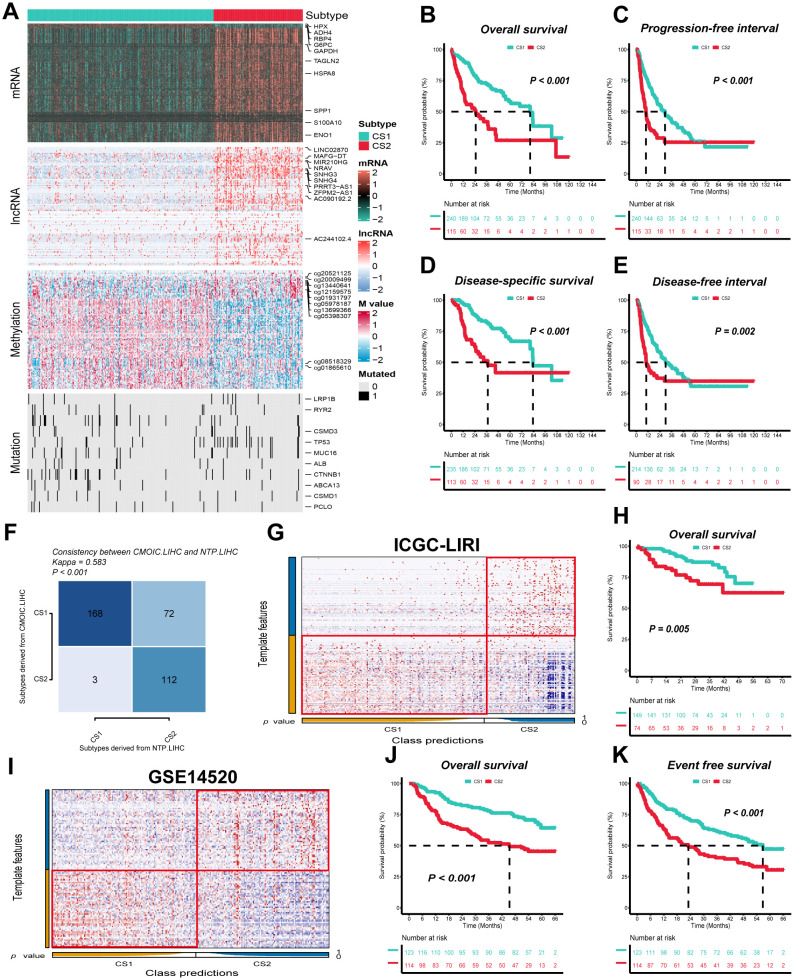
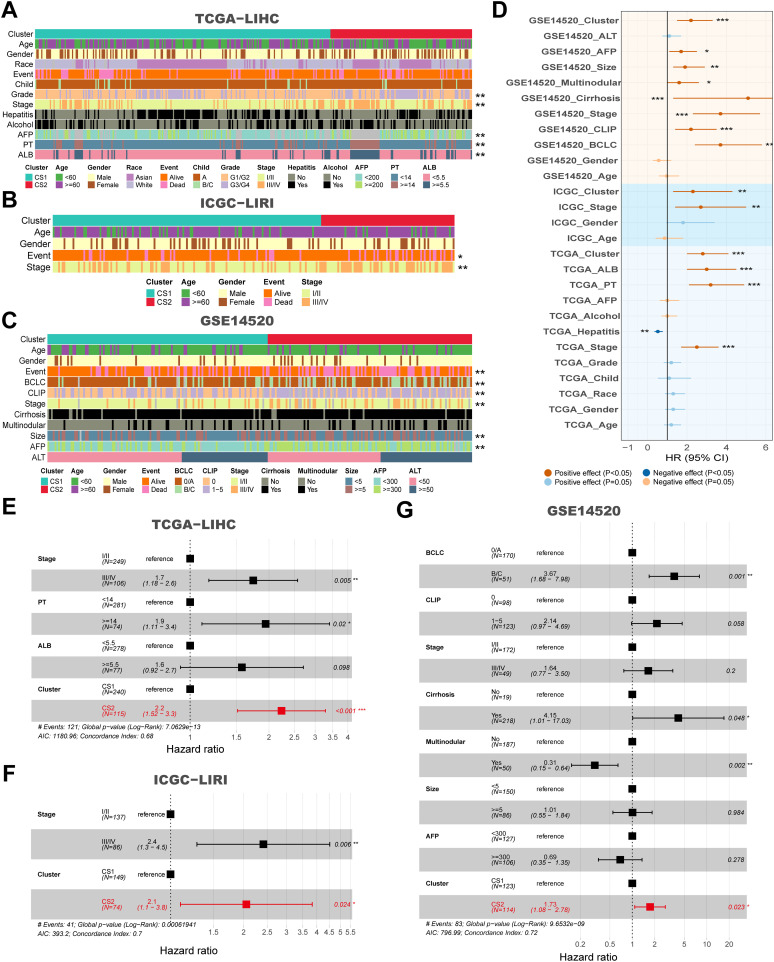
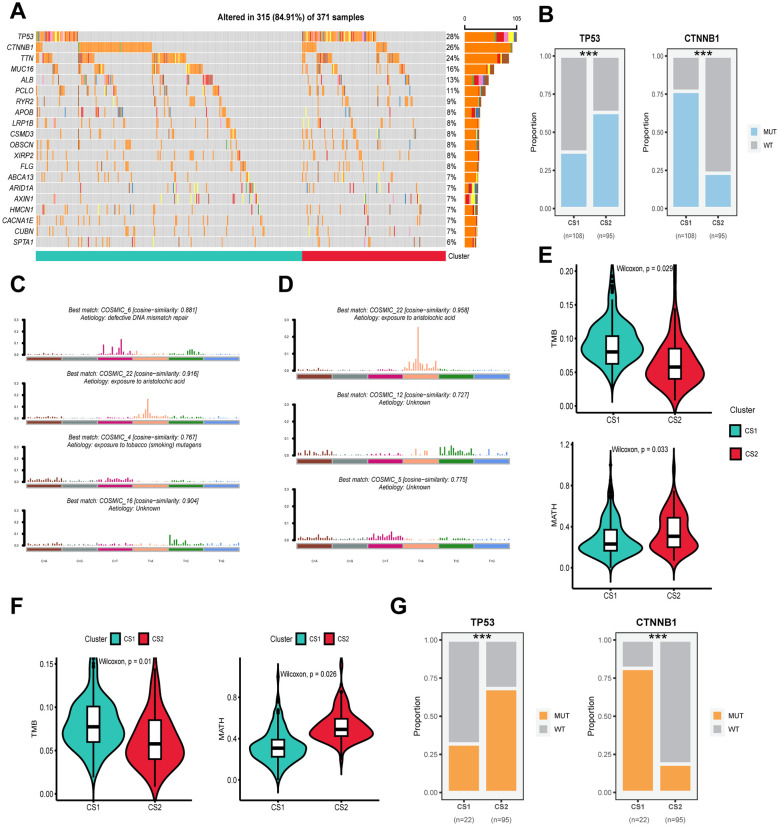
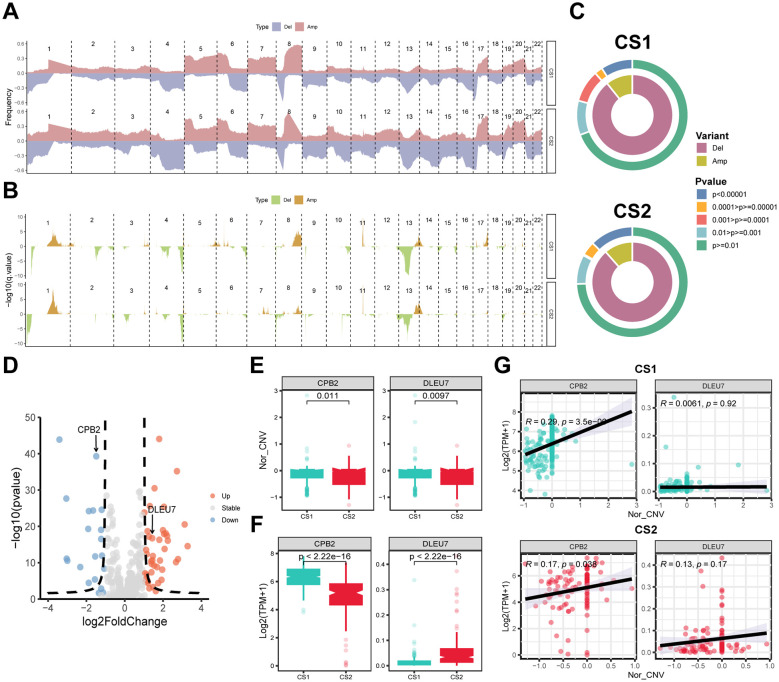
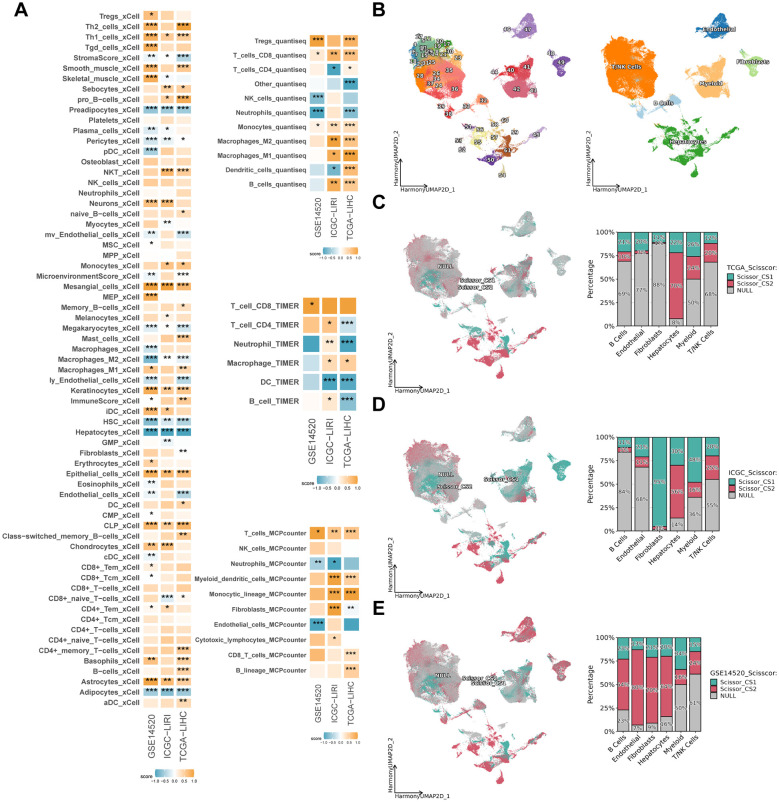
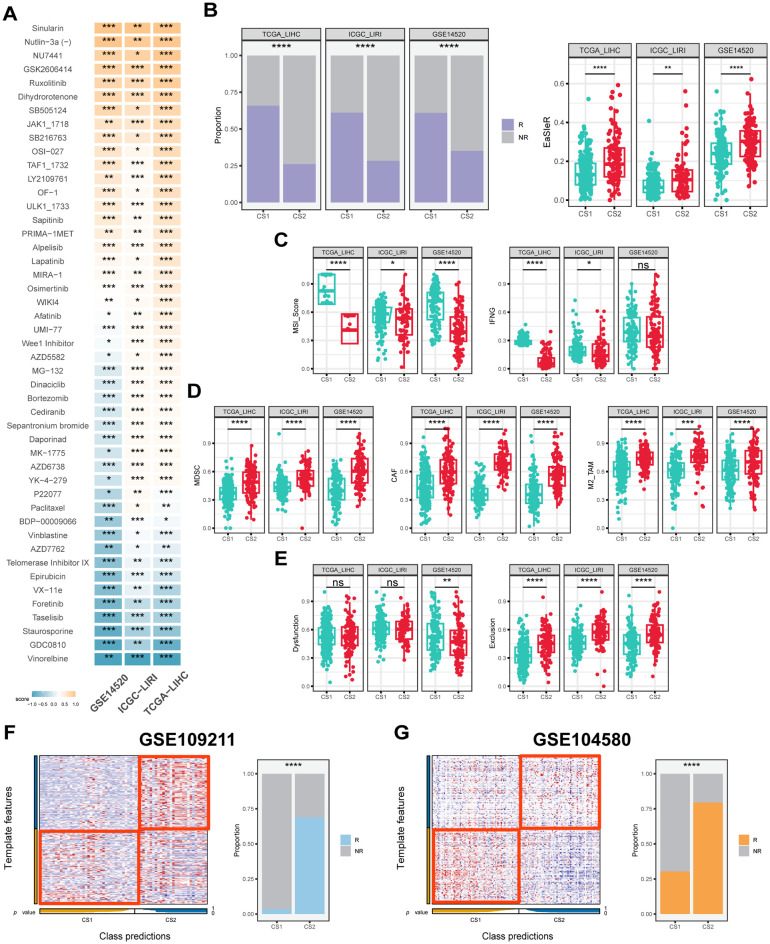
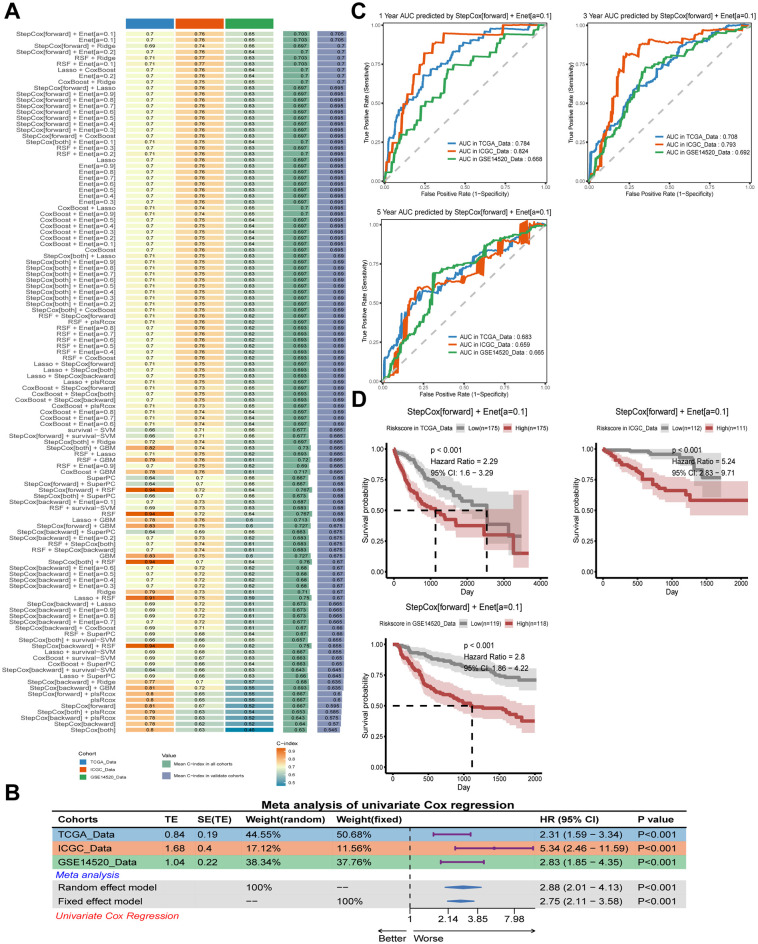
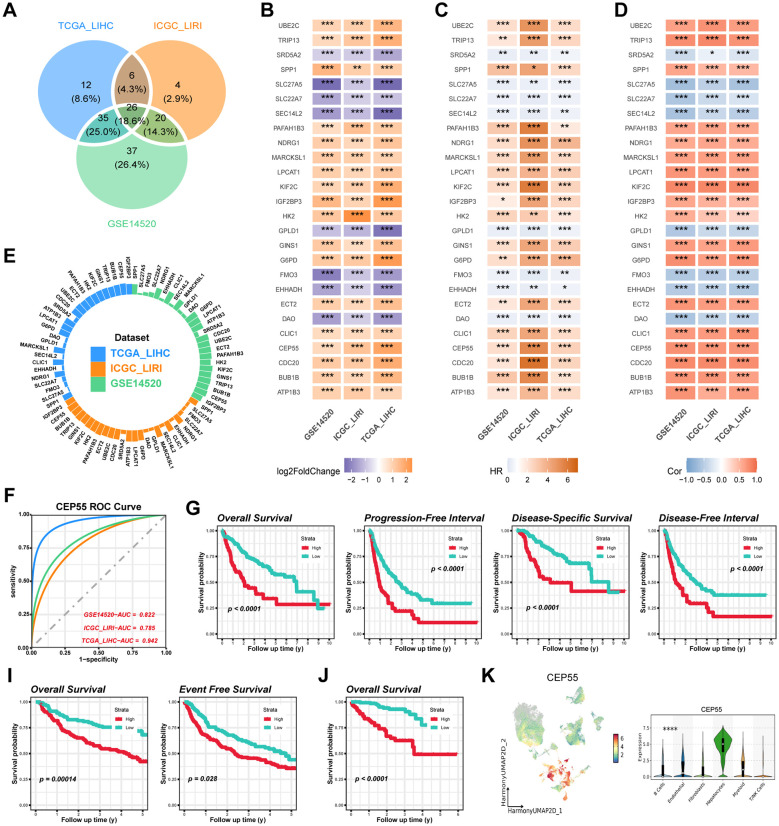
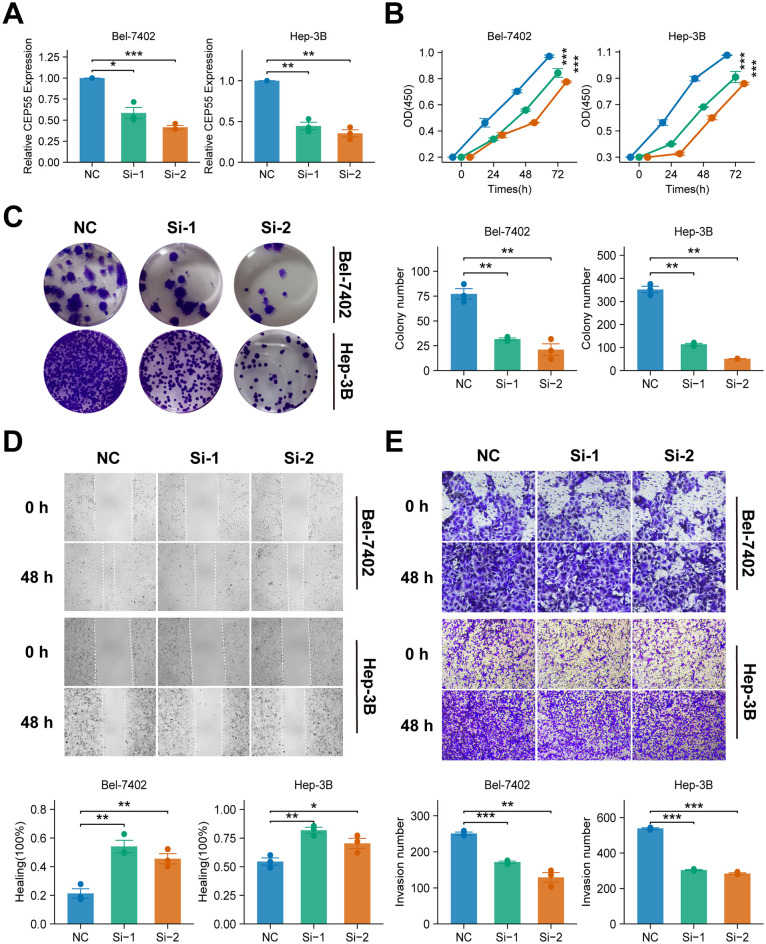
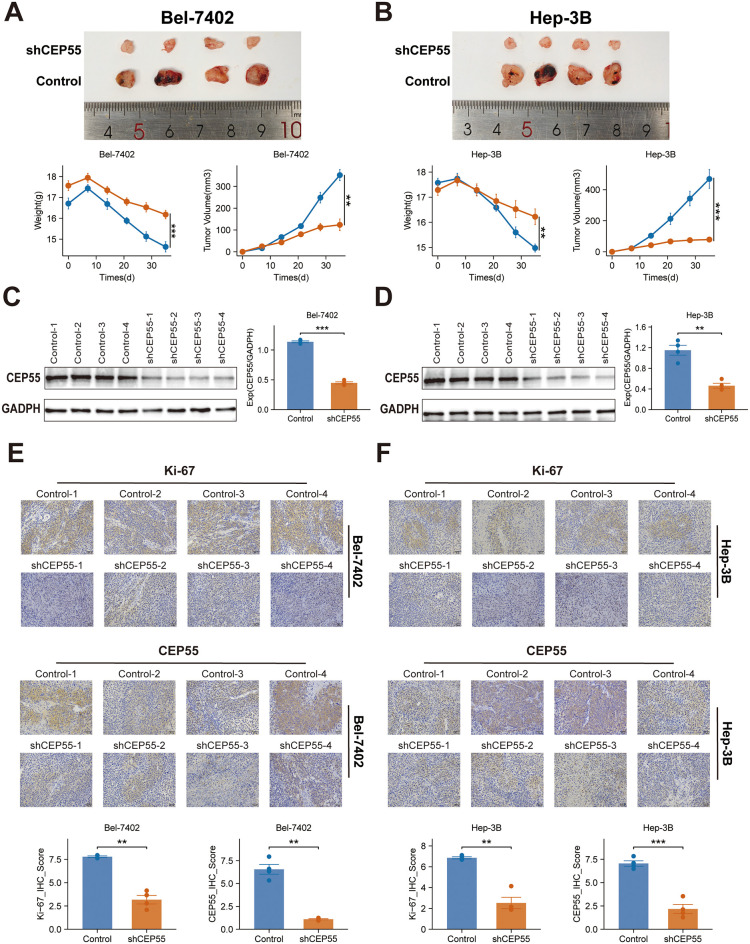
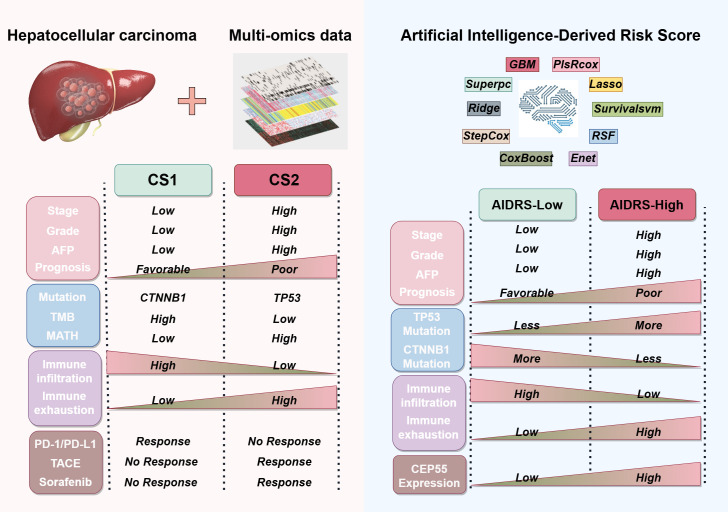
Results: The present study identified two distinct HCC subtypes (CS1 and CS2, respectively), each exhibiting different clinical outcomes and molecular characteristics. CS1 was associated with better overall survival, while CS2 exhibited higher mutation burden and immune suppression. The AIDRS, constructed using a multi-step machine learning approach, effectively predicted patient prognosis across multiple cohorts. High AIDRS score correlated with poor prognosis and a limited response to immunotherapy. Furthermore, the study identified CEP55 as a potential therapeutic target, as it was found to be overexpressed in CS2 and associated with poorer outcomes. In vitro experiments confirmed that CEP55 knockdown reduced HCC cell proliferation, migration, and invasion. Moreover, in xenograft models, CEP55 knockdown significantly reduced tumor growth and proliferation.

Conclusions: The integration of multi-omics data has been demonstrated to provide a comprehensive understanding of HCC subtypes, thus enhancing the prediction of prognosis and guiding personalized treatment strategies. The development of the AIDRS offers a robust tool for risk stratification, while CEP55 has emerged as a promising target for therapeutic intervention in HCC.

Keywords: CEP55; artificial intelligence-derived risk score (AIDRS); hepatocellular carcinoma (HCC); immunotherapy; molecular subtypes; multi-omics; sorafenib; transcatheter arterial chemoembolization (TACE).


Conflict of interest statement

The authors declare that the research was conducted in the absence of any commercial or financial relationships that could be construed as a potential conflict of interest.

Figures

Figure 1
Figure 1
Two distinct molecular subtypes were identified through consensus clustering of multi-omics data, and clinical outcomes and stability were assessed. (A) Multi-omics features corresponding to CS1 and CS2 in the TCGA-LIHC cohort. M value, methylation value; CS, clustering subtype. (B–E) Kaplan–Meier curves corresponding to subtypes in the TCGA-LIHC cohort for overall survival, progression-free interval, disease-specific survival, and disease-free interval. (F) Consistency of subtype with nearest template prediction in the TCGA-LIHC cohort. (G) Evaluation of CS1 and CS2 subtypes in the ICGC-LIRI cohort. (H) Kaplan–Meier curves corresponding to subtypes in the GSE14520 cohort for overall survival. (I) Evaluation of CS1 and CS2 subtypes in the GSE14520 cohort. (J, K) Kaplan–Meier curves corresponding to subtypes in the GSE14520 cohort for overall survival and disease-free survival. Log-rank test was used in (B, C, D, E, H, J, K).
Figure 2
Figure 2
Clinical and molecular characteristics associated with subtypes across multiple cohorts, and their impact on survival. (A) Clinical features corresponding to CS1 and CS2 in the TCGA-LIHC cohort. (B) Clinical features corresponding to CS1 and CS2 in the ICGC-LIRI cohort. (C) Clinical features corresponding to CS1 and CS2 in the GSE14520 cohort. (D) Forest plot for univariate Cox of clinical variables and subtypes in the TCGA-LIHC, ICGC-LIRI and GSE14520 cohorts. (E) Hazard ratios for clinical features and CS subtypes in relation to overall survival based on multivariate Cox analysis in the TCGA-LIHC cohort. (F) Hazard ratios for clinical features and subtypes in relation to overall survival based on multivariate Cox analysis in the ICGC-LIRI cohort. (G) Hazard ratios for clinical features and subtypes in relation to overall survival based on multivariate Cox analysis in the GSE14520 cohort. *P < 0.05, **P ≤ 0.01, ***P ≤ 0.001.
Figure 3
Figure 3
Genomic alterations, mutation signatures and mutational burden in subtypes across cohorts. (A) Oncoplot showing the distribution of somatic mutations across the most frequently altered genes for CS1 and CS2 in the TCGA-LIHC cohort. (B) Proportions of mutations in TP53 and CTNNB1 for CS1 and CS2 in the TCGA-LIHC cohort. (C) The best matching COSMIC mutational signatures (with similarity scores) for CS1. (D) The best matching COSMIC mutational signatures (with similarity scores) for CS2. (E) Violin plots showing the distribution of tumor mutational burden (TMB) in CS1 and CS2 subtypes in the TCGA-LIHC cohort. (F) Violin plots showing the distribution of TMB in CS1 and CS2 subtypes in the ICGC-LIRC cohort. (G) Mutation status of TP53 and CTNNB1 in CS1 and CS2 subtypes, showing the proportion of wild-type (WT) and mutant (MUT) alleles for each gene in the different clusters. Wilcoxon test was used in (E, F) Chi-square test was used in (B, G) ***P ≤ 0.001.
Figure 4
Figure 4
Copy number alterations (CNA), gene expression and their correlation with subtypes. (A) Frequency plot showing the distribution of CNA across chromosomes for CS1 and CS2, with deletions (Del) and amplifications (Amp) indicated. (B) Statistical significance of CNA events with -log10 p-values shown for each region. (C) Circular plots depicting the distribution of CNA variants (Del and Amp) and their statistical significance across CS1 and CS2. Colors represent different levels of significance. (D) Volcano plot showing differentially expressed genes (DEGs). Red indicates upregulated genes and blue indicates downregulated ones. (E) Box plots showing the copy number variation (CNV) score of CPB2 and DLEU7 in CS1 and CS2. (F) Box plots presenting the gene expression of CPB2 and DLEU7 in CS1 and CS2. (G) Correlation analysis between CPB2 and DLEU7 gene expression and CNV score in CS1 and CS2. Pearson correlation coefficients and p-values are indicated. Wilcoxon test was used in (E, F).
Figure 5
Figure 5
Immune infiltration and subtypes distribution across different datasets. (A) Heatmap showing the enrichment scores of various immune and stromal cell types in CS1 and CS2 across TCGA-LIHC, ICGC-LIRI and GSE14520 cohorts. The color intensity represents the degree of enrichment. (B) Uniform manifold approximation and projection (UMAP) of scRNA-seq data, depicting different cell populations across the dataset, with major cell types labeled. (C–E) Scissor-based subtypes distribution of CS1 and CS2 in TCGA-LIHC, ICGC-LIRI and GSE14520 cohorts. The left panels display UMAP projections with cells color-coded by subtype (CS1: red, CS2: cyan, NULL: gray). The right bar plots illustrate the proportion of different cell types within each subtype. *P < 0.05, **P ≤ 0.01, ***P ≤ 0.001.
Figure 6
Figure 6
Drug response, immune score and predictive classification across different datasets. (A) Heatmap of drug response in CS1 and CS2 across the TCGA-LIHC, ICGC-LIRI and GSE14520 cohorts. The color represents drug response in each subtype, with yellow signifies CS1 sensitivity and blue signifies CS2 sensitivity. (B) Proportion of immunotherapy response and boxplots of EasleR score in CS1 and CS2 across the TCGA-LIHC, ICGC-LIRI and GSE14520 cohorts. (C) Boxplots showing MSI score and INFG in CS1 and CS2 across the TCGA-LIHC, ICGC-LIRI and GSE14520 cohorts. (D) Boxplots showing MDSC, CAF and M2-TAMs in CS1 and CS2 across the TCGA-LIHC, ICGC-LIRI and GSE14520 cohorts. (E) Boxplots showing T cell dysfunction and exclusion score in CS1 and CS2 across the TCGA-LIHC, ICGC-LIRI and GSE14520 cohorts. (F) Evaluation of CS1 and CS2 in the GSE109211 cohort. (G) Evaluation of CS1 and CS2 in the GSE104580 cohort. R indicates response, NR indicates no response. Wilcoxon test was used in (A–E) Chi-square test was used in (B, F, G) ns P ≥ 0.05, *P < 0.05, **P ≤ 0.01, ***P ≤ 0.001, ****P ≤ 0.0001.
Figure 7
Figure 7
Construction and evaluation of prognostic models across different datasets. (A) C-index of each model among different datasets sorted by the average of C-index in validation cohorts. (B) Meta-analysis of univariate Cox result of the best model StepCox[forward]+Ent[a=0.1] across the TCGA-LIHC, ICGC-LIRC and GSE14520 cohorts. (C) Receiver operating characteristic (ROC) curves showing the prediction performance of the StepCox[forward]+Ent[a=0.1] model for 1-year (top left), 3-year (top right), and 5-year (bottom left) survival data across the TCGA-LIHC, ICGC-LIRC and GSE14520 cohorts. (D) Kaplan-Meier curves showing the survival probability for high-risk and low-risk groups predicted by the risk score calculated by StepCox[forward]+Ent[a=0.1] model across TCGA-LIHC (left), ICGC-LIRC (right), and GSE14520 (bottom) cohorts. Log-rank test was used in (D).
Figure 8
Figure 8
Correlation of AIDRS with clinicopathological features, immune score, and survival outcomes across different datasets. (A) Boxplots displaying the AIDRS across the CS1 and CS2 for the TCGA-LIHC, ICGC-LIRI and GSE14520 cohorts. (B) UMAP plots (top) and violin plots (bottom) showing the expression distribution of AIDRS-related genes across the TCGA-LIHC, ICGC-LIRI and GSE14520 cohorts. (C) Kaplan-Meier curves showing the overall survival, progression-free interval, disease-specific survival and disease-free interval for high- and low-risk groups in the TCGA-LIHC cohort. (D) Kaplan-Meier curves showing the overall survival and progression-free interval in the ICGC-LIRI cohort. (E) Kaplan-Meier curve showing the overall survival in the GSE14520 cohort. (F) Violin plots illustrating the distribution of AIDRS based on clinicopathological features such as Grade, Stage, AFP, ALB and PT across the TCGA-LIHC cohort. (G) Violin plots comparing AIDRS across Stage in the ICGC-LIRI cohort. (H) Violin plots showing AIDRS based on clinicopathological features such as Stage, CLIP, AFP and tumor size across the GSE14520 cohort. (J) Scatter plots showing the correlation between AIDRS and EasleR score in the TCGA-LIHC, ICGC-LIRI and GSE14520 cohorts. (K) Scatter plots showing the correlation between AIDRS and MSI score in the in the TCGA-LIHC, ICGC-LIRI and GSE14520 cohorts. (L) Scatter plots showing the correlation between AIDRS and T cell dysfunction score in the in the TCGA-LIHC, ICGC-LIRI and GSE14520 cohorts. (M) Scatter plots showing the correlation between AIDRS and T cell exclusion score in the in the TCGA-LIHC, ICGC-LIRI and GSE14520 cohorts. Log-rank test was used in (C, D, E) Wilcoxon test was used in (A, F, G, H, I) Welch’s ANOVA test was used in (B) **P ≤ 0.01, ****P ≤ 0.0001.
Figure 9
Figure 9
Identification and validation of CEP55 as a prognostic biomarker across multiple datasets. (A) Overlapping differentially expressed genes (DEGs) among the TCGA-LIHC, ICGC-LIRI and GSE14520 cohorts. (B) Log2 fold change (log2FC) values of overlapping DEGs across the TCGA-LIHC, ICGC-LIRI and GSE14520 datasets. (C) Univariate Cox regression for overlapping DEGs associated with survival outcomes in TCGA-LIHC, ICGC-LIRI and GSE14520 cohorts. (D) Correlation heatmap showing the association of AIDRS and overlapping DEGs across the datasets. The color intensity represents the strength of the correlation. (E) Circular plot displaying the AUC value of overlapping DEGs, with each dataset (TCGA-LIHC, ICGC-LIRI and GSE14520) represented in different colors. (F) ROC curves illustrating the predictive accuracy of CEP55 in TCGA-LIHC, ICGC-LIRI and GSE14520 datasets. (G) Kaplan-Meier curves for overall survival, progression-free interval, disease-specific survival and disease-free interval of high and low CEP55 expression groups in the TCGA-LIHC cohort. (H) Kaplan-Meier curves for overall survival and event-free survival of high and low CEP55 expression groups in the ICGC-LIRI dataset. (I) Kaplan-Meier curve for overall survival in the GSE14520 dataset, showing significant survival differences between high and low CEP55 expression groups. (J) UMAP plot displaying the expression of CEP55 across different cell populations. The violin plot on the right shows the distribution of CEP55 expression across major cell types. Log-rank test was used in (G, I, J) Welch’s ANOVA test was used in (K) *P < 0.05, **P ≤ 0.01, ***P ≤ 0.001, ****P ≤ 0.0001.
Figure 10
Figure 10
Effects of CEP55 knockdown on cell proliferation, migration and invasion in Bel-7402 and Hep-3B cell lines. (A) Quantitative PCR analysis showing the relative expression of CEP55 in Bel-7402 and Hep-3B cells after transfection with siRNA (Si-1 and Si-2) compared to the negative control (NC). (B) Cell viability measured at 24, 48, and 72 h in Bel-7402 and Hep-3B cells. Proliferation was significantly reduced in siRNA-treated cells compared to NC. (C) Representative images (upper) and quantification (lower) of colony formation in Bel-7402 and Hep-3B cells after CEP55 knockdown. (D) Representative images of wound healing at 0 and 48 h (upper) and quantification of healing percentage (lower) in Bel-7402 and Hep-3B cells. (E) Representative images (upper) and quantification of invaded cells (lower) in Bel-7402 and Hep-3B cells at 0 and 48 h after CEP55 knockdown. Wilcoxon test was used in A, C, D, (E) Chi-square test was used in (B) *P < 0.05, **P ≤ 0.01, ***P ≤ 0.001.
Figure 11
Figure 11
Effects of CEP55 knockdown on tumor growth and proliferation in Bel-7402 and Hep-3B xenograft models. (A) Representative images (upper) and quantification (lower) of tumor weight and volume in Bel-7402 xenografts after CEP55 knockdown (shCEP55) and control treatments. (B) Representative images (upper) and quantification (lower) of tumor weight and volume in Hep-3B xenografts. (C) Western blotting analysis of CEP55 expression in Bel-7402 xenograft tumors. (D) Western blotting analysis of CEP55 expression in Hep-3B xenograft tumors. (E) Immunohistochemistry staining of Ki-67 and CEP55 in Bel-7402 xenograft tumors (upper) and corresponding quantification of Ki-67 and CEP55 staining (lower). (F) Immunohistochemistry staining of Ki-67 and CEP55 in Hep-3B xenograft tumors (upper) and corresponding quantification (lower). *P < 0.05, **P ≤ 0.01, ***P ≤ 0.001..
Figure 12
Figure 12
Sketch diagram illustrating the clinicopathological features, genetic alterations, immune status, and treatment responses among CS1 and CS2 based on multi-omics data, as well as the artificial intelligence-derived risk score (AIDRS) classification.

Similar articles

References

    1. Llovet JM, Kelley RK, Villanueva A, Singal AG, Pikarsky E, Roayaie S, et al. Hepatocellular carcinoma. Nat Rev Dis Primer. (2021) 7:1–28. doi: 10.1038/s41572-020-00240-3, PMID: - DOI - PubMed
    1. Bray F, Laversanne M, Sung H, Ferlay J, Siegel RL, Soerjomataram I, et al. Global cancer statistics 2022: GLOBOCAN estimates of incidence and mortality worldwide for 36 cancers in 185 countries. CA Cancer J Clin. (2024) 74:229–63. doi: 10.3322/caac.21834, PMID: - DOI - PubMed
    1. Reig M, Forner A, Rimola J, Ferrer-Fàbrega J, Burrel M, Garcia-Criado Á, et al. BCLC strategy for prognosis prediction and treatment recommendation: The 2022 update. J Hepatol. (2022) 76:681–93. doi: 10.1016/j.jhep.2021.11.018, PMID: - DOI - PMC - PubMed
    1. Finn RS, Qin S, Ikeda M, Galle PR, Ducreux M, Kim T-Y, et al. Atezolizumab plus bevacizumab in unresectable hepatocellular carcinoma. N Engl J Med. (2020) 382:1894–905. doi: 10.1056/NEJMoa1915745, PMID: - DOI - PubMed
    1. Llovet JM, Ricci S, Mazzaferro V, Hilgard P, Gane E, Blanc J-F, et al. Sorafenib in advanced hepatocellular carcinoma. N Engl J Med. (2008) 359:378–90. doi: 10.1056/NEJMoa0708857, PMID: - DOI - PubMed

MeSH terms

LinkOut - more resources