. 2025 Apr-Jun;17(2):86-97.
doi: 10.32607/actanaturae.27558.

The Hypomethylating Agent 5-Azacitidine Potentiates the Effect of RAS and Sp1 Inhibitors in Neuroblastoma Cells

Affiliations

The Hypomethylating Agent 5-Azacitidine Potentiates the Effect of RAS and Sp1 Inhibitors in Neuroblastoma Cells

K A Ivanenko et al. Acta Naturae. 2025 Apr-Jun.

Abstract

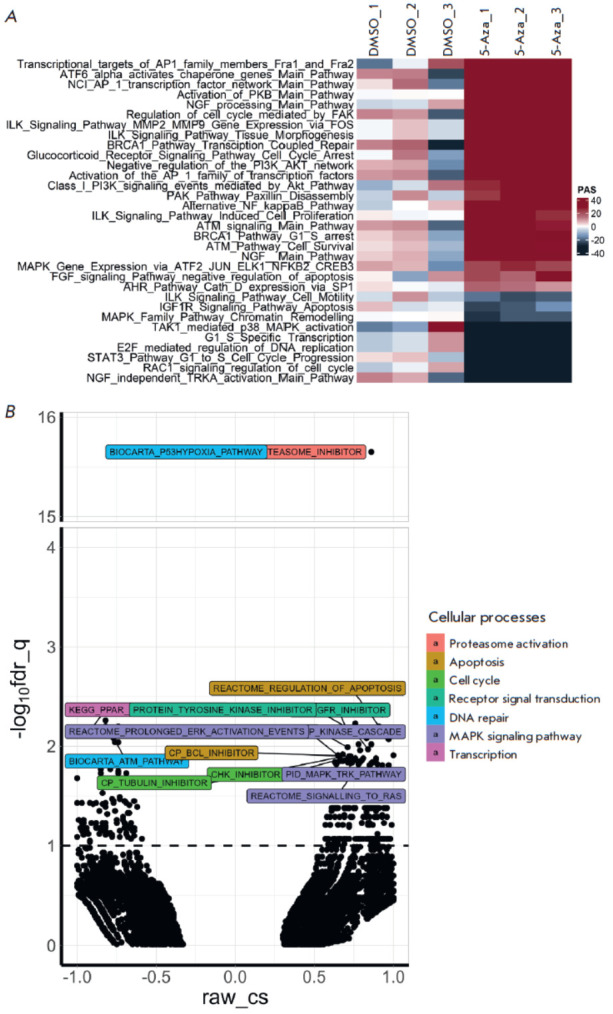
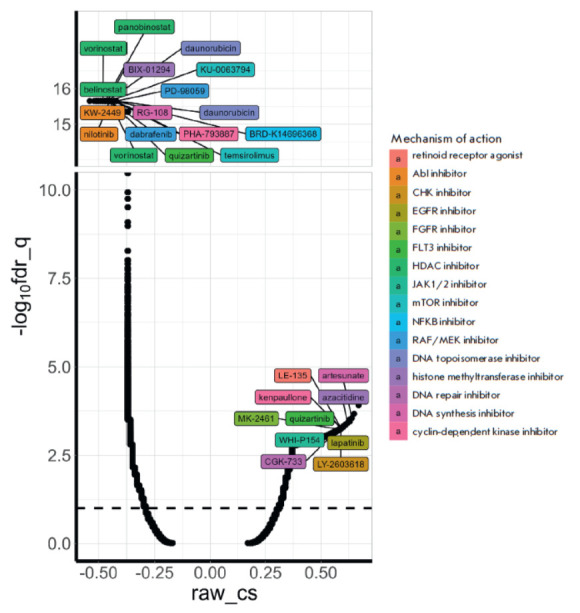
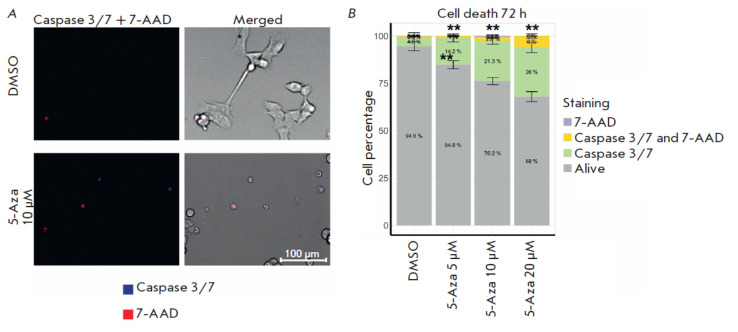
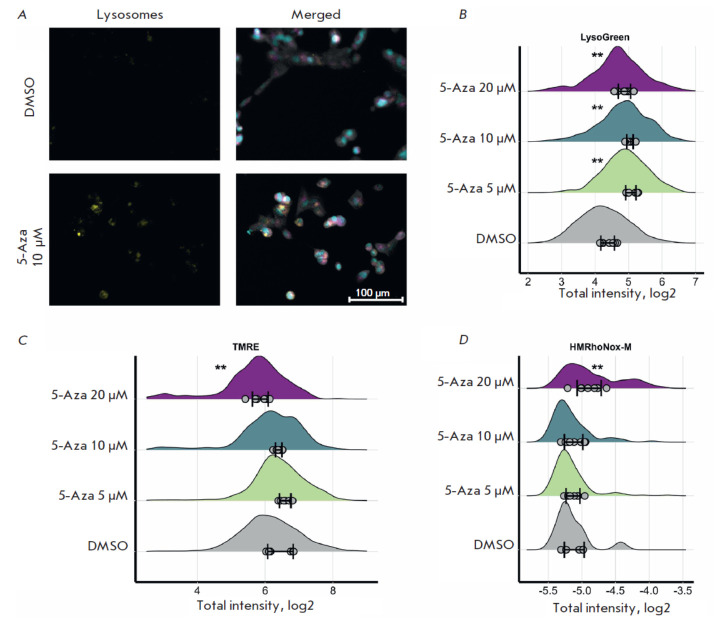
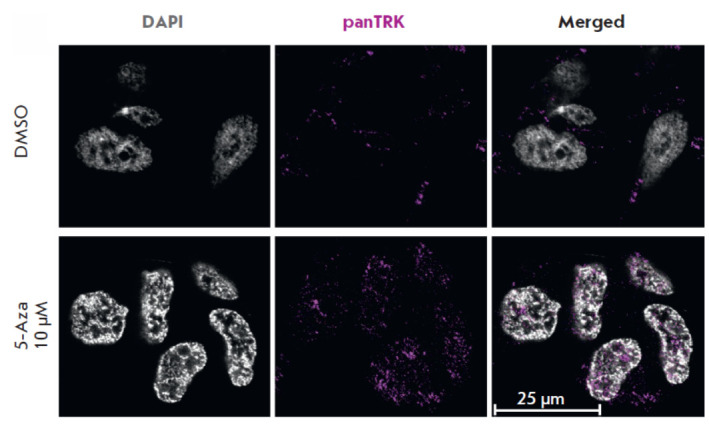
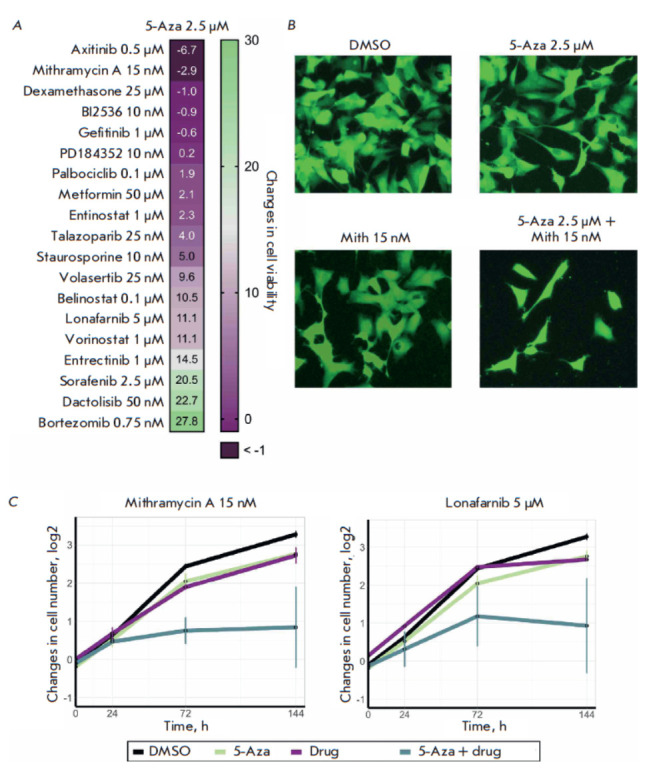
Neuroblastoma is a malignant solid tumor caused by the transformation of neural crest cells. Neuroblastoma predominantly occurs in children and is associated with a poor prognosis. In this regard, the development of novel approaches to neuroblastoma treatment, including combination therapy, is relevant. DNA hypermethylation of neuroblastoma cells indicates that it is possible to use hypomethylating agents in a combination therapy of the disease. In order to identify effective combinations of antitumor drugs, we analyzed the transcriptomic changes that take place in neuroblastoma SH-SY5Y cells after treatment with the hypomethylating agent 5-azacitidine and then experimentally tested the effectiveness of these combinations. Mithramycin A and lonafarnib were the two drugs that, in combination with 5-azacitidine, appeared to exert a synergistic effect on SH-SY5Y cell death. These drugs inhibit the signaling pathway associated with the transcription factor Sp1 and RAS-MAPK signaling pathway, which are activated by 5-azacitidine. An analysis of the signaling pathways also revealed an activation of the signaling pathways associated with neuroblastoma cell differentiation, as well as apoptosis induction, as confirmed by multiplex and confocal microscopy. Hence, by analyzing the changes in the signaling pathways, the mechanisms of cell death and cell adaptation to hypomethylating agents can be understood, and this can be further used to develop novel therapeutic approaches to neuroblastoma therapy.

Keywords: combination therapy; epigenetic regulators; pediatric malignant diseases.


Figures

Fig. 1
Fig. 1
Toxicity assessment of 5-azacitidine for human neuroblastoma SH-SY5Y cells. (A) Sensitivity of malignant cells of different origins to 5-azacitidine (5-Aza) within 72 h. The cells were treated with the drug at concentrations of 0.25–20 μM; the figure shows the AUC (area under the curve) values. (B) Survival of neuroblastoma SH-SY5Y cells after 5-Aza treatment for 72 h. The graphs show the average value of three replicates and the standard deviation (SD). Cells incubated with dimethyl sulfoxide (DMSO) were used as controls
Fig. 2
Fig. 2
Changes in the signaling pathways in human neuroblastoma SH-SY5Y cells after treatment with 5-azacitidine (5-Aza). (A) Pathway activation strength (PAS) in SHSY5Y cells after treatment with 5 μM 5-Aza for 24 h according to the results of the Oncobox analysis [22]. The data are shown separately for each replicate. Pathway activation strength: the positive changes are shown in red; the negative changes are shown in black. The signaling pathways that may contribute to the progression of malignant tumors and incur statistically significant changes are shown. (B) Cellular processes that are altered in SH-SY5Y cells after treatment with 5 μM 5-Aza for 24 h according to the CMAP analysis. The dots indicate cellular processes from the CMAP analysis. Different colors indicate the classes of cellular processes with a reliable result according to the CMAP analysis. The results are shown as the inverse of the decimal logarithm of q-values after correction for multiple values (-log10fdr_q) and connectivity scores (raw_cs) and the degrees of similarity between differentially activated genes and the analyzed effect. Positive raw_cs values indicate identical changes in gene expression in response to treatment with 5-Aza and specified perturbations, while the negative values indicate opposite changes in gene expression in response to treatment with 5-Aza and specified perturbations
Fig. 3
Fig. 3
Identifying drugs with an effect similar to that of 5-azacitidine (5-Aza) on the gene expression of human neuroblastoma SH-SY5Y cells using CMAP. The cells were treated with 5 μM 5-Aza and co-incubated with the drug for 24 h. The dots indicate the effects of inhibitors, small hairpin RNAs, or overexpression of certain genes. Different colors indicate the classes of inhibitors. Drugs with a statistically significant maximal effect are shown. The results are presented as the inverse of the decimal logarithm of q-values after correction for multiple values (-log10fdr_q) and connectivity scores (raw_cs) and the degrees of similarity between differentially activated genes and the analyzed effect. Positive raw_cs values indicate identical changes in gene expression in response to treatment with 5-Aza and specified perturbations, while the negative values indicate opposite changes in gene expression in response to treatment with 5-Aza and specified perturbations
Fig. 4
Fig. 4
The contribution of apoptosis to the death of human neuroblastoma SH-SY5Y cells after treatment with 5-azacitidine (5-Aza) for 72 h. (A) Caspase 3/7 and 7-aminoactinomycin D (7-AAD) staining in SH-SY5Y cells after treatment with 10 μM 5-Aza. (B) Apoptotic cells (green and yellow) in a population of SH-SY5Y cells after treatment with 5–20 μM 5-Aza. Cells were imaged using an automated fluorescence microscope. Cells co-incubated with dimethyl sulfoxide (DMSO) were used as control. The analysis was performed based on an assessment of the fluorescence intensity of dyes in 350–2,500 cells; the standard deviation (SD) was estimated for the average values for eight images for each 5-Aza concentration. Statistical significance was determined vs. DMSO using the Mann–Whitney U test (**p ≤ 0.01)
Fig. 5
Fig. 5
Changes in the lysosomal activity in human neuroblastoma SH-SY5Y cells after treatment with 5-azacitidine (5-Aza) for 72 h. (A) Lysosome staining in SH-SY5Y cells after treatment with 10 μM 5-Aza. Cells were imaged using a fluorescence microscope. Lysosomes are shown in yellow; nuclei, in blue; mitochondria, in magenta; tubulin, in gray. (B) Changes in the lysosomal activity in SH-SY5Y cells after treatment with 5–20 μM 5-Aza. (C) Changes in the mitochondrial activity in SH-SY5Y cells after treatment with 5–20 μM 5-Aza. (D) Changes in the FeII iron content in SH-SY5Y cells after treatment with 5–20 μM 5-Aza. Cells co-incubated with dimethyl sulfoxide (DMSO) were used as controls. The distributions of the integrated dye intensity in 350–2500 cells are shown; the average values for each of the eight images are shown with dots; the standard deviation (SD) for the average values for the images is also indicated. Statistical significance was determined vs. DMSO using the Mann–Whitney U test (**p ≤ 0.01)
Fig. 6
Fig. 6
The distribution of TRK proteins in the cytoplasm of human neuroblastoma SHSY5Y cells after treatment with 10 μM 5-azacitidine (5- Aza) for 72 h. Cells co-incubated with dimethyl sulfoxide (DMSO) were used as controls. Cells were imaged by confocal microscopy using anti- TRK antibodies (Alexa647, magenta) and by staining the nuclei of fixed cells with DAPI (gray)
Fig. 7
Fig. 7
The effectiveness of combinations of 5-azacitidine (5-Aza) and antitumor drugs against human neuroblastoma SH-SY5Y cells. The cells were simultaneously treated with 2.5 μM 5-Aza and an antitumor drug (the drugs and their concentrations are shown in the figure) and co-incubated for 144 h. Cells co-incubated with dimethyl sulfoxide (DMSO) were used as controls. (A) The heatmap showing the synergistic effect of a combination of 5-Aza and inhibitors belonging to different classes for SH-SY5Y cells. (B) Images of SH-SY5Y cells expressing the ERK-KTR H2B-Ruby reporter system after treatment with a combination of 2.5 μM 5-Aza and 15 nM mithramycin A (Mith) for 144 h. Cells were imaged by fluorescence microscopy. (C) The diagrams of changes in the number of SH-SY5Y cells after simultaneous addition of 2.5 μM 5-Aza and 15 nM mithramycin A or 5 μM lonafarnib. The diagrams show the average value of three replicates and the standard deviation (SD)

Similar articles

References

    1. Matthay K.K., Maris J.M., Schleiermacher G., Nakagawara A., Mackall C.L., Diller L., Weiss W.A., Nat. Rev. Dis. Prim. 2016;2(1):16078.:10.1038/nrdp.2016.78. - PubMed
    1. Irwin M.S., Naranjo A., Zhang F.F., Cohn S.L., London W.B., Gastier-Foster J.M., Ramirez N.C., Pfau R., Reshmi S., Wagner E., J. Clin. Oncol. 2021;39(29):3229–3241.:10.1200/JCO.21.00278. - PMC - PubMed
    1. Krystal J., Foster J.H., Children. 2023;10(8):1302.:10.3390/children10081302.
    1. Straathof K., Flutter B., Wallace R., Jain N., Loka T., Depani S., Wright G., Thomas S., Cheung G.W.-K., Gileadi T., Sci. Transl. Med. 2020;12(571):10.1126/scitranslmed.abd6169. - PubMed
    1. Foster J.H., Voss S.D., Hall D.C., Minard C.G., Balis F.M., Wilner K., Berg S.L., Fox E., Adamson P.C., Blaney S.M., Clin. Cancer Res. 2021;27(13):3543–3548.:10.1158/1078-0432.CCR-20-4224. - PMC - PubMed

LinkOut - more resources