

Cinobufagin Inhibits Invasion and Migration of Non-Small Cell Lung Cancer via Regulating Glucose Metabolism Reprogramming in Tumor-Associated Macrophages
- PMID: 40771860
- PMCID: PMC12327427
- DOI: 10.2147/DDDT.S531190
Cinobufagin Inhibits Invasion and Migration of Non-Small Cell Lung Cancer via Regulating Glucose Metabolism Reprogramming in Tumor-Associated Macrophages
Abstract
Background: The immunosuppressive tumor microenvironment (TME) in lung cancer, driven in part by M2-polarized tumor-associated macrophages (TAMs), contributes to worse prognosis and supports tumor progression. Cinobufagin (CB), an active compound in cinobufotalin injections, has demonstrated potential antitumor effects by modulating macrophage activity. This study investigated the mechanism by which CB influences glucose metabolism and polarization in M2 TAMs by focusing on the regulation of HIF-1α.
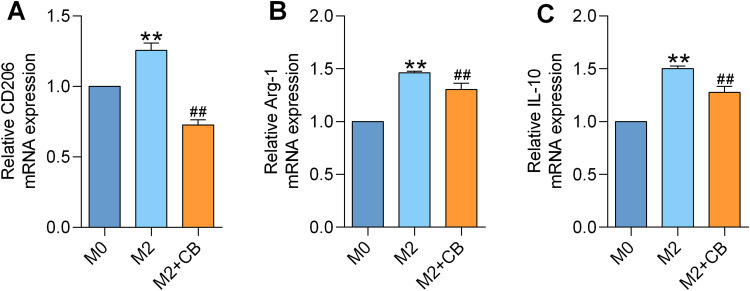
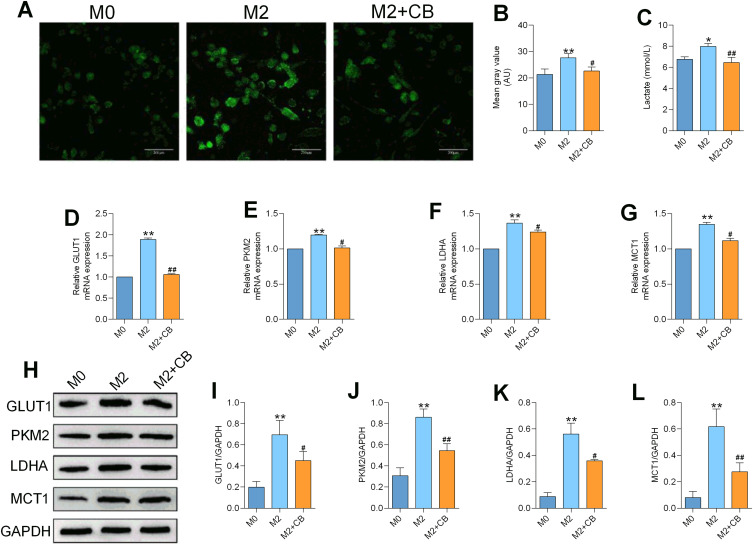
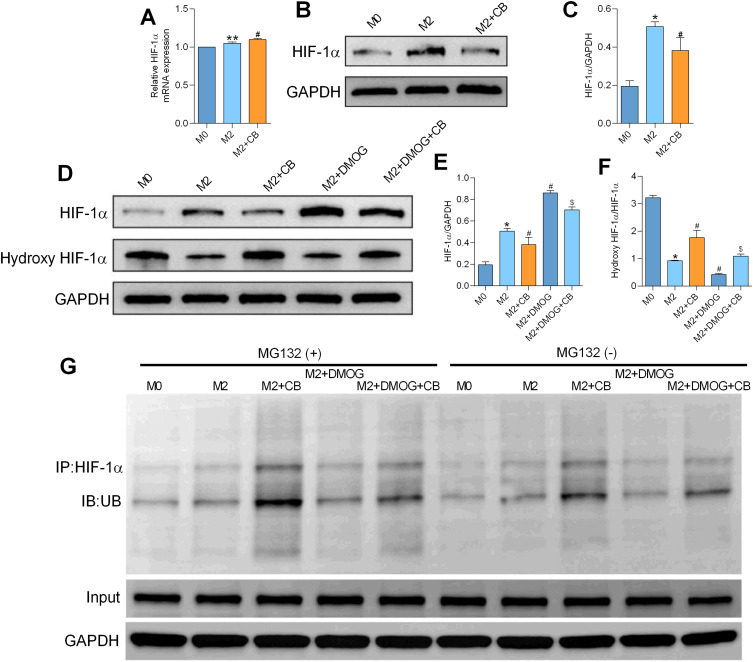
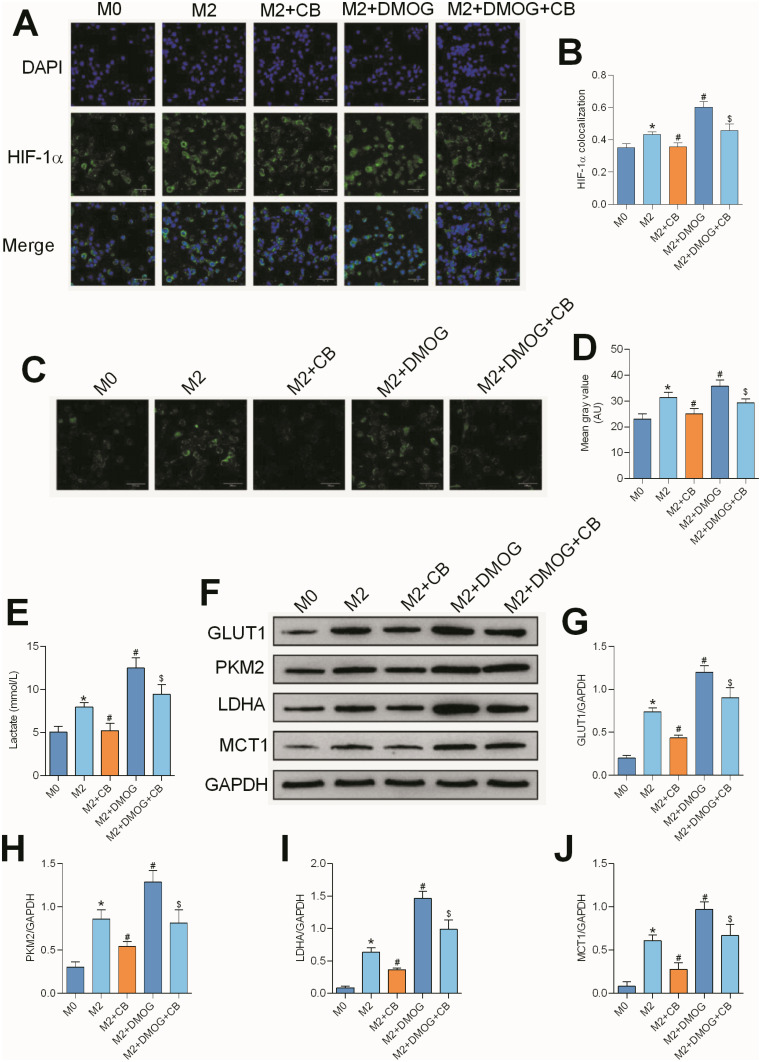
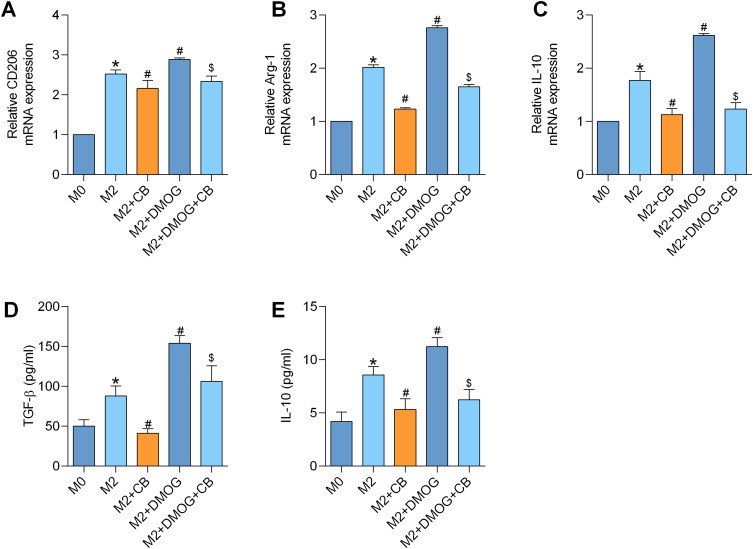
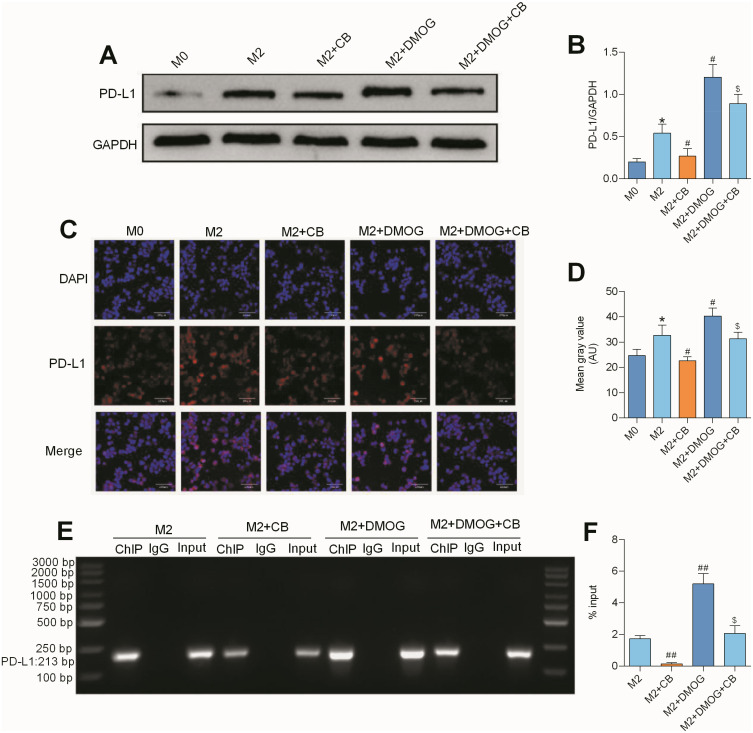
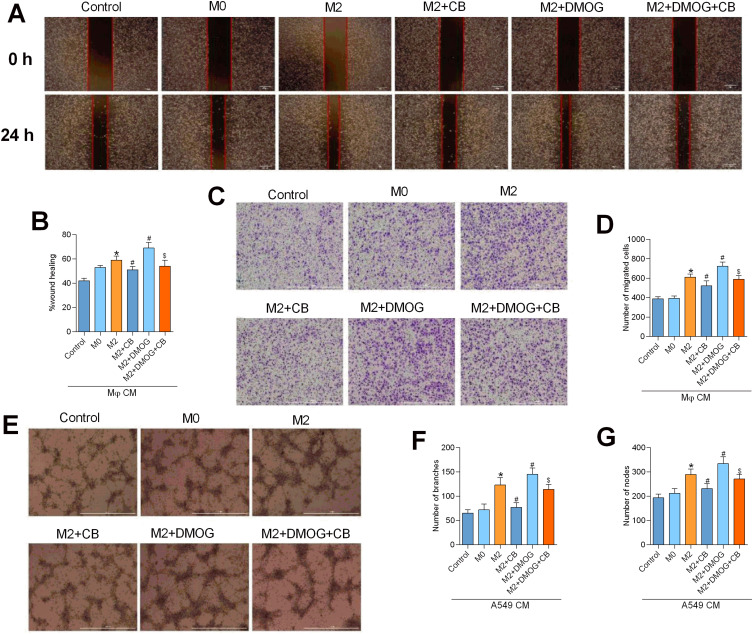
Methods: Human THP-1 monocytes were differentiated into M2 macrophages by stimulation with interleukin-4 at 20 ng/mL and then treated with cinobufagin at 2 μM, either alone or together with the HIF-1α activator DMOG at 1 mM. HIF-1α hydroxylation and ubiquitination were evaluated by Western blot and co-immunoprecipitation. Glycolytic activity was determined by measuring uptake of the glucose analogue 2-NBDG, extracellular lactate levels and expression of GLUT1, PKM2, LDHA and MCT1. M2 polarization markers CD206, Arg-1 and IL-10 were quantified by qRT-PCR, and TGF-β and IL-10 secretion was measured by ELISA. PD-L1 expression was assessed by Western blot, immunofluorescence and chromatin immunoprecipitation. Finally, conditioned media from treated macrophages were applied to A549 cells to evaluate migration through wound-healing assays and invasion using Transwell inserts, and to HUVECs to quantify tube formation.
Results: Using DMOG, an HIF-1α activator, we stimulated glycolysis in M2 macrophages, promoting their immunosuppressive polarization and elevating PD-L1 expression, a checkpoint protein associated with immune evasion. CB treatment reversed this effect by increasing HIF-1α hydroxylation and ubiquitination, leading to decreased HIF-1α stability, glucose uptake, and lactate production in M2 macrophages. Additionally, CB pre-treatment of M2 macrophages reduced the secretion of the cytokines TGF-β and IL-10, thereby limiting lung cancer cell migration, invasion, and angiogenesis.
Conclusion: These findings suggest that CB suppresses M2 macrophage-mediated tumor support by targeting HIF-1α and glycolysis, thereby reprogramming the TME toward an anti-tumor state. This highlights CB's potential of CB in the treatment of lung cancer by countering immunosuppressive macrophage activity.
Keywords: TAMs; TME; cancer immunotherapy; lung cancer; metabolic reprogramming.
© 2025 Sun et al.
Conflict of interest statement
The authors report no conflicts of interest in this work.
Figures
Similar articles
-
Liensinine reshapes the immune microenvironment and enhances immunotherapy by reprogramming metabolism through the AMPK-HIF-1α axis in hepatocellular carcinoma.J Exp Clin Cancer Res. 2025 Jul 15;44(1):208. doi: 10.1186/s13046-025-03477-6. J Exp Clin Cancer Res. 2025. PMID: 40665352 Free PMC article.
-
APOE Drives Glioma Progression by Modulating CCL5/CCR5 Signaling in the Tumor Microenvironment and Inducing M2 Macrophage Polarization.Immunobiology. 2025 May;230(3):152895. doi: 10.1016/j.imbio.2025.152895. Epub 2025 Mar 22. Immunobiology. 2025. PMID: 40203505
-
Mechanism of DT-13 regulating macrophages in diabetic wound healing.Cell Signal. 2024 Dec;124:111446. doi: 10.1016/j.cellsig.2024.111446. Epub 2024 Oct 2. Cell Signal. 2024. PMID: 39366531
-
Research progress on the interaction between glucose metabolic reprogramming and lactylation in tumors.Front Immunol. 2025 Jul 14;16:1595162. doi: 10.3389/fimmu.2025.1595162. eCollection 2025. Front Immunol. 2025. PMID: 40755753 Free PMC article. Review.
-
Nanomaterials in modulating tumor-associated macrophages and enhancing immunotherapy.J Mater Chem B. 2024 May 22;12(20):4809-4823. doi: 10.1039/d4tb00230j. J Mater Chem B. 2024. PMID: 38695349 Review.
References
-
- National Cancer Institute. SEER cancer stat facts: lung and bronchus cancer. 2022.
-
- Lu Z, Xu S, Ye M, et al. Comparison of pembrolizumab plus chemotherapy versus concurrent or sequential radiochemotherapy in patients with driver mutation-lacking lung adenocarcinoma presenting with recurrent laryngeal nerve invasion leading to hoarseness. J Clin Oncol. 2024;42(16_suppl):e14635. doi: 10.1200/JCO.2024.42.16_suppl.e14635 - DOI
MeSH terms
Substances
LinkOut - more resources
Full Text Sources
Medical
Research Materials
Miscellaneous
