. 2025 Jul 23:19:1569158.
doi: 10.3389/fncir.2025.1569158. eCollection 2025.

Vagus nerve stimulation modulates information representation of sustained activity in layer specific manner in the rat auditory cortex

Affiliations

Vagus nerve stimulation modulates information representation of sustained activity in layer specific manner in the rat auditory cortex

Tomoyo Isoguchi Shiramatsu et al. Front Neural Circuits. .

Abstract

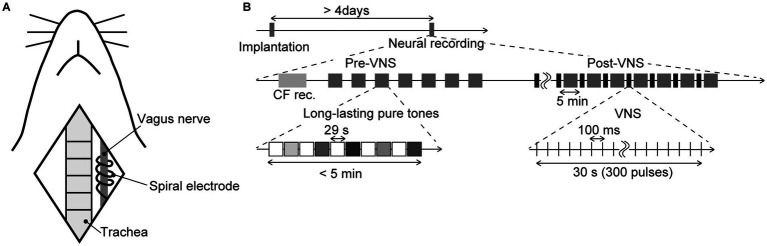
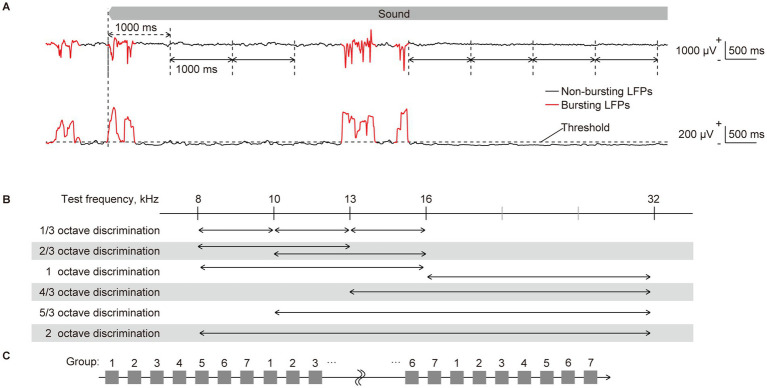
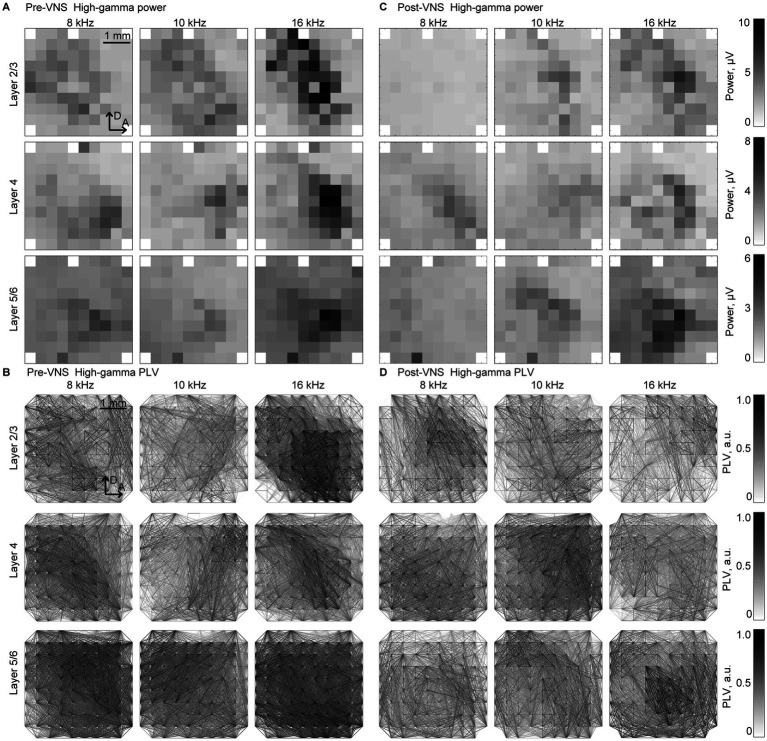
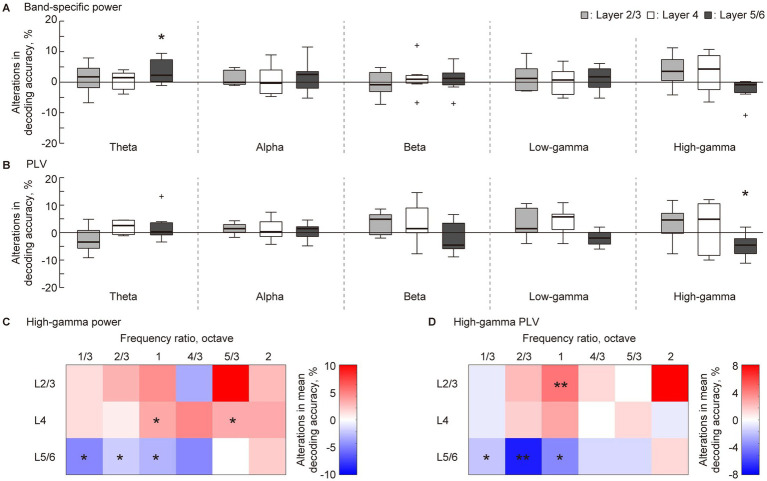
Understanding how vagus nerve stimulation (VNS) modulates cortical information processing is essential to developing sustainable, adaptive artificial intelligence inspired by biological systems. This study presents the first evidence that VNS alters the representation of auditory information in a manner that is both layer- and frequency band-specific within the rat auditory cortex. Using a microelectrode array, we meticulously mapped the band-specific power and phase-locking value of sustained activities in layers 2/3, 4, and 5/6, of the rat auditory cortex. We used sparse logistic regression to decode the test frequency from these neural characteristics and compared the decoding accuracy before and after applying VNS. Our results showed that VNS impairs high-gamma band representation in deeper layers (layers 5/6), enhances theta band representation in those layers, and slightly improves high-gamma representation in superficial layers (layers 2/3 and 4), demonstrating the layer-specific and frequency band-specific effect of VNS. These findings suggest that VNS modulates the balance between feed-forward and feed-back pathways in the auditory cortex, providing novel insights into the mechanisms of neuromodulation and its potential applications in brain-inspired computing and therapeutic interventions.

Keywords: auditory cortex; machine learning; microelectrode array; phase locking value; sparse logistic regression; sustained activity; vagus nerve stimulation.


Conflict of interest statement

The authors declare that the research was conducted in the absence of any commercial or financial relationships that could be construed as a potential conflict of interest.

Figures

Figure 1
Figure 1
Schematic diagram of the experiment (A) Animal preparation. The illustration shows anatomical landmarks of vagus nerve in a rat. The spiral electrodes of the system were coiled around the left vagus nerve. (B) Time course of the experiment. The tested animals were implanted with the stimulator more than 4 days before the neural recording. In the electrophysiological recording, we first performed the recording of the characteristic frequency (CF rec.) at each recording site, then two recording sessions, i.e., pre-VNS and post-VNS, were performed. In each session, we presented a sequence of long-lasting pure tones (29 s in duration, including a 5-ms rise/fall, 60 dB SPL). Test frequencies were 8.0, 10, 13, 16, and 32 kHz, and were randomized across the seven sequences. Each sequence did not exceed 5 min. In the post-VNS session, VNS was applied with a current of 500 μA, a pulse width of 130 μs, and a stimulation frequency of 10 Hz. The system stimulated for 30 s (300 pulses), alternating with a 5-min rest, during which the sequence of long-lasting pure tones was presented again.
Figure 2
Figure 2
Quantification of neural characteristics and decoding of test frequency. (A) (Top) representative raw traces of sustained local field potentials (LFPs) recorded from layer 2/3 in response to a pure tone of 16 kHz. LFPs during the initial second of sound presentation were considered as transient onset activity, as indicated by double-headed arrows with dashed lines. They were excluded from the quantification of neural characteristics. Following the onset response, the LFPs were separated by one consecutive second, as indicated by double-headed arrows with solid lines, from each of which band-specific power and PLV were calculated. The red and black traces of LFPs represent bursting and non-bursting LFPs, respectively, that were classified (please see the method section and the following figure). (Bottom) the standard deviation (SD) of 100-ms LFPs, including burst activities, is shown. Time intervals where the SD exceeds a threshold in more than 24 recording sites and persists for durations of 150 ms or longer were classified as bursting LFPs (red line), while others below these criteria were classified as non-bursting LFPs (black line). (B) Two-choice frequency decoding was conducted using frequency pairs with various frequency ratios. Given that we presented pure tones of five frequencies, we paired two. We applied six different decoding with distinct frequency distances, representing varying difficulty levels of distinction. (C) The 70 input data for each label were divided into seven groups by sequentially assigning them in a repeating pattern from group 1 to 7. Six of the groups (or 60 data) were then used for supervised learning, while the remaining group (10 data) was used for accuracy testing. Seven-fold cross-validation was performed by assigning all seven groups as test data once each.
Figure 3
Figure 3
Spatial patterns of the band-specific power and phase locking value (PLV) for the frequency decoding Representative spatial maps of (A,B) band-specific power and (C,D) phase-locking value (PLV) in the high-gamma band in response to selected test frequencies, 8, 10, and 16 kHz. The spatial maps for the recording from layers 2/3 (top), 4 (middle), and 5/6 (bottom) are displayed in three representative animals. The patterns exhibited similarities between the recordings (A,C) before and (B,D) after the application of VNS. The tonotopic shifts of the response foci are well identified, particularly in the spatial maps of the band-specific power.
Figure 4
Figure 4
Layer-specific VNS-induced changes in the decoding accuracy of sparse logistic regression. (A,B) In the five-choice discrimination of the test frequency, decoding accuracy for pre-VNS activities was subtracted from that of post-VNS activities. The alterations in decoding accuracy for each frequency band of sustained activity and each layer was accessed. Statistical tests for the change in decoding accuracy in (A) band-specific power and (B) phase locking value (PLV) were conducted. (C,D) We obtained the difference between median decoding accuracy in pre- and post-VNS recordings in the two-choice discrimination across six frequency ratios. The red and blue density scales represent the improvement and inhibition of the discrimination, respectively. Asterisks indicate that the median of the changes in decoding accuracy is significantly higher or lower than zero: *p < 0.05, **p < 0.01 (Wilcoxon rank sum test).

Similar articles

References

    1. Alkire M. T., Hudetz A. G., Tononi G. (2008). Consciousness and anesthesia. Science 322, 876–880. doi: 10.1126/science.1149213, PMID: - DOI - PMC - PubMed
    1. Bakin J. S., Weinberger N. M. (1990). Classical conditioning induces CS-specific receptive field plasticity in the auditory cortex of the guinea pig. Brain Res. 536, 271–286. doi: 10.1016/0006-8993(90)90035-a, PMID: - DOI - PubMed
    1. Bartos M., Vida I., Jonas P. (2007). Synaptic mechanisms of synchronized gamma oscillations in inhibitory interneuron networks. Nat. Rev. Neurosci. 8, 45–56. doi: 10.1038/nrn2044, PMID: - DOI - PubMed
    1. Ben-Menachem E. (2002). Vagus-nerve stimulation for the treatment of epilepsy. Lancet Neurol. 1, 477–482. doi: 10.1016/s1474-4422(02)00220-x, PMID: - DOI - PubMed
    1. Bonin V., Mante V., Carandini M. (2006). The statistical computation underlying contrast gain control. J. Neurosci. 26, 6346–6353. doi: 10.1523/JNEUROSCI.0284-06.2006, PMID: - DOI - PMC - PubMed

LinkOut - more resources