. 2025 Aug 6;13(8):e70728.
doi: 10.1002/fsn3.70728. eCollection 2025 Aug.

The Effect of Probiotics on the Improvement of Body Weight and Fat

Affiliations

The Effect of Probiotics on the Improvement of Body Weight and Fat

Hongfa Zhang et al. Food Sci Nutr. .

Abstract

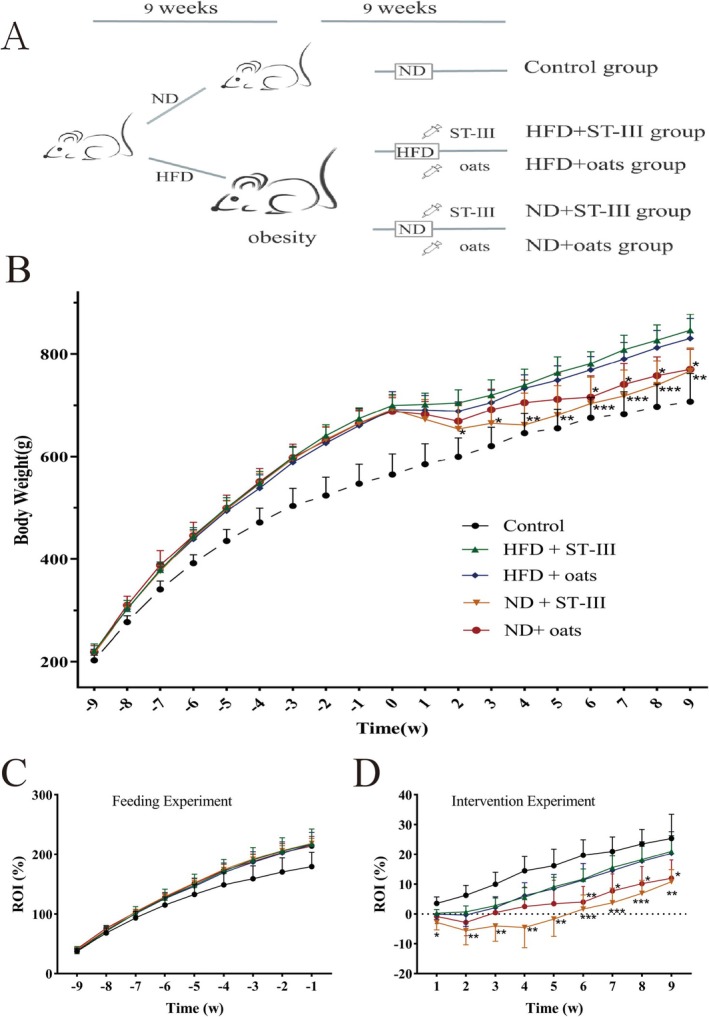
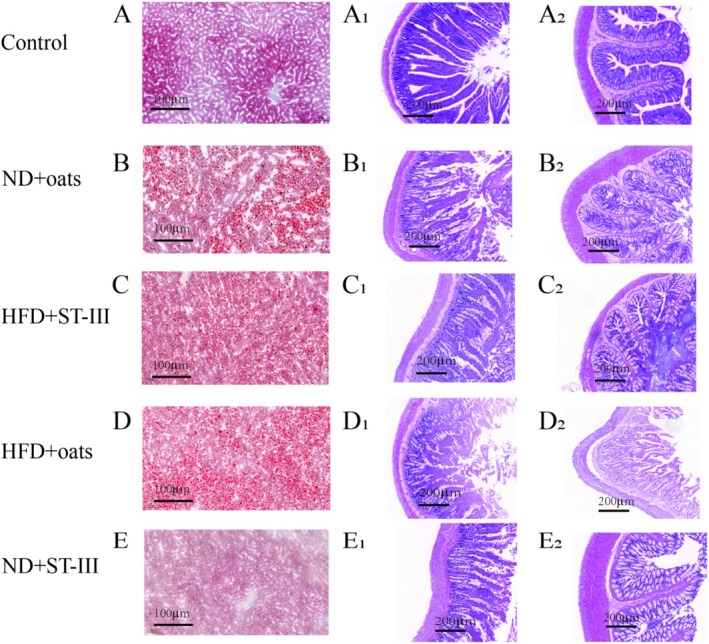
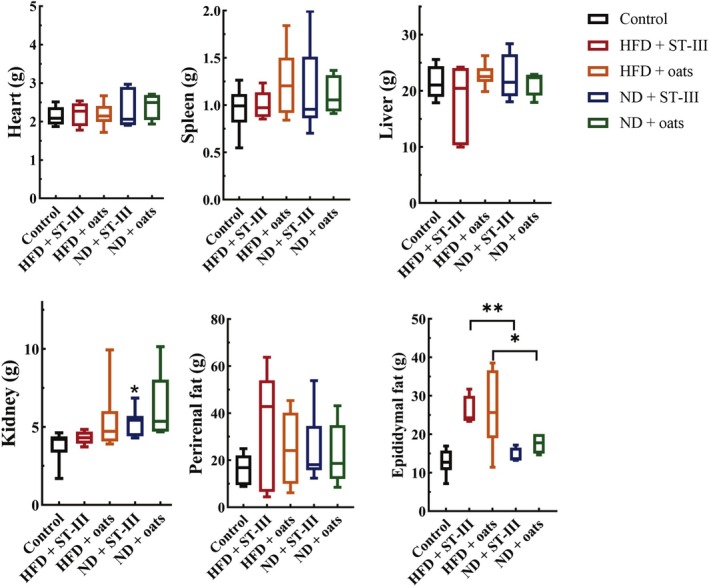
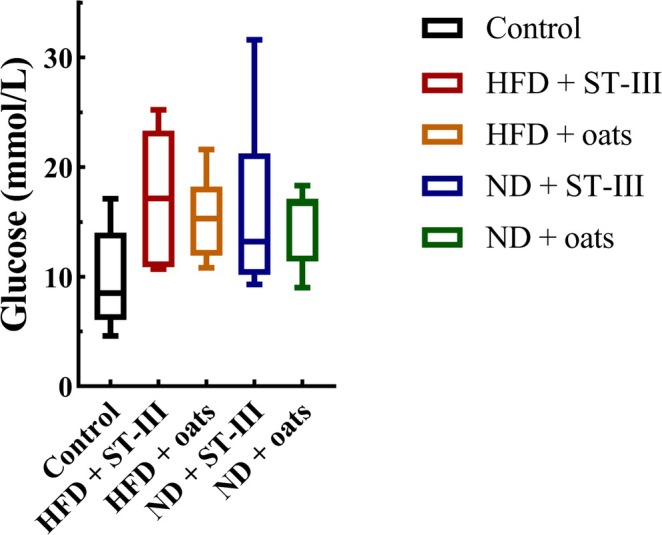
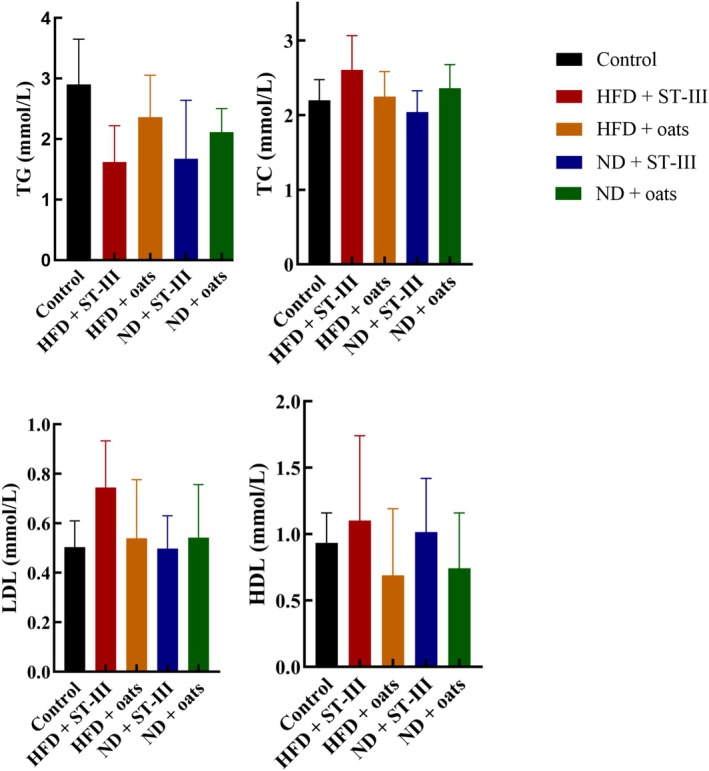
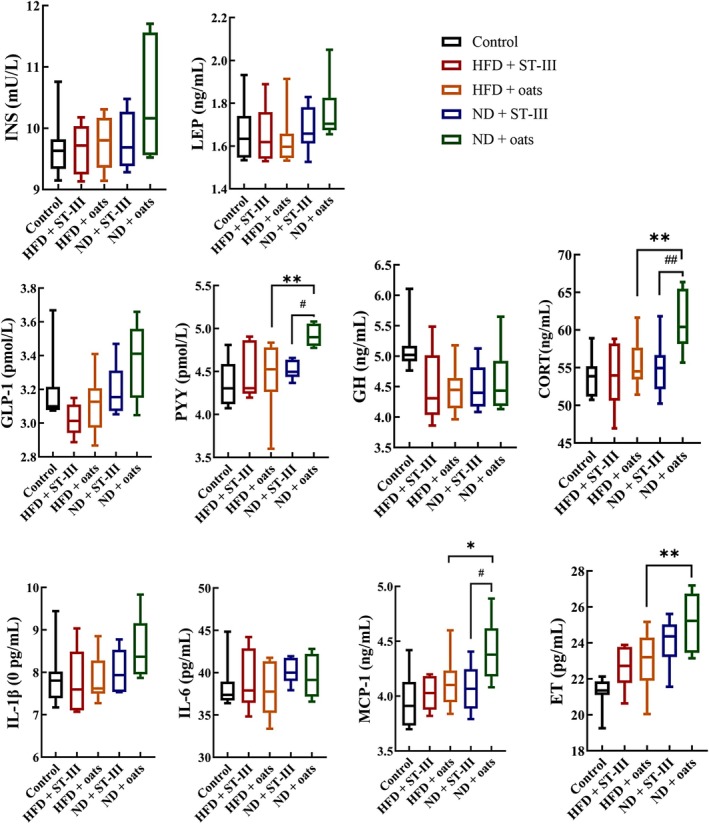
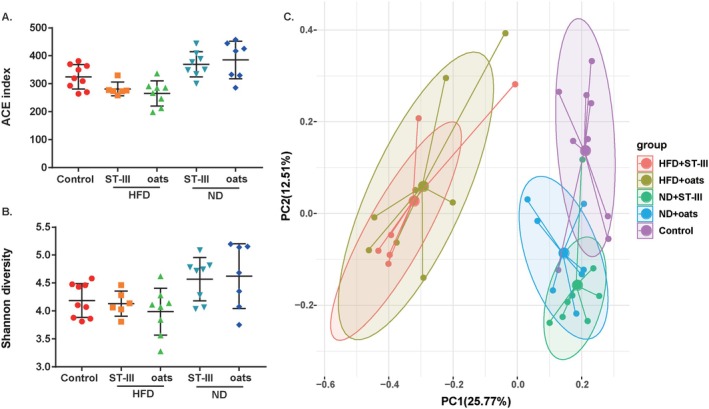
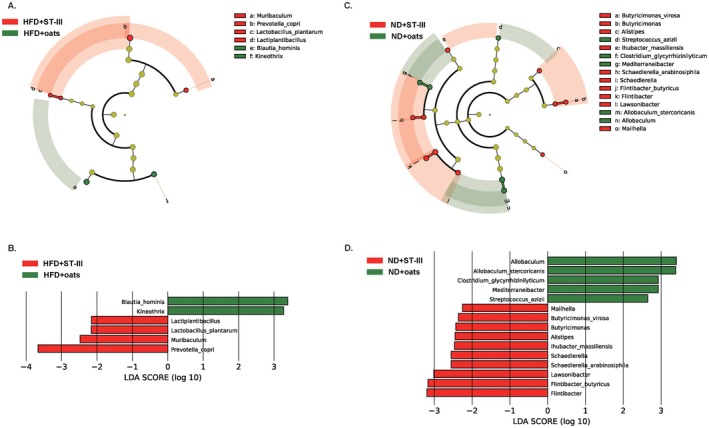
This study aimed to investigate the effects of Lactiplantibacillus plantarum (L. plantarum) ST-Ⅲ and oats supplementation on high-fat diet (HFD)-induced obesity in rats, focusing on changes in body weight, organ/fat tissue weights, inflammatory markers, serum parameters, and gut microbiota composition. Male Sprague-Dawley rats (n ≥ 6/group) were fed a normal diet (ND) or HFD for 9 weeks to establish obesity. Then, HFD-fed rats were divided into four groups: HFD + ST-Ⅲ, ND + ST-Ⅲ, HFD + Oats, and ND + Oats, receiving daily oral gavage of ST-III (1.5 × 10⁹ CFU/rat) or oats for another 9 weeks. Body weight, serum lipids, cytokines (e.g., IL-6, PYY, and MCP-1), liver histopathology, and gut microbiota were analyzed. Notably, weight loss is primarily influenced by diet, and better results can be achieved by controlling diet in combination with new edible L. plantarum ST-Ⅲ in promoting weight loss. L. plantarum ST-Ⅲ reduced the levels of the factors CORT and MCP-1, thereby potentially promoting weight loss. The ST-Ⅲ group showed earlier weight reduction (significant at Week 2) than the oats group (at Week 6). Gut microbiota analysis revealed differential abundances of Lactiplantibacillus, Blautia, and Prevotella between intervention groups. No significant differences in liver or organ weights were observed. L. plantarum ST-Ⅲ and oats attenuated HFD-induced obesity by modulating metabolic parameters, inflammation, and gut microbiota. ST-Ⅲ exhibited quicker anti-obesity effects, while oats enhanced probiotic growth. Dietary structure improvement remains critical for weight management. Further studies should address stress-related experimental limitations and explore clinical applications.

Keywords: Lactiplantibacillus plantarum; body weight; gut microbiota; obesity.


Conflict of interest statement

The authors declare no conflicts of interest.

Figures

FIGURE 1
FIGURE 1
Effects of the probiotic and oats interventions on growth. Obesity was induced by a HFD for 9 weeks, and this was followed by the interventions over 9 weeks. (A) Schematic of ST‐Ⅲ and oats on obesity model. The animals were randomly assigned to the indicated five groups (Control, HFD + ST‐Ⅲ, HFD + oats, ND + ST‐Ⅲ, and ND + oats group). (B) Weekly body weight changes of Sprague–Dawley (SD) rats. (C) Weekly body rate of increase (ROI) changes of SD rats in feeding experiment. There was no significant difference in weight gain rate among rats with successful obesity modeling. (D) Weekly body ROI changes of SD rats in intervention experiment. In rats with successful obesity modeling, there was no significant functional difference between ST‐Ⅲ and oats under high‐fat diet conditions (comparing Group HFD + ST‐Ⅲ with Group HFD + oats). However, under normal diet conditions (comparing Group ND + ST‐Ⅲ with Group ND + oats), ST‐Ⅲ had a better weight loss effect than oats (p > 0.05). The asterisk labeled on ND+ST‐Ⅲ group indicated significant changes compared with HFD+ST‐Ⅲ group and the asterisk labeled on ND+oats group indicated significant changes compared with HFD+oats group (n ≥ 6, * p < 0.05; **p < 0.01; *** p < 0.001).
FIGURE 2
FIGURE 2
Histopathological changes in liver and intestinal tissues. Liver sections were stained with Oil Red O to visualize lipid droplets (first column: A‐E). Duodenum (second column: A1‐E1) and colon (third column: A2‐E2) sections were stained with hematoxylin and eosin (H&E) to assess histology. Images were captured using light microscopy at 5× magnification. Panels display representative sections from each experimental group.
FIGURE 3
FIGURE 3
Tissue weights. Comparing group HFD + ST‐Ⅲ with group ND + ST‐Ⅲ (HFD + ST‐Ⅲ vs. ND + ST‐Ⅲ) revealed that diet (normal and high fat) had a significant impact on the epididymal fat of rats (p < 0.05). Each value is expressed as mean ± SD. * p < 0.05, **p < 0.01, n ≥ 6.
FIGURE 4
FIGURE 4
Fasting blood glucose levels at the end of study. Each value is expressed as mean ± SD. No significant difference was observed between groups, n ≥ 6.
FIGURE 5
FIGURE 5
The serum (TG, TC, HDL‐C, and LDL‐C) lipid profiles. Each value is expressed as mean ± SD. Values of each group were not significantly different. n ≥ 6. HDL‐C, high‐density lipoprotein cholesterol; LDL‐C, low‐density lipoprotein cholesterol; TC, total cholesterol; TG, triglyceride.
FIGURE 6
FIGURE 6
Biochemical analysis (interleukin [IL]‐6, IL‐1β, growth hormone [GH], leptin [LEP], insulin [INS], glucagons‐like peptide 1 [GLP‐1], cortisol, endotoxin [ET], monocyte chemotactic protein 1 [MCP‐1], and peptide YY [PYY]). Each value is expressed as mean ± SD. HFD + ST‐Ⅲ vs. ND + ST‐Ⅲ, HFD + oats vs. ND + oats group, *p < 0.05, **p < 0.01; HFD + ST‐Ⅲ vs. HFD + oats, ND + ST‐Ⅲ vs. ND + oats group, # p < 0.05, # # p < 0.01. n ≥ 6.
FIGURE 7
FIGURE 7
Microbial community comparison among groups. (A) ACE index; (B) Shannon diversity index; (C) principal coordinate analysis (PCoA) of gut microbiota among the five groups based on the Bray–Curtis distance.
FIGURE 8
FIGURE 8
Comparative taxonomic profile between ST‐Ⅲ group and oats group. (A) The cladogram showed differently enriched taxa in HFD + ST‐Ⅲ group and HFD + oats group; (B) LDA scores computed for differentially abundant taxa of HFD + ST‐Ⅲ group and HFD + oats group; (C) the cladogram showed differently enriched taxa in ND + ST‐Ⅲ group and ND + oats group; (D) LDA scores computed for differentially abundant taxa of ND + ST‐Ⅲ group and ND + oats group.

Similar articles

References

    1. Alemayehu, G. F. , Forsido S. F., Tola Y. B., and Amare E.. 2023. “Nutritional and Phytochemical Composition and Associated Health Benefits of Oat (<styled-content style="fixed-case"> Avena sativa </styled-content>) Grains and Oat‐Based Fermented Food Products.” Scientific World Journal 2023: 1–16. 10.1155/2023/2730175. - DOI - PMC - PubMed
    1. Alharbi, H. F. , Algonaiman R., and Barakat H.. 2022. “Ameliorative and Antioxidative Potential of <styled-content style="fixed-case"> Lactobacillus plantarum </styled-content>‐Fermented Oat (<styled-content style="fixed-case"> Avena sativa </styled-content>) and Fermented Oat Supplemented With Sidr Honey Against Streptozotocin‐Induced Type 2 Diabetes in Rats.” Antioxidants 11, no. 6: 1122. 10.3390/antiox11061122. - DOI - PMC - PubMed
    1. Batterham, R. L. , Cowley M. A., Small C. J., et al. 2002. “Gut Hormone PYY(3‐36) Physiologically Inhibits Food Intake.” Nature 418, no. 6898: 650–654. - PubMed
    1. Benjamin, J. C. , Paul J. M., Michael J. R., et al. 2016. “DADA2: High‐Resolution Sample Inference From Illumina Amplicon Data.” Nature Methods 13, no. 7: 3869. 10.1038/nmeth.3869. - DOI - PMC - PubMed
    1. Bolyen, E. , Rideout J. R., Dillon M. R., et al. 2019. “Reproducible, Interactive, Scalable and Extensible Microbiome Data Science Using QIIME 2.” Nature Biotechnology 9: 37. - PMC - PubMed

LinkOut - more resources