. 2025 Jul 23:16:1649023.
doi: 10.3389/fpls.2025.1649023. eCollection 2025.

Genome-wide association study reveals the genetic basis of vitamin C content in rapeseed (Brassica napus L.) seedlings

Affiliations

Genome-wide association study reveals the genetic basis of vitamin C content in rapeseed (Brassica napus L.) seedlings

Chao Wang et al. Front Plant Sci. .

Abstract

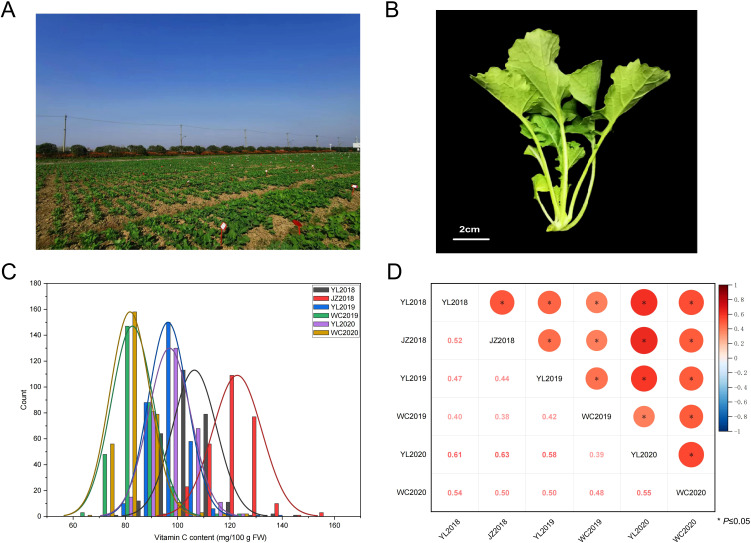
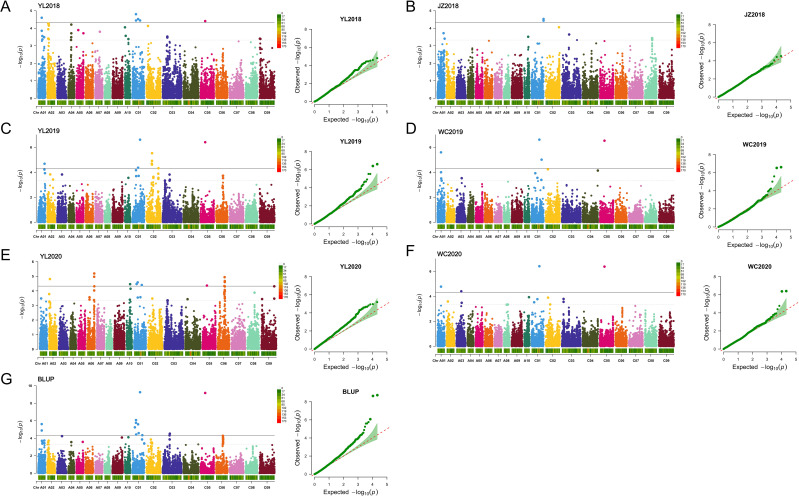
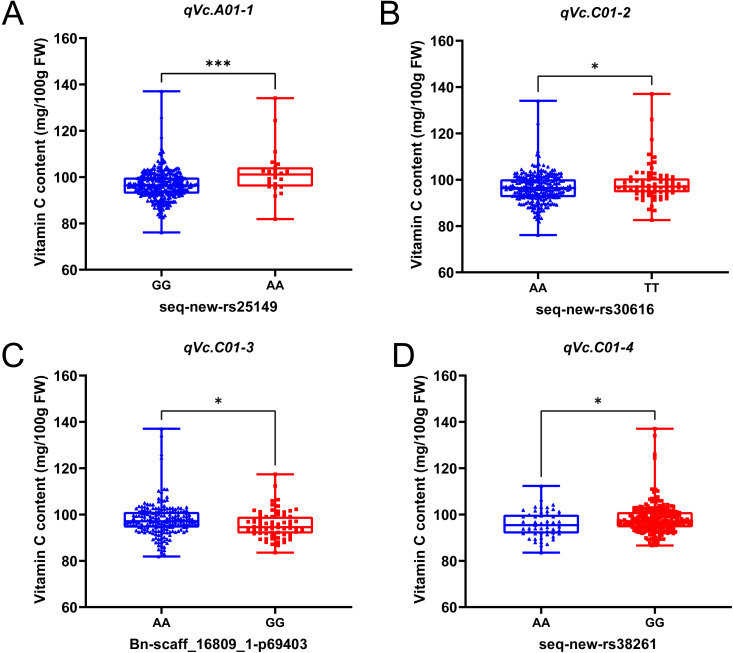
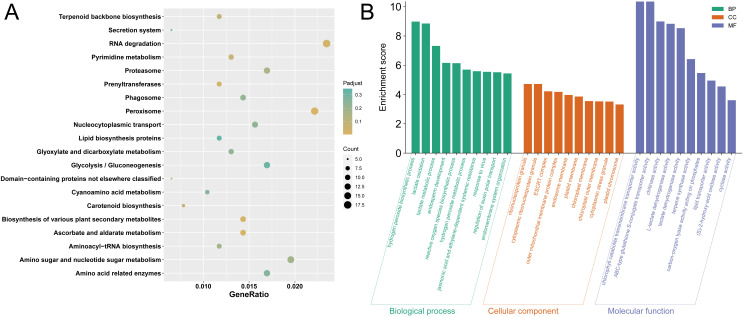
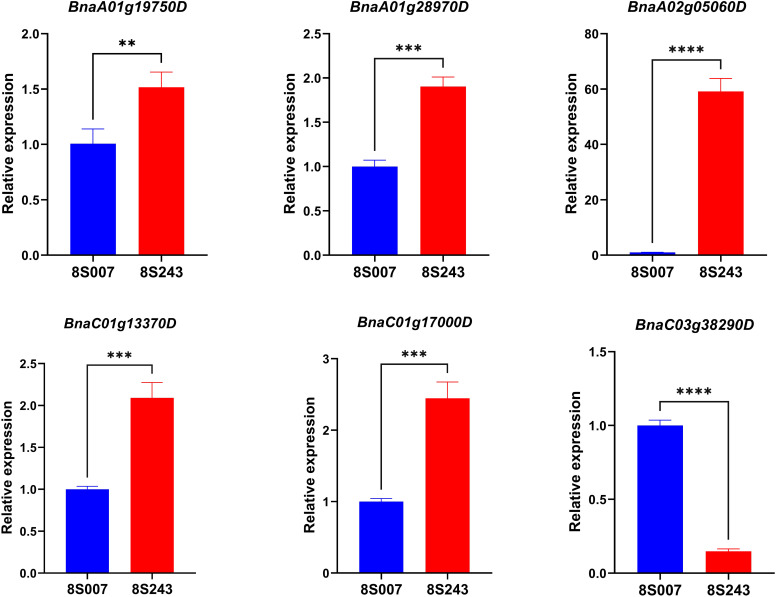
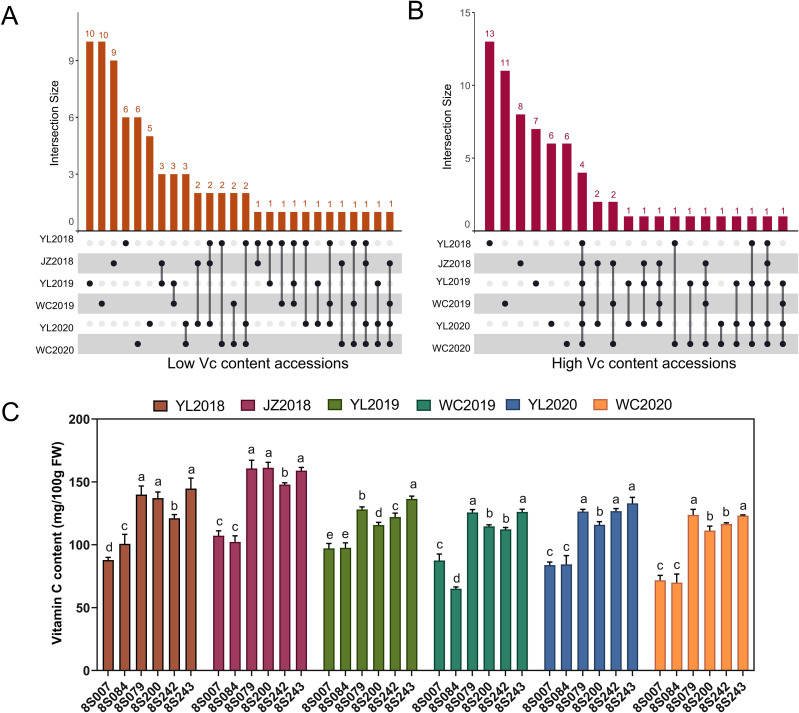
Rapeseed (Brassica napus L.) is a versatile crop, with its seedlings and flowering stalks can be utilized as vegetables, which are rich in vitamin C (Vc) and other essential nutrients, including selenium, calcium, zinc, and various amino acids. Despite the well-documented health benefits of Vc as a critical antioxidant nutrient, the genetic mechanisms governing Vc accumulation in rapeseed remain poorly understood. In this study, we investigated the Vc content of 327 rapeseed accessions during the seedling stage across six environments in Hubei province over three consecutive years (2018-2020). The Vc content in these environments ranged from 62.82 to 161.25 mg/100g, demonstrating high genetic variation (7.96% to 9.43%) and heritability (86.11%). Genome-wide association studies (GWAS) identified 31 significant single nucleotide polymorphisms (SNPs) across various chromosomes, which explained 5.68% to 12.78% of the phenotypic variation, integrated into 16 quantitative trait loci (QTLs). Kyoto Encyclopedia of Genes and Genomes (KEGG) and Gene Ontology (GO) enrichment analyses of the 2365 annotated genes near associated SNPs revealed significant involvement in diverse metabolic pathways including peroxisome, ascorbate, secondary metabolites, and terpenoid biosynthesis, as well as biological processes such as hydrogen peroxide/lactate metabolism and ROS biosynthesis, along with associations with specific cellular components and molecular functions. Furthermore, we identified six candidate genes that exhibit significant differences in expression between low and high Vc accessions, which are potentially involved in Vc biosynthesis but require further experimental validation. Additionally, we selected four superior germplasms (8S079, 8S200, 8S242, and 8S243) that demonstrate extreme Vc content, providing valuable germplasm resources for breeding. Collectively, these findings provide novel and comprehensive insights into the genetic and molecular mechanisms regulating Vc accumulation in rapeseed, thereby establishing a foundation for targeted genetic improvement of nutritional quality in vegetable rapeseed varieties.

Keywords: GWAS; candidate genes; germplasm resource; rapeseed seedlings; vitamin C.


Conflict of interest statement

The authors declare that the research was conducted in the absence of any commercial or financial relationships that could be construed as a potential conflict of interest.

Figures

Figure 1
Figure 1
The distribution of phenotypic traits and the relationship of Vc content among 327 accessions evaluated in six environments. (A) Phenotypic picture of field growth in natural populations. (B) Sampling of rapeseed seedlings. (C) The variation of Vc content observed in the six environments (2018YL, 2018JZ, 2019YL, 2019WC, 2020YL, and 2020WC). (D) Correlation analysis of Vc content in six environments.
Figure 2
Figure 2
GWAS of Vc content in rapeseed seedlings. Manhattan plot and QQ plot of Vc content across six environments [(A) 2018YL, (B) 2018JZ, (C) 2019YL, (D) 2019WC, (E) 2020YL, (F) 2020WC] and the best linear unbiased prediction (BLUP) (G), generated using a multivariate linear model (MLM). Within the Manhattan plot, the solid horizontal line signifies the significance threshold value adjusted using Bonferroni correction [–log10 (p) = 4.33].
Figure 3
Figure 3
Analysis of the importance of phenotypic variation at four reproducible association loci (A-D). The horizontal axis delineates the haplotype associated with the peak SNP at the identified loci of association. On the vertical axis, the content of Vc is represented. The violin plot presented illustrates both the average and the variability of Vc content corresponding to each haplotype. * and *** indicate statistically significant differences, with a P-value threshold of less than 0.05 and 0.001 respectively, as assessed through Student’s t-test.
Figure 4
Figure 4
KEGG and GO cluster pathway analysis of candidate genes. (A) Dot plot of the KEGG pathway enrichment. The horizontal axis represents the enrichment rate of the input genes in the pathway, while the vertical axis represents the pathway name. The color scale indicates different thresholds of the p value, and the size of the dot indicates the number of genes corresponding to each term. (B) GO function analysis histogram. Biological Process (BP) is marked by dark cyan, Cellular Component (CC) is marked by sienna, and Molecular Function (MF) is marked by steel blue.
Figure 5
Figure 5
The six candidate genes expression level rapeseed leaves of two accessions (8S007 and 8S243) of based on qRT-PCR. **, ***, and **** indicate statistically significant differences, with a P-value threshold of less than 0.05, 0.001, and 0.001 respectively, as assessed through Student’s t-test.
Figure 6
Figure 6
Statistical analysis of high and low Vc germplasms for six environments. (A) UpSet diagram showing low Vc content accessions for six environments. (B) UpSet diagram showing high Vc content accessions for six environments. (C) The statistical analysis of Vc content in two low-Vc and four high-Vc accessions for six environments. In figures, the different letters above the bars denote significance groupings (P < 0.05) as determined by ANOVA.

Similar articles

References

    1. Agius F., González-Lamothe R., Caballero J. L., Muñoz-Blanco J., Botella M. A., Valpuesta V. (2003). Engineering increased vitamin C levels in plants by overexpression of a D-galacturonic acid reductase. Nat. Biotechnol. 21, 177–181. doi: 10.1038/nbt777, PMID: - DOI - PubMed
    1. An H., Qi X., Gaynor M. L., Hao Y., Gebken S. C., Mabry M. E., et al. (2019). Transcriptome and organellar sequencing highlights the complex origin and diversification of allotetraploid Brassica napus . Nat. Commun. 10, 2878. doi: 10.1038/s41467-019-10757-1, PMID: - DOI - PMC - PubMed
    1. Bradbury P. J., Zhang Z., Kroon D. E., Casstevens T. M., Ramdoss Y., Buckler E. S. (2007). TASSEL: software for association mapping of complex traits in diverse samples. Bioinformatics 23, 2633–2635. doi: 10.1093/bioinformatics/btm308, PMID: - DOI - PubMed
    1. Bulley S., Laing W. (2016). The regulation of ascorbate biosynthesis. Curr. Opin. Plant Biol. 33, 15–22. doi: 10.1016/j.pbi.2016.04.010, PMID: - DOI - PubMed
    1. Carr A. C., Lykkesfeldt J. (2020). Discrepancies in global vitamin C recommendations: A review of RDA criteria and underlying health perspectives. Crit. Rev. Food Sci. Nutr. 61, 742–755. doi: 10.1080/10408398.2020.1744513, PMID: - DOI - PubMed

LinkOut - more resources