. 2025 Jul 23:13:1631116.
doi: 10.3389/fcell.2025.1631116. eCollection 2025.

Autophagy inhibition improves sensitivity to the multi-kinase inhibitor regorafenib in preclinical mouse colon tumoroids

Affiliations

Autophagy inhibition improves sensitivity to the multi-kinase inhibitor regorafenib in preclinical mouse colon tumoroids

Giulia Agostini et al. Front Cell Dev Biol. .

Abstract

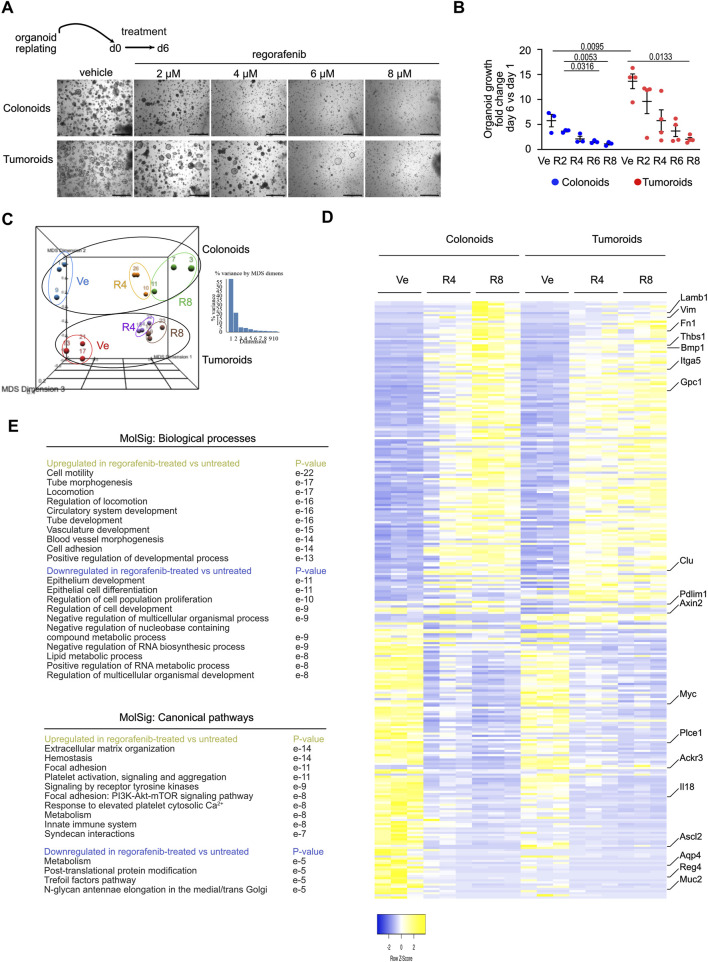
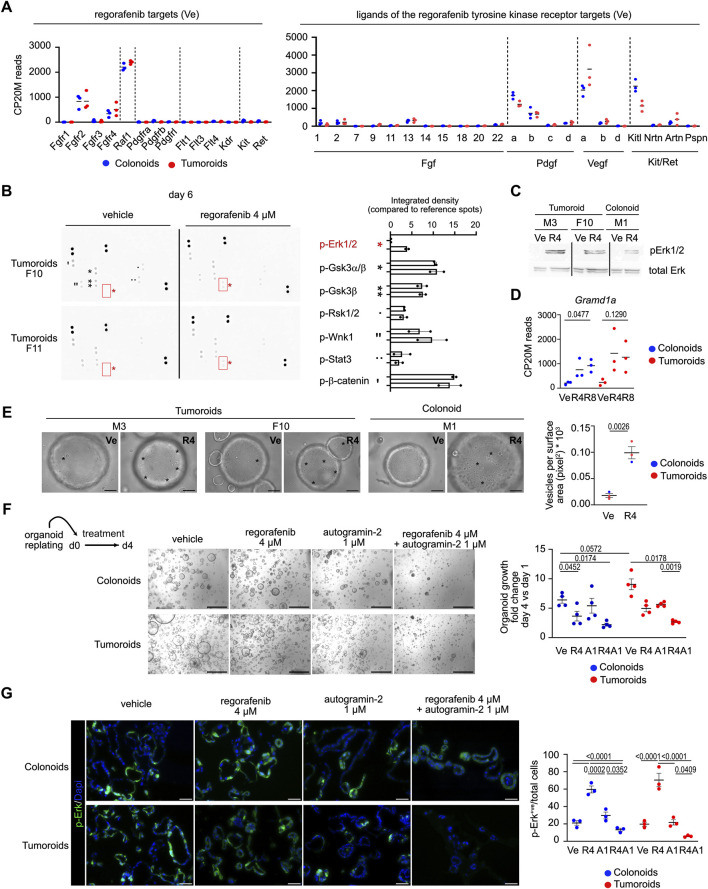
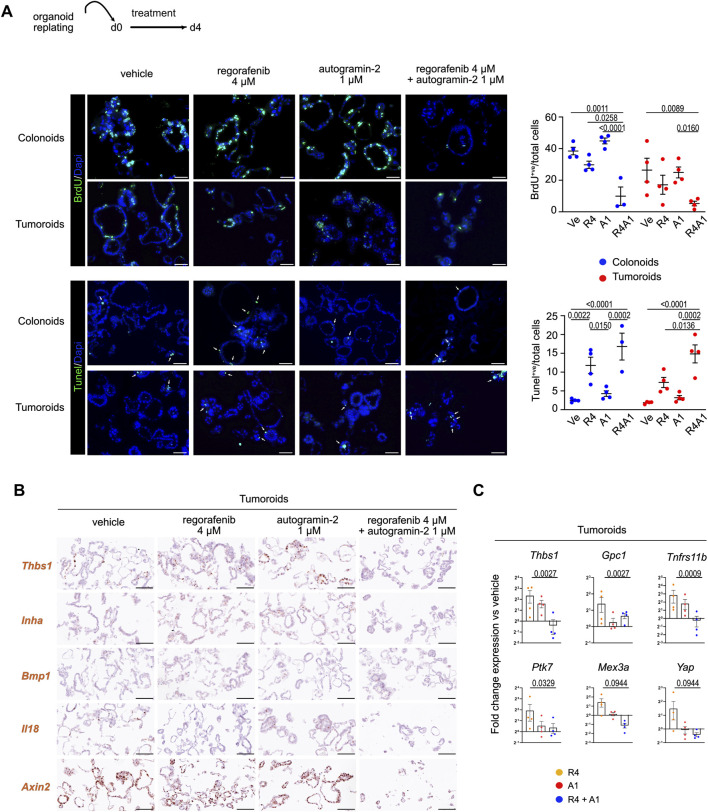
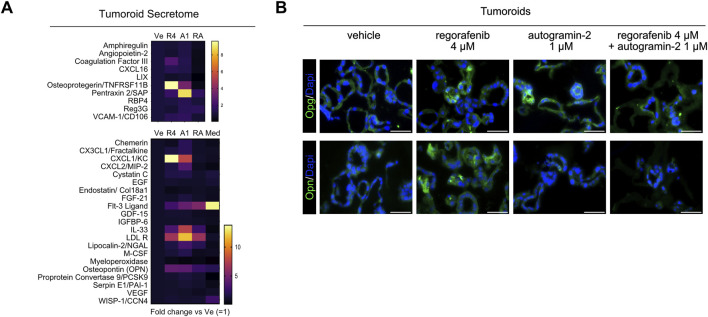
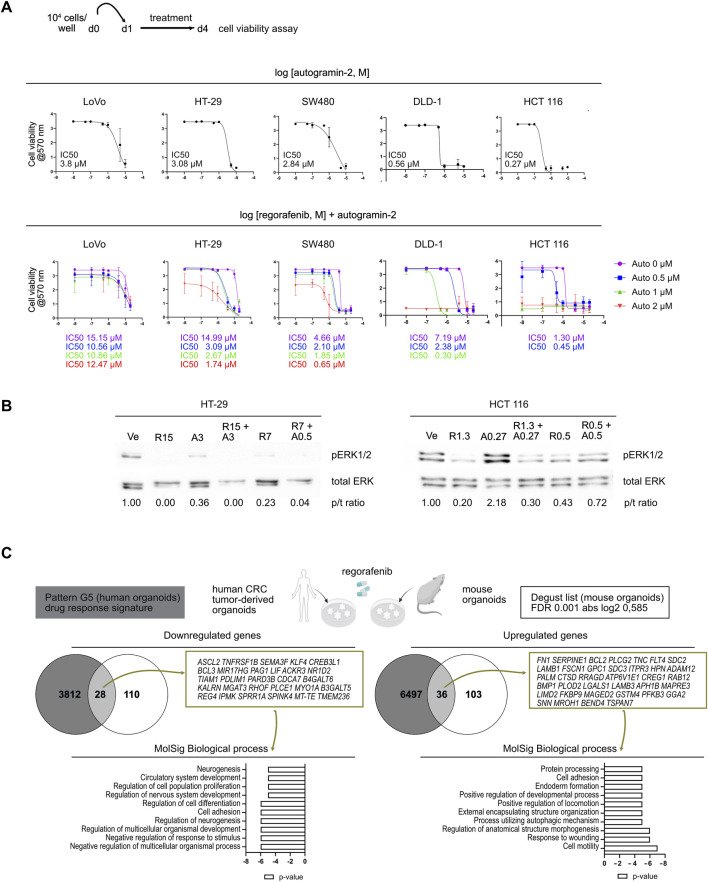
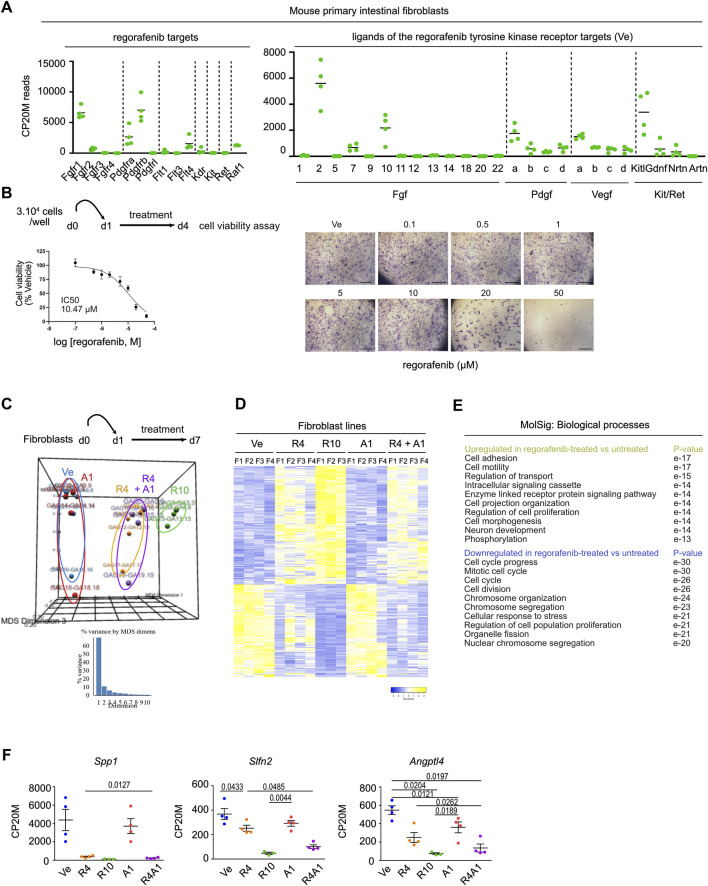
Colorectal cancer (CRC) remains the second leading cause of cancer-related deaths worldwide, with its incidence continuing to rise. Regorafenib, a multi-kinase inhibitor approved for palliative treatment, has been shown to extend survival in patients with metastatic CRC (mCRC) who have failed standard therapies. However, its clinical benefit is limited to a subset of patients, is typically short-lived, and is often accompanied by significant toxicity. The mechanisms by which CRC cells develop resistance to regorafenib remain incompletely understood. In this study, we investigated the mechanisms of regorafenib resistance using a preclinical mouse colon organoid model. Transcriptomic analysis of Apc wild-type and Apc-deficient organoids treated with regorafenib revealed upregulation of epithelial-to-mesenchymal transition (EMT), alterations in the secretome, and increased activation of phosphorylated Erk1/2. Notably, co-treatment with an autophagy inhibitor suppressed regorafenib-induced EMT and its associated secretory phenotype, leading to reduced cell proliferation and enhanced apoptosis in mouse organoids. The efficacy of this drug combination was further supported by cell viability assays in human CRC cell lines. In contrast, primary mouse colon fibroblasts exhibited greater resistance to both single-agent and combination regorafenib treatments. In summary, our findings using an organoid model suggest that autophagy inhibition may represent a promising strategy to overcome chemoresistance to regorafenib in mCRC patients.

Keywords: EMT; autophagy; chemoresistance; colorectal cancer; fibroblasts; organoids; regorafenib; tumoroids.


Conflict of interest statement

The authors declare that the research was conducted in the absence of any commercial or financial relationships that could be construed as a potential conflict of interest.

Figures

FIGURE 1
FIGURE 1
Regorafenib activates an Epithelial Mesenchymal Transition process in mouse organoids (A). Representative pictures showing the effect of regorafenib concentration on mouse colonoid or tumoroid cultures at day 6 (d6), endpoint of the treatment. Scale bars: 500 µm. (B) Quantification of organoid growth estimated as the mean area fold change of day 6 versus (vs.) day 1. Ve: Vehicle, 2 µM (R2), 4 µM (R4) or 8 µM (R8) regorafenib. Each symbol refers to an individual organoid line generated from an individual mouse (n = 3 colonoids, n = 4 tumoroids). One hundred elements were analyzed per organoid line. Data are represented as means ± sem. Two-way ANOVA tests with Tukey’s multiple comparisons. (C) Principal component analysis (PCA) plot of vehicle (Ve), 4 µM (R4) or 8 µM (R8) regorafenib-derived organoid transcriptomes. Each dot refers to an individual sample (n = 3 colonoid and 3 tumoroid lines). Fold change relative to colonoids in Ve conditions with false discovery rate of 0.001 and absolute fold change of 0.585 (11,308 expressed genes). (D) Heatmap of the 277 differentially expressed genes in vehicle (Ve), 4 µM (R4) or 8 µM (R8) regorafenib-derived organoids (log 2-fold change). (E) GSEA-Biological processes and Canonical pathways for upregulated and downregulated gene lists in regorafenib vs. vehicle-treated organoids. p value is indicated.
FIGURE 2
FIGURE 2
Phospho-ERK signaling activated by regorafenib treatment is suppressed by autophagy inhibition in mouse organoids (A). Expression levels of genes coding for regorafenib targets and for ligands of the tyrosine kinase receptors in Vehicle (Ve) culture conditions. CP20M: counts per kilobase of transcript per 20 million mapped reads. Each symbol corresponds to the value of an organoid line generated from an individual mouse. (B) Membranes showing protein kinase phosphorylation in vehicle or regorafenib-treated tumoroids from two different lines. Right panel: integrated density for the detected signals. (C) Western blot showing phospho-Erk (p-Erk1/2) induction in regorafenib 4 µM (R4) vs. vehicle (Ve)-treated tumoroid and colonoids. (D) Expression levels of the Gramd1a gene. CP20M: counts per kilobase of transcript per 20 million mapped reads. Vehicle (Ve), 4 µM regorafenib (R4) or 8 µM regorafenib (R8). Each symbol corresponds to the value of an organoid line generated from an individual mouse. One way ANOVA test with Tukey’s multiple comparisons. (E) Representative brightfield pictures showing the presence of vesicles (evidenced by asterisks) in 4 µM regorafenib (R4)-treated organoids compared to vehicle (Ve) conditions at day 4. Right panel: quantification of the vesicular density as the number of vesicles per surface area. Ten elements were analyzed per organoid line per culture condition. Unpaired t-test. Scale bar: 50 µm. (F) Representative pictures showing the effect of regorafenib, autogramin-2 or combined treatment on mouse colonoid or tumoroid cultures at day 6 (d6), endpoint of the treatment. Scale bars: 500 µm. Right panel: quantification of organoid growth estimated as the mean area fold change of day 4 versus (vs.) day 1. Vehicle (Ve), 4 µM regorafenib (R4), autogramin-2 1 µM (A1) and combined treatment (R4A1). Each symbol refers to an individual organoid line generated from an individual mouse (n = 4 colonoids, n = 4 tumoroids). One hundred elements were analyzed per organoid line. Data are represented as means ± sem. Two-way ANOVA tests with Tukey’s multiple comparisons. (G) Representative pictures of immunofluorescence showing phospho-Erk levels in vehicle or treated colonoids and tumoroids. Nuclei counterstained with Dapi. Scale bars: 50 µm. Right panel: quantification of p-Erk positive (+ve) cells relative to the total number of cells. Vehicle (Ve), 4 µM regorafenib (R4), autogramin-2 1 µM (A1) and combined treatment (R4A1). Each symbol refers to an individual organoid line (n = 3 colonoids, n = 3 tumoroids). An average of 850 cells were analyzed per organoid line. Two-way ANOVA tests with Tukey’s multiple comparisons.
FIGURE 3
FIGURE 3
Combined regorafenib treatment and autophagy inhibition reduces the EMT-related chemoresistance process in mouse organoids (A). Representative pictures of immunofluorescence showing cell proliferation (BrdU incorporation) and cell apoptosis (Tunel assay) in vehicle or treated colonoids and tumoroids. Nuclei counterstained with Dapi. Arrows indicate apoptotic cells. Scale bars: 50 µm. Right panels: quantification of BrdU+ve cells or Tunel+ve cells relative to the total number of cells. Each symbol refers to an individual organoid line (n = 4 colonoids, n = 4 tumoroids). Vehicle (Ve), 4 µM regorafenib (R4), autogramin-2 1 µM (A1) and combined treatment (R4A1). An average of 750 cells were analyzed per organoid line. Two-way ANOVA tests with Tukey’s multiple comparisons. (B) Expression of EMT-related transcripts detected in tumoroids by RNAscope. Scale bars: 100 µm. (C) Gene expression analysis by qRT-PCR of the indicated genes modulated by single or combined drug challenge. 4 μM regorafenib (R4), autogramin-2 1 µM (A1) and combined treatment (R4A1). Each symbol corresponds to a given tumoroid line. Expression levels are relative to vehicle-treated sample set at 1 per tumoroid line. One-way ANOVA tests with Dunn’s multiple comparisons. Thbs1: R4 vs. R4A1: p = 0.0370; Gpc1: R4 vs. R4A1: p = 0.0370; Tnfrs11b: R4 vs. R4A1: p = 0.0155; Ptk7: Ve vs. R4 and R4 vs. R4A1: p = 0.0823; Mex3a: R4 vs. R4A1: p = 0.0823; Yap: R4 vs. R4A1: p = 0.0823.
FIGURE 4
FIGURE 4
Secretome analysis of tumoroids (A). Heatmap showing tumoroid secreted molecules upon 4 µM regorafenib (R4), autogramin-2 1 µM (A1), combined drug treatment (RA) vs. vehicle (Ve) or culture medium alone (Med). Mean of two independent (Ve, R4 and RA) or a single experiment (A, Med). (B) Representative pictures of immunofluorescence showing expression of Osteoprotegerin/Tnfrsf11b (OPG) and Osteopontin/Spp1 (OPN) in vehicle or drug-treated tumoroids. Nuclei counterstained with Dapi. Scale bars: 50 µm.
FIGURE 5
FIGURE 5
Autophagy inhibition improves sensitivity to regorafenib in colorectal cancer cell lines (A). Dose-response curves of colorectal cancer cell lines treated with autogramin-2 (upper panels) or regorafenib combined with various concentrations of autogramin-2 (lower panels). The schematic representation of the cell viability assays performed on cell lines is shown. The IC50 for autogramin-2 is indicated in the graph for each cell line. Dose response curves for autogramin-2 were generated from the mean of 4 (LoVo) or 3 (HT-29, SW480, HCT 116, DLD-1) independent experiments, each performed in triplicate. Dose response curves for combined treatment were generated from the mean of 2 (LoVo, DLD-1) or 3-5 (HT-29, SW480, HCT 116) independent experiments, performed in triplicate. IC50 curves are represented as the mean ± sd of independent experiments. (B) Western blots of HT-29 and HCT 116 cells treated with vehicle (Ve), regorafenib (R) and autogramin-2 (A) at the indicated concentrations (µM). p/t ratio refers to the ratio of p-ERK 1/2/total ERK signals. Pictures represent a single experiment. (C) Compared gene expression profiles of mouse colon organoids (the 277 gene list) and human CRC tumor-derived organoids [drug response signature pattern (G5) reported by Mao et al (2024)] induced by regorafenib treatment. The genes commonly upregulated and downregulated in both types of samples were identified using the Venny 2.0.2 tool and the associated biological processes were further analyzed by GSEA MolSig. A list of common genes is provided.
FIGURE 6
FIGURE 6
Mouse colon fibroblasts exhibit higher resistance to regorafenib treatment and autophagy inhibition (A). Expression levels of genes coding for regorafenib targets and ligands of the tyrosine kinase receptors. CP20M: counts per kilobase of transcript per 20 million mapped reads. Each symbol corresponds to the value of a fibroblast cell line generated from an individual mouse. (B)Scheme of cell viability assays performed on mouse colon fibroblast cell lines. Left panel: dose-response curve of fibroblast cell lines treated with regorafenib (mean ± sd). The IC50 is indicated in the graph. Dose response curve was generated from mean values of 7 independent lines tested in triplicates, each line being generated from an individual mouse. Right panels: cell viability assay in one representative fibroblast cell line. Scale bars: 600 µm. (C)Principal component analysis (PCA) plot of vehicle (Ve), 1 µM autogramin-2 (A1), 4 µM (R4), 10 µM (R10) regorafenib or combined (R4A1)-treated fibroblast transcriptomes. Each dot refers to an individual sample (n = 4 fibroblast cell lines). Fold change relative to fibroblasts in Ve conditions with false discovery rate of 0.05 and absolute fold change of 0.585 (11,025 expressed genes). (D)Heatmap of the 630 differentially expressed genes in vehicle (Ve), 1 µM autogramin-2 (A1), 4 µM (R4), 10 µM (R10) regorafenib or combined (R4A1)-treated fibroblast transcriptomes (log 2-fold change). (E)GSEA- Biological processes for upregulated and downregulated gene lists in drug-treated vs. vehicle-treated organoids. p value is indicated. (F)Expression levels of several genes downregulated by regorafenib treatment. CP20M: counts per kilobase of transcript per 20 million mapped reads. vehicle (Ve), 1 µM autogramin-2 (A1), 4 µM (R4), 10 µM (R10) regorafenib or combined (R4A1). Each symbol corresponds to the value of an organoid line generated from an individual mouse. One-way ANOVA tests with Tukey’s multiple comparisons.

Similar articles

References

    1. Álvarez-Varela A., Novellasdemunt L., Barriga F. M., Hernando-Momblona X., Cañellas-Socias A., Cano-Crespo S., et al. (2022). Mex3a marks drug-tolerant persister colorectal cancer cells that mediate relapse after chemotherapy. Nat. Cancer 3 (9), 1052–1070. 10.1038/s43018-022-00402-0 - DOI - PubMed
    1. Arai H., Battaglin F., Wang J., Lo J. H., Soni S., Zhang W., et al. (2019). Molecular insight of regorafenib treatment for colorectal cancer. Cancer Treat. Rev. 81, 101912. 10.1016/j.ctrv.2019.101912 - DOI - PMC - PubMed
    1. Babicki S., Arndt D., Marcu A., Liang Y., Grant J. R., Maciejewski A., et al. (2016). Heatmapper: web-enabled heat mapping for all. Nucleic acids Res. 44 (W1), W147–W153. 10.1093/nar/gkw419 - DOI - PMC - PubMed
    1. Barker N., Van Es J. H., Kuipers J., Kujala P., Van Den Born M., Cozijnsen M., et al. (2007). Identification of stem cells in small intestine and colon by marker gene Lgr5. Nature 449 (7165), 1003–1007. 10.1038/nature06196 - DOI - PubMed
    1. Berg K. C., Eide P. W., Eilertsen I. A., Johannessen B., Bruun J., Danielsen S. A., et al. (2017). Multi-omics of 34 colorectal cancer cell lines-a resource for biomedical studies. Mol. cancer 16, 116–16. 10.1186/s12943-017-0691-y - DOI - PMC - PubMed

LinkOut - more resources