. 2025 Aug;31(8):e70418.
doi: 10.1111/gcb.70418.

Trade-Offs and Synergies Between Climate Change Mitigation, Biodiversity Preservation, and Agro-Economic Development Across Future Land-Use Scenarios in Brazil

Affiliations

Trade-Offs and Synergies Between Climate Change Mitigation, Biodiversity Preservation, and Agro-Economic Development Across Future Land-Use Scenarios in Brazil

Thomas M R Gérard et al. Glob Chang Biol. 2025 Aug.

Abstract

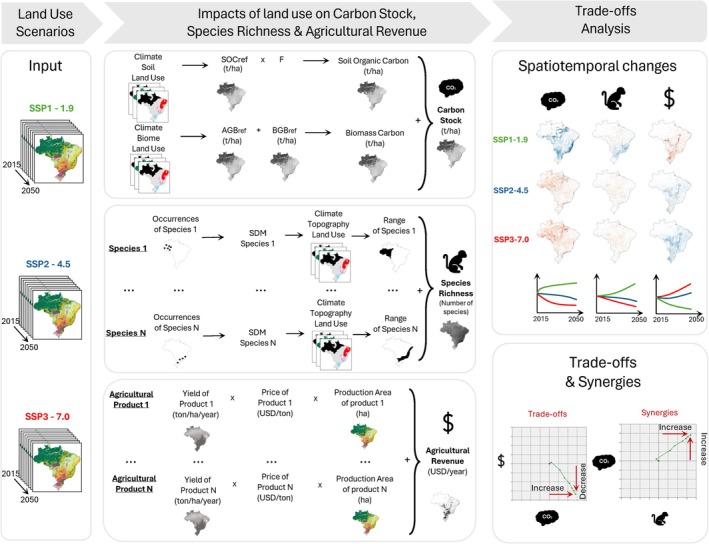
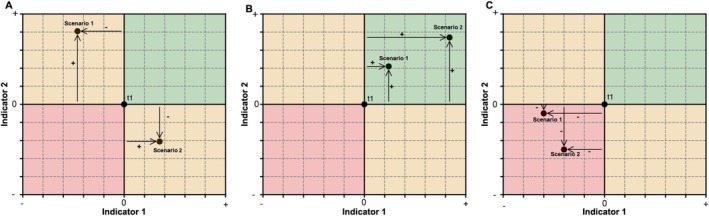
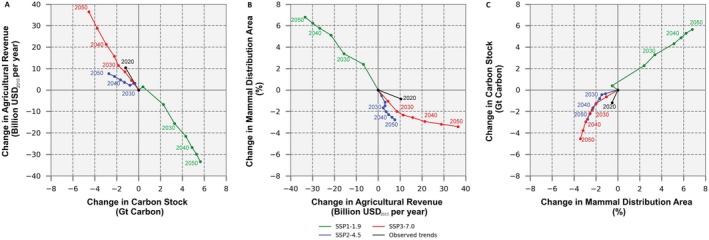
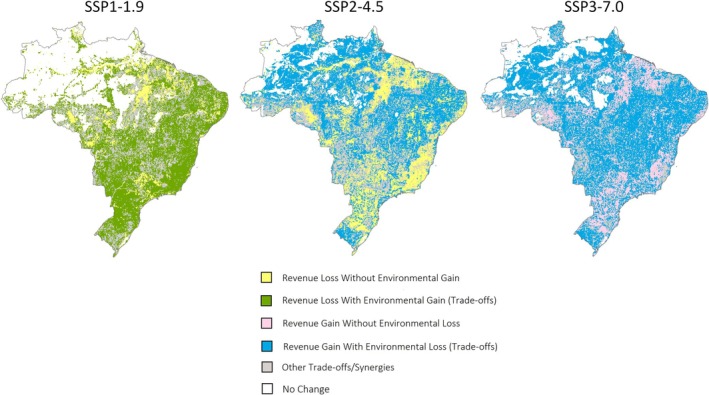
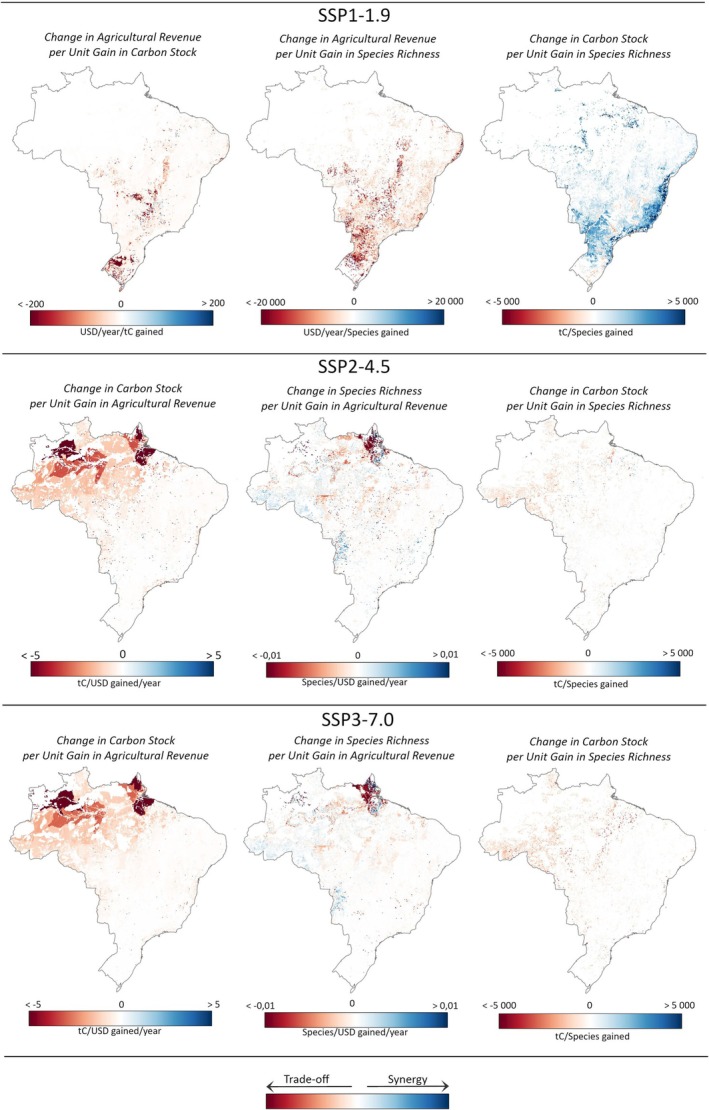
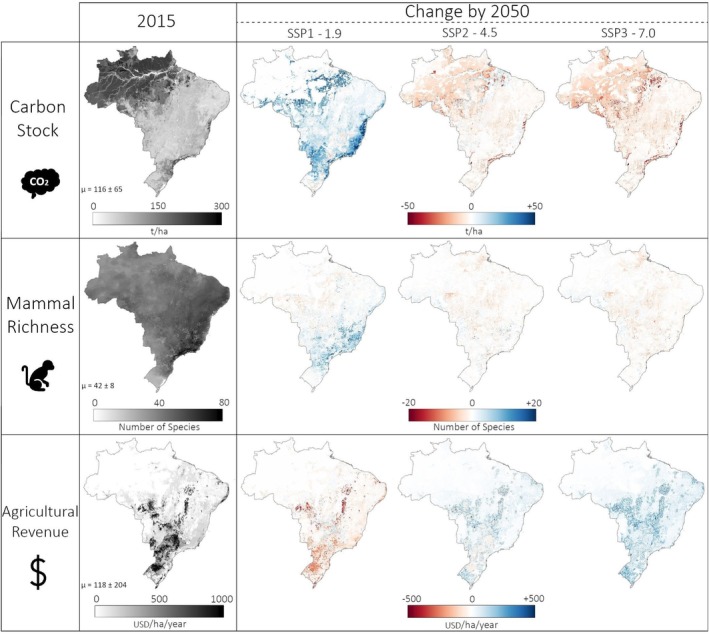
Land-use change is a major driver of biodiversity loss and a key contributor to GHG emissions, making sustainable land use essential for biodiversity preservation and climate change mitigation. The impacts of land use change are location-specific, shaped by the biophysical context. Consequently, the extent and nature of these impacts are deeply influenced by the spatial configuration of land-use change. This is particularly relevant for Brazil, a global agricultural powerhouse, where agricultural expansion impacts biodiversity-rich and carbon-rich biomes. Understanding the future land-use trade-offs and synergies between agro-economic development, biodiversity preservation, and climate change mitigation is crucial to support sustainable land use in Brazil. In this study, we quantified these trade-offs and synergies for three SSP-based land-use change scenarios projected for 2050. For each scenario, we assessed the spatial variation in impacts on carbon stocks, mammal distributions, and agricultural revenues. Our results show that the agricultural economy is projected to grow at the expense of biodiversity preservation and climate change mitigation objectives, and vice versa. These trade-offs and synergies result from changes in natural vegetation and agricultural land, driven by shifting demand for agricultural products. In particular, under the SSP3-7.0 scenario, rising agricultural demand between 2015 and 2050 is projected to drive agricultural expansion into natural areas, increasing annual agricultural revenue by 36.5 billion USD2015 but reducing carbon stock by 4.5 Gt and mammal distribution areas by 3.4%. In contrast, the SSP1-1.9 scenario projects a decline in agricultural demand over the same period, driving the conversion of agricultural land to natural vegetation. This shift increases carbon stocks by 5.6 Gt and expands mammal distribution areas by 6.8%, although it would lower annual agricultural revenue by 33.4 billion USD2015. Our findings further highlight opportunities to reduce trade-offs by containing agriculture outside biodiversity-rich and carbon-rich biomes, in combination with strategic restoration of these regions.

Keywords: GHG emissions; agricultural expansion; carbon sequestration; deforestation; environmental impacts; land use change; species richness.


Conflict of interest statement

The authors declare no conflicts of interest.

Figures

FIGURE 1
FIGURE 1
Methodological framework. The assessment of the impacts of land‐use changes on climate change mitigation, biodiversity preservation, and agro‐economic development, and a trade‐offs analysis across three scenarios. To assess the impact of land‐use on climate change mitigation, we quantify Brazil's land carbon stock, using stock change factors (F) and reference carbon stock in soil (SOCref), above‐ground biomass (AGBref), and below‐ground biomass (BGBref). To assess the impact of land‐use change on biodiversity, we quantify mammal richness by estimating the distribution of over 150 mammal species. These distributions are determined using Species Distribution Models (SDMs), one for each species. The agro‐economic assessment involves quantifying agricultural revenue by considering the revenues generated from both pasture and cropland.
FIGURE 2
FIGURE 2
Quantification of trade‐offs and synergies. In (A), examples of trade‐offs are shown. Scenario 1 leads to a decline in indicator 1 while improving indicator 2, compared to the initial state. In contrast, Scenario 2 results in a decline of indicator 2 and an improvement in indicator 1. In (B), synergies are depicted, where both Scenario 1 and Scenario 2 lead to improvements in both indicator 1 and indicator 2 relative to the initial state. Panel (C) illustrates a loss‐loss situation where both indicators decline.
FIGURE 3
FIGURE 3
Trade‐offs and synergies at national level. Trade‐offs and synergies between the changes by 2050 in carbon stock (Gt carbon), mammal distribution area (%), and agricultural revenue (USD2015/year) compared to their 2015 level for three land‐use change scenarios, as well as for the observed land‐use changes from 2015 to 2020. Panel (A) illustrates a trade‐off between carbon stock and agricultural revenue with improvements in carbon stock under SSP1‐1.9; agricultural revenue increases under SSP2‐4.5 and SSP3‐7.0. Panel (B) shows the trade‐offs between agricultural revenue and mammal distribution areas with an increase in mammal distribution areas under SSP1‐1.9; an increase in agricultural revenue under SSP2‐4.5 and SSP3‐7.0. Panel (C) highlights synergies between mammal distribution area and carbon stock under SSP1‐1.9, while a loss–loss relationship exists under SSP2‐4.5 and SSP3‐7.0.
FIGURE 4
FIGURE 4
Common types of trade‐offs and synergies across Brazil. These maps display the predominant types of trade‐offs and synergies projected between changes in carbon stock, mammal species richness, and agricultural revenue from 2015 to 2050 across the different scenarios. “Environmental Gain/Loss” refer to change in carbon stock and/or mammal species richness. Map lines delineate study areas and do not necessarily depict accepted national boundaries.
FIGURE 5
FIGURE 5
Magnitude of the trade‐offs and synergies across Brazil. These maps display the magnitude of the predominant types of trade‐offs and synergies observed between changes in carbon stock, mammal species richness, and agricultural revenue from 2015 to 2050 across the different scenarios. Map lines delineate study areas and do not necessarily depict accepted national boundaries.
FIGURE 6
FIGURE 6
Spatiotemporal impacts of land‐use change. Spatiotemporal changes in carbon stock (t/ha), mammal richness (number of species per cell) and agricultural revenue (USD2015/ha/year) between 2015 and 2050 under the three land‐use change scenarios. Map lines delineate study areas and do not necessarily depict accepted national boundaries.

Similar articles

References

    1. Allan, J. R. , Possingham H. P., Atkinson S. C., et al. 2022. “The Minimum Land Area Requiring Conservation Attention to Safeguard Biodiversity.” Science 376: 1094–1101. 10.1126/science.abl9127. - DOI - PubMed
    1. Allouche, O. , Tsoar A., and Kadmon R.. 2006. “Assessing the Accuracy of Species Distribution Models: Prevalence, Kappa and the True Skill Statistic (TSS).” Journal of Applied Ecology 43, no. 6: 1223–1232. 10.1111/j.1365-2664.2006.01214.x. - DOI
    1. Baldwin, B. G. , Thornhill A. H., Freyman W. A., et al. 2017. “Species Richness and Endemism in the Native Flora of California.” American Journal of Botany 104, no. 3: 487–501. 10.3732/ajb.1600326. - DOI - PubMed
    1. Banerjee, O. , Cicowiez M., Macedo M. N., et al. 2022. “Can We Avert an Amazon Tipping Point? The Economic and Environmental Costs.” Environmental Research Letters 17, no. 12: 125005. 10.1088/1748-9326/aca3b8. - DOI
    1. Barbet‐Massin, M. , Jiguet F., Albert C. H., and Thuiller W.. 2012. “Selecting Pseudo‐Absences for Species Distribution Models: How, Where and How Many?” Methods in Ecology and Evolution 3, no. 2: 327–338. 10.1111/j.2041-210X.2011.00172.x. - DOI

LinkOut - more resources