. 2025 Sep 2;13(9):e0068225.
doi: 10.1128/spectrum.00682-25. Epub 2025 Aug 7.

Pseudomonas aeruginosa Dnr-regulated denitrification in microoxic conditions

Affiliations

Pseudomonas aeruginosa Dnr-regulated denitrification in microoxic conditions

Stacie Stuut Balsam et al. Microbiol Spectr. .

Abstract

Pseudomonas aeruginosa causes acute and chronic infections, such as those that occur in the lungs of people with cystic fibrosis (CF). In infection environments, oxygen (O2) concentrations are often low. The transcription factor Anr (anaerobic regulation of arginine deiminase and nitrate reduction) responds to low O2 by upregulating genes necessary for P. aeruginosa fitness in microoxic and anoxic conditions. Anr regulates Dnr (dissimilative nitrate respiration regulator), a gene encoding a transcriptional regulator that promotes the expression of genes required for using nitrate as an alternative electron acceptor during denitrification. In CF sputum, transcripts involved in denitrification are highly expressed. While Dnr is necessary for the anoxic growth of P. aeruginosa in CF sputum and artificial sputum media (ASMi), the contribution of denitrification to P. aeruginosa fitness in oxic conditions has not been well described. Here, we show that P. aeruginosa requires dnr for fitness in ASMi, and the requirement for dnr is abolished when nitrate is excluded from the media. Additionally, we show that P. aeruginosa consumes nitrate in lysogeny broth (LB) under microoxic conditions. Furthermore, strains without a functioning quorum sensing regulator LasR, which leads to elevated Anr activity, consume nitrate in LB even in normoxia. There was no growth advantage for P. aeruginosa when nitrate was present at concentrations from 100 to 1,600 µM. However, P. aeruginosa consumption of nitrate in oxic conditions created a requirement for Dnr and Dnr-regulated NorCB, likely due to the need to detoxify nitric oxide. These studies suggest that Anr- and Dnr-regulated processes may impact P. aeruginosa physiology in many common culture conditions.IMPORTANCEPseudomonas aeruginosa is an opportunistic pathogen commonly isolated from low-oxygen environments such as the lungs of people with cystic fibrosis. While the importance of P. aeruginosa energy generation by denitrification is clear in anoxic environments, the effects of denitrification in oxic cultures are not well understood. Here, we show that nitrate is consumed in microoxic environments and, in some strains, in normoxic environments. While nitrate does not appear to stimulate microoxic growth rate or yield, it does impact physiology. We show that the regulators Anr (anaerobic regulation of arginine deiminase and nitrate reduction) and Dnr (dissimilative nitrate respiration regulator), which are best known for their roles in anoxic conditions, contribute to P. aeruginosa fitness in common laboratory media in the presence of oxygen.

Keywords: Anr; Dnr; Pseudomonas aeruginosa; denitrification; microoxia; nitrate; nitric oxide.


Conflict of interest statement

The authors declare no conflict of interest.

Figures

Fig 1
Fig 1
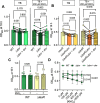
Contribution of Anr and Dnr to P. aeruginosa growth in media ± nitrate. (A) P. aeruginosa strain culture density of PA14 wild type (WT), the ∆anr mutant, and the ∆anr+anr strain after 16 h in LB at 21% and 1% O2 in a 96-well plate. (B) Levels of NO3 in LB, TB, a 0.5% yeast extract solution, and a 0.5% sodium chloride (NaCl) solution. The dotted line indicates the lower limit of detection (LOD). (C) WT, ∆anr, and ∆anr+anr culture density after 16 h of growth in TB (solid) or TB + 200 µM KNO3 (vertical stripes) at 1% O2. Each point represents an average of replicates from 1 day, and lines connect data from the same experiment. (D) The % decrease in growth of the ∆anr strain relative to WT in TB versus TB + 200 µM KNO3 in 96-well plates at 1% O2 for 16 h with shaking. (E) The levels of NO3 in LB before and after WT growth for 16 h at 21% and 1% O2. NO3 levels were calculated using a standard curve of KNO3 in water and normalized to OD600. The levels of nitrate in LB are the same as in panel B. (F) WT, the ∆dnr mutant, and the ∆dnr+dnr strain culture density after growth in LB (diagonal stripes) at 1% O2 for 16 h in a 96-well plate with shaking. P-values were calculated using a paired one-way analysis of variance (ANOVA) with multiple comparisons (A, C, and F) and an unpaired t-test (B, D, and E).
Fig 2
Fig 2
Contribution of Dnr to P. aeruginosa growth in concentrations of O2 that lead to nitrate consumption. (A) The levels of NO3 in LB before and after ∆lasR growth for 16 h at 21% and 1% O2. NO3 levels were normalized to OD600. The levels of nitrate in LB are the same as in Fig. 1B. (B) ∆lasR, the ∆lasRdnr mutant, and the ∆lasRdnr+dnr strain culture density after growth in LB (diagonal stripes) at 1% O2 for 16 h in a 96-well plate with shaking. (C) The % decrease in growth of the ∆dnr and ∆lasRdnr mutants relative to WT and ∆lasR parental strains in LB after 16 h of growth in 96-well plates in 21% or 1% O2. Data points represent an average of technical replicates, with lines showing comparisons of averages of data from the same day. P-values were calculated using paired one-way ANOVA with multiple comparisons (B) and a paired t-test (C).
Fig 3
Fig 3
Dnr contribution to microoxic growth and overall yield of P. aeruginosa in media ± nitrate. (A) WT, the ∆dnr mutant, and the ∆dnr+dnr strain culture density after growth in TB (solid) and TB + KNO3 (horizontal stripes) at 1% O2 for 16 h in a 96-well plate with shaking. (B) Culture densities of ∆lasR, a ∆lasRdnr mutant, and the ∆lasRdnr+dnr strain after 16 h of growth in TB (solid) and TB + 200 µM KNO3 (horizontal stripes) in 96-well plates at 1% O2. Each data point represents an average of replicates from 1 day, with lines connecting data from the same experiment. (C) Comparison of growth of WT and ∆lasR in TB (solid) and TB + 200 µM KNO3 (horizontal stripes) from panels A and B. (D) Comparison of OD600 of WT, ∆dnr, and ∆dnr+dnr in TB with 0, 100, 200, 400, and 1,600 µM KNO3 added after 16 h of growth in 1% O2. The area under the curve was calculated and used for dose-response analysis. P-values were calculated using a paired one-way ANOVA (A and B), a paired t-test (C), and a t-test comparison of area under the curve (D).
Fig 4
Fig 4
Dnr contribution to microoxic growth of P. aeruginosa in ASMi ± nitrate. (A) WT, the ∆dnr mutant, and the ∆dnr+dnr strain culture density after growth in ASMi − KNO3 (dots) and ASMi (vertical stripes) at 1% O2 for 16 h in a 96-well plate at 1% O2 with shaking. (B) The ∆lasR, ∆lasRdnr, and the ∆lasRdnr+dnr strain culture densities after growth in ASMi − KNO3 (dots) and ASMi (vertical stripes) for 16 h in a 96-well plate at 1% O2 with shaking. (C) Comparison of WT and ∆lasR culture densities after growth in ASMi without and with KNO3 for 16 h at 1% O2 from panels A and B. Each data point represents an average of replicates from 1 day, with lines connecting data from the same experiment. P-values were calculated using a paired one-way ANOVA with multiple comparisons (A and B), or a paired t-test (C).
Fig 5
Fig 5
Nitrate consumption of dnr and anr mutants, and growth comparison of P. aeruginosa WT and transposon mutants defective in denitrification at different nitrate concentrations. (A) The levels of NO3 in LB before and after WT, ∆dnr, ∆anr, and ∆anrdnr growth for 16 h at 1% O2. NO3 levels were normalized to OD600. Nitrate levels in LB are the same as in Fig. 1B, and nitrate levels in WT supernatants at 1% O2 are the same as in Fig. 1E. (B) Growth of WT, a ∆dnr mutant, and a ∆dnr+dnr strain in TB with indicated concentrations of KNO3 relative to growth in TB alone. Data in each cell represents the average of nine experiments. For statistical analyses, the relative growth of ∆dnr was compared to WT and ∆dnr+dnr at each concentration of KNO3 added. P-values were calculated using a paired one-way ANOVA with multiple comparisons. Only P-values of ∆dnr compared to WT are shown. (C) A visual representation of the Anr- and Dnr-regulated identification pathway. (D) Relative growth of WT and confirmed PA14 TnM mutants with insertions in specified genes, the ∆norC mutant, and the ∆norC+norC complemented strain. Colors represent growth at the specified [KNO3] divided by growth in TB without added KNO3. Cultures were grown in 96-well plates at 1% O2 for 16 h on a shaker. Data in each cell represents the average of 3–5 experiments. For statistical analyses, the relative growth of mutants was compared to WT at each concentration of KNO3 added. P-values were calculated using an ordinary one-way ANOVA with multiple comparisons. Only P-values <0.05 are shown.

Update of

References

    1. Worlitzsch D, Tarran R, Ulrich M, Schwab U, Cekici A, Meyer KC, Birrer P, Bellon G, Berger J, Weiss T, Botzenhart K, Yankaskas JR, Randell S, Boucher RC, Döring G. 2002. Effects of reduced mucus oxygen concentration in airway Pseudomonas infections of cystic fibrosis patients. J Clin Invest 109:317–325. doi: 10.1172/JCI0213870 - DOI - PMC - PubMed
    1. Werner E, Roe F, Bugnicourt A, Franklin MJ, Heydorn A, Molin S, Pitts B, Stewart PS. 2004. Stratified growth in Pseudomonas aeruginosa biofilms. Appl Environ Microbiol 70:6188–6196. doi: 10.1128/AEM.70.10.6188-6196.2004 - DOI - PMC - PubMed
    1. Folsom JP, Richards L, Pitts B, Roe F, Ehrlich GD, Parker A, Mazurie A, Stewart PS. 2010. Physiology of Pseudomonas aeruginosa in biofilms as revealed by transcriptome analysis. BMC Microbiol 10:294. doi: 10.1186/1471-2180-10-294 - DOI - PMC - PubMed
    1. Galimand M, Gamper M, Zimmermann A, Haas D. 1991. Positive FNR-like control of anaerobic arginine degradation and nitrate respiration in Pseudomonas aeruginosa. J Bacteriol 173:1598–1606. doi: 10.1128/jb.173.5.1598-1606.1991 - DOI - PMC - PubMed
    1. Sawers RG. 1991. Identification and molecular characterization of a transcriptional regulator from Pseudomonas aeruginosa PAO1 exhibiting structural and functional similarity to the FNR protein of Escherichia coli. Mol Microbiol 5:1469–1481. doi: 10.1111/j.1365-2958.1991.tb00793.x - DOI - PubMed

MeSH terms

LinkOut - more resources