. 2025 Sep 1;224(9):e202411175.
doi: 10.1083/jcb.202411175. Epub 2025 Aug 7.

Evolutionarily diverse caveolins share a common structural framework built around amphipathic disks

Affiliations

Evolutionarily diverse caveolins share a common structural framework built around amphipathic disks

Bing Han et al. J Cell Biol. .

Abstract

Caveolins are a unique family of membrane remodeling proteins present broadly across animals (Metazoa), and in vertebrates form flask-shaped invaginations known as caveolae. While human caveolin-1 assembles into an amphipathic disk composed of 11 spirally packed protomers, the structural basis underlying caveolin function across animals remains elusive. Here, we predicted structures for 73 caveolins spanning animal diversity, as well as a newly identified choanoflagellate caveolin from Salpingoeca rosetta. This analysis revealed seven conserved structural elements and a propensity to assemble into amphipathic disks. Cryo-EM structures of caveolins from S. rosetta choanoflagellate and the purple sea urchin Strongylocentrotus purpuratus exhibit striking structural similarities to human caveolin-1, validating the structural predictions. Lastly, tracing the chromosomal evolutionary history of caveolins revealed its parahoxozoan ancestral chromosome and evolutionary branches on which caveolins translocated and expanded. These results show that caveolins possess an ancient structural framework predating Metazoa and provide a new structural paradigm to explore the molecular basis of caveolin function across diverse evolutionary lineages.


Conflict of interest statement

Disclosures: The authors declare no competing interests exist.

Figures

Figure 1.
Figure 1.
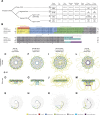
Chromosomal origins of caveolin. (A) Samples across animal diversity and in two unicellular relatives of animals were used to determine the ALG identities of chromosomes on which caveolins were present. (B) Caveolins are present on BCnS ALG Eb-bearing chromosomes in all but two species observed within the Parahoxozoa. In sponges, caveolins are present on ALG N in species from two anciently diverged sponge clades. The BCnS ALG identity of S. rosetta chromosome 10, on which caveolin is present, does not have a significant ALG identity. (C–E) Possible models for the chromosomal origins of caveolin. (C and D) Assuming that caveolin was present in the choanozoan ancestor, it must have been lost in the ctenophore lineage. Caveolin’s chromosomal provenance is parsimoniously equally likely to have been ALG N, followed by translocation to ALG Eb in the parahoxozoan ancestor (C), or ALG Eb in the ancestral myriazoan genome, followed by translocation to ALG N in the common ancestor of Demospongiae and Homoscleromorpha sponges. (E) Another potential explanation of caveolin’s provenance that accounts for its presence in both animals and choanoflagellates is HGT. This could have occurred in either direction after acquisition of the gene (i.e., from choanoflagellates to animals, or from animals to choanoflagellates). BCnS, bilaterian–cnidarian–sponge; HGT, horizontal gene transfer.
Figure S1.
Figure S1.
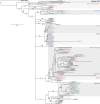
Phylogenetic relationships of caveolin sequences inferred from a maximum-likelihood phylogeny. A maximum-likelihood phylogeny was inferred for representative caveolins from the current study (black) in combination with caveolin sequences previously analyzed by Kirkham et al. (2008). Previously analyzed caveolins are color-coded according to their classifications. Rooting was performed under the assumption that the choanoflagellate sequence constitutes an outgroup. Support values (percent replication in 1,000 rapid bootstrap pseudoreplicates) are shown for the major splits. Branch lengths are proportional to the average number of substitutions per site (refer to scale). Splits denoting the higher order relationship between the apparent Prot. G2, CAV3, CAV1, CAVY (ext.), Prot. G3, and CAV2/2R clades received extremely low bootstrap support and are therefore represented by a polytomy in the final tree. The asterisk, *, indicates a caveolin-related protein from S. rosetta.
Figure S2.
Figure S2.
Phylogenetic relationships of caveolin sequences inferred from an unrooted Bayesian tree. An unrooted Bayesian tree inferred from the alignment used for the tree in Fig. S1. No columns were removed from the alignment using GUIDANCE. Posterior probabilities are shown next to their respective nodes. Sequences are colored in the same manner as in Fig. S1. The asterisk, *, indicates a caveolin-related protein from S. rosetta.
Figure 2.
Figure 2.
Conserved structural features of metazoan and choanoflagellate caveolins highlighted by computational modeling predictions. AF2.2 models for 11-mer caveolins from representative species of Choanoflagellatea and 14 different metazoan phyla/superphyla. Models in top three rows are in ribbon mode and colored by pLDDT confidence values. Models in bottom three rows are in surface mode and colored by lipophilicity values. To better demonstrate the distribution pattern of hydrophobicity in surface mode, we applied transparency to the N terminus of F2U793, A0A1X7UHP5, A0A7M7R2L2, Q18879, and the residues near the C terminus of A0A267DC90.
Figure 3.
Figure 3.
Proposed structural elements of caveolins. (A–D) Structural elements include a N-terminal variable region (yellow), pin motif (red), hook region (blue), scaffolding domain (green), spoke region (gray), β-strand (cyan), and C-terminal variable region (purple). For illustration purposes, elements are mapped onto the structures of (A) two neighboring protomers from the cryo-EM–based secondary structure model of the human Cav1 8S complex (PDB: 7SC0), (B) two neighboring protomers from the 11-mer of human Cav1 (Q03135) predicted by AF2.2, and (C) two neighboring protomers from the 11-mer of C. elegans caveolin (Q94051) predicted by AF2.2. (D) Comparison between the previous domain designations and our proposed segmentation using structural elements can be observed in both panel (A) and sequence alignments of human Cav1 and C. elegans caveolin Q94051.
Figure 4.
Figure 4.
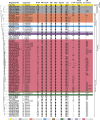
Summary of the structural features of caveolins suggested by computational modeling predictions. Phylogenetic tree shown on the left-hand side of the table is based on Fig. S1 A. N-VR, N terminus variable region; PM, pin motif; Hook, hook structure; SM, signature motif; CSD, caveolin scaffolding domain; Spoke, spoke region; C-β, C-terminal β-strand; C-VR, C terminus variable region; Pack spirally, whether the protein sequence is predicted to be assembled into a disk-shaped oligomer; CR, charged residues on the hydrophobic (bottom) side of complexes (“+” represents a positive charge, “−” represents a negative charge, and uppercase English letters represent the corresponding amino acid residue abbreviations). Structural features were summarized mainly based on AF2.2 predicted 11-mers unless otherwise noted in the upper right corner of particular features. ●, structural feature was predicted to be present; , structural feature was predicted to be partially present; ○, structural feature was not predicted to be present. NA, not applicable (corresponding sequences were either missing or shifted due to sequence missing). *, A0A1X7VPY7 was not predicted by AF2.2 to form any homologous disk-like or ring-like complexes. However, it was predicted to form a hybrid complex structure with A0A1X7VRV8. The structural features listed for A0A1X7VPY7 are summarized from the model of the hybrid complex consisting of A0A1X7VPY7 (1 copy) and A0A1X7VRV8 (10 copies).
Figure 5.
Figure 5.
Predicted structural features of representative metazoan and non-metazoan caveolins. (A) Model summarizing the key structural similarities and difference in different groups of caveolins based on the phylogenetic analysis and structural comparisons presented in Fig. 4 and Data S3. The number of + symbols in each cell represents the frequency of occurrence of a specific structural unit in the caveolins of the corresponding clade. The number in parentheses indicates the average number of amino acids constituting the structural unit within the caveolin clades (rounded to the nearest integer). For Type I-CAV caveolins where the C-terminal β-strand is predicted to be discontinuous in two segments, the average is calculated separately for caveolins with a single C-terminal β-strand and for those with two segments. The results are separated by a comma for the two types of C-terminal β-strands, and the averages for the two segments are separated by a forward slash. (B) Sequence alignment of representative caveolins. Conserved residues are highlighted, with darker intensities corresponding to higher percent identity. Structural features are colored as follows: N-terminal variable region (yellow), pin motif (red), hook region (blue), scaffolding domain (green), spoke region (gray), β-strand (cyan), and C-terminal variable region (purple). (C–N) Different views of AF2.2 models of representative caveolins. (C–E) Human Cav1 (Type II-CAV, Q03135). (F–H)S. purpuratus (Type I-CAV, A0A7M7T4C2). (I–K)A. queenslandica (Atypical-CAV, A0A1X7UHP5). (L–N)S. rosetta (Choa-CAV, F2U793). In C-N, structural features are colored as in panel B. To better display the structure of a single protomer within the complex, the other 10 protomers in the models in panels E, H, K, and N have been made transparent.
Figure S3.
Figure S3.
Electrostatic potential distribution patterns on the proposed lipid bilayer-facing surface of the computationally modeled caveolin oligomers. (A–H) Examples of different patterns of charged residues on the proposed membrane-facing surface are shown for representative caveolin oligomers predicted by AF2.2. They include (A) completely neutral surface; (B and C) a negatively charged ring contributed by a single Glu or a single aspartic acid (Asp) located in the middle of the spoke region; (D) a negatively charged ring contributed by a single Glu located near the C-terminal region of the spoke region; (E) two negatively charged rings contributed by a Glu or Asp in the middle of the spoke region; (F) a single negatively charged ring contributed by a Glu and an Asp in the middle of the spoke region, (G) a positively charged ring contributed by a lysine (Lys) in the middle of the spoke region, and (H) a positively charged ring contributed by a Lys near the C-terminal region of the spoke region. The percentage of caveolin complexes exhibiting each pattern is listed below each model (from a total of 74 caveolins investigated); Glu, glutamic acid; Asp, aspartic acid.
Figure S4.
Figure S4.
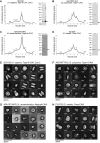
FPLC traces, western blots of caveolin purifications, and negative stain EM averages of caveolin complexes. (A–D) Indicated caveolin proteins were purified from E. coli membranes and applied to a Superose 6 10/300 Gl column. Elution profiles and western blotting results are shown for (A) human Cav1 (Type II-CAV, Q03135), (B) S. purpuratus caveolin (Type I-CAV, A0A7M7T4C2), (C) A. queenslandica caveolin (Atypical-CAV, A0A1X7UHP5), and (D) S. rosetta caveolin (Choa-CAV, F2U793). The position of the void and shoulders corresponding to various peaks (P1–P4) is indicated on each FPLC trace. Arrows on the western blots point to the expected position for monomers for each of the caveolins based on their predicted molecular weight. (E–H) Negative stain 2D class averages of human Cav1 (E), S. purpuratus caveolin (F), A. queenslandica caveolin (G), and S. rosetta caveolin (H). Classes denoted with # are shown in Fig. 6. The number of particles found in each class average is shown in the bottom left. Scale bar, 30 nm. The classes of smaller particles represent a membrane chaperone complex that is a structured protein contaminant in the purifications. For the case of A. queenslandica caveolin, the majority of 2D classes consist of these contaminant proteins. Consequently, only one class is marked as the caveolin complex. FPLC, fast protein liquid chromatography. Source data are available for this figure: SourceData FS4.
Figure 6.
Figure 6.
Negative stain EM shows diverse caveolins assemble into disk-shaped complexes. (A) H. sapiens Cav1, (B)S. purpuratus caveolin, (C)A. queenslandica caveolin, and (D)S. rosetta caveolin. In each panel, surface-filling models for the cryo-EM structure or AF2.2 11-mer structures are shown on the left, representative images of negatively stained caveolin complexes are shown in the middle, and representative 2D averages of caveolins are shown on the right. The number of particles found in each class average is shown in the bottom right. Scale bar, 30 nm. (E) Western blot of Blue native gel with bracket marking the position of 8S-like complexes. Molecular weight markers are indicated. Source data are available for this figure: SourceData F6.
Figure 7.
Figure 7.
S. purpuratus caveolin forms an 11-mer complex. (A–C) 3.1 Å resolution cryo-EM density map of the S. purpuratus caveolin complex with 11-fold symmetry. The complex is shown with ninety-degree rotated views displaying the cytoplasmic-facing surface (A), side (B), and membrane-facing surface (C). The complex has an overall disklike structure with 11 spiraling α-helices and a central β-barrel. A single protomer is highlighted in yellow. Scale bar, 20 Å. (D–F) Secondary structure model of the S. purpuratus caveolin in the same views as shown in panels A–C. (G and H) Secondary structure of S. purpuratus caveolin protomer with secondary features and N and C termini noted. (I) Central slice of the density map (purple) with the detergent micelle (gray). (J and K) AF2.2-predicted structure of the S. purpuratus caveolin 11-mer showing views of the cytoplasmic-facing surface (J) and side view (K). Structured regions predicted by AF2.2 that are not found in the cryo-EM structure are highlighted in burgundy. (L) Protomer from the AF2.2 11-mer model fit into the cryo-EM density map (gray outline) of a protomer.
Figure S5.
Figure S5.
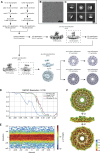
Flowchart of cryo-EM processing steps for the S. purpuratus caveolin complex. (A) Flowchart representing the classification and analysis of S. purpuratus caveolin complex micrographs. Two independently collected datasets were combined following preprocessing, particle picking, and initial 2D classification. Ab initio reconstructions that were used for further processing are noted with dashed boxes. Ab initio reconstruction used as an input for nonuniform refinement is shown in light blue in an en face view and rotated 90° around the x axis. Nonuniform and local refinements with no symmetry applied (C1) and 11-fold symmetry applied (C11) of the S. purpuratus caveolin complex are shown in lavender in an en face view. (B) Representative micrograph of the S. purpuratus caveolin complex. Scale bar, 50 nm. (C) Representative S. purpuratus caveolin complex 2D classes. Box size, 352 pix2 (390.7 × 390.7 Å). Scale bar, 100 Å. (D) GS-FSC of C11 refinement with no mask (blue line), loose mask (green line), tight mask (red line), and corrected mask (purple). Blue horizontal line, FSC = 0.143. (E) Euler angle plot of angles of particle distribution for the C11 reconstruction of the S. purpuratus caveolin complex. (F) Heat map of local resolution of C11 3D reconstruction, rotated around the x axis. GS-FSC, gold-standard Fourier shell correlation; FSC, Fourier shell correlation.
Figure 8.
Figure 8.
S. rosetta caveolin forms an 11-mer complex with an elongated β-barrel and extended N-terminal region. (A–C) 2.9 Å resolution cryo-EM density of the S. rosetta caveolin complex with 11-fold symmetry. The complex is shown with ninety-degree rotated views displaying the cytoplasmic-facing surface (A), side (B), and membrane-facing surface (C). The complex has an overall disklike structure with 11 spiraling α-helices, a central elongated β-barrel, and extended N-terminal region. A single protomer is highlighted in orange. Scale bar, 20 Å. (D–F) Secondary structure model of the S. rosetta caveolin complex in the same views as shown in panels A–C. (G and H) Secondary structure of S. rosetta caveolin protomer with secondary features and N and C termini noted. (I) Central slice of the density map (green) with the detergent micelle (gray). (J and K) AF2.2-predicted structure of the S. rosetta caveolin 11-mer showing views of the cytoplasmic-facing surface (J) and side view (K). Structured regions predicted by AF2.2 that are not found in the cryo-EM structure are highlighted in burgundy. (L) Protomer from the AF2.2 11-mer model fit into the cryo-EM density map (gray outline) of a protomer.
Figure S6.
Figure S6.
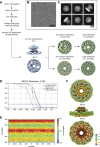
Flowchart of cryo-EM processing steps for the S. rosetta caveolin complex. (A) Flowchart depicting the classification and analysis of S. rosetta caveolin complex micrographs. Ab initio reconstruction used as an input for nonuniform refinement is shown in light blue in an en face view and rotated 90° around the x axis. Nonuniform and local refinements with no symmetry applied (C1) and 11-fold symmetry applied (C11) of the S. rosetta caveolin complex are shown in green in an en face view. (B) Representative micrograph of the S. rosetta caveolin complex. Scale bar, 50 nm. (C) Representative S. rosetta caveolin complex 2D classes. Box size, 300 pix2 (261 × 261 Å). Scale bar, 100 Å. (D) GS-FSC of C11 refinement with no mask (blue line), loose mask (green line), tight mask (red line), and corrected mask (purple). Blue horizontal line, FSC = 0.143. (E) Euler angle plot of angles of particle distribution for the C11 reconstruction of the S. rosetta caveolin complex. (F) Heat map of local resolution of C11 3D reconstruction, rotated around the x axis. GS-FSC, gold-standard Fourier shell correlation; FSC, Fourier shell correlation.
Figure 9.
Figure 9.
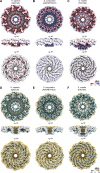
Comparison of cryo-EM structures for H. sapiens, S. rosetta, and S. purpuratus caveolin complexes. (A, B, D, E, G, and H) Cytoplasmic-facing surface and side views of cryo-EM structures are shown for human Cav1 (A and B), S. purpuratus caveolin (D and E), and S. rosetta caveolin (G and H). (C, F, and I) Protomer structures extracted from the 11-mers are shown in same views as the panel above. Domains are colored as follows: N-terminal variable region (yellow), PM (red), HS (blue), SD (green), SR (gray), β-strand (cyan). NT, N terminus; CT, C terminus; PM, pin motif; HS, hook structure; SD, scaffolding domain; SR, spoke region.
Figure S7.
Figure S7.
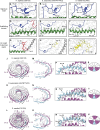
Comparison of the signature motif, scaffolding domain, pin motif/N-terminal region, and protomer interfaces for H. sapiens, S. rosetta, and S. purpuratus caveolins. (A–I) Detailed view of the signature motifs (A–C) (blue), scaffolding domains (D–F) (green), and pin motif (G) (red) or N-terminal variable regions (H and I) (yellow) of the human Cav1, S. rosetta caveolin, and S. purpuratus caveolin complexes. One protomer is colored according to the structural elements as described in Fig. 2, while other protomers of the complex are depicted in transparent gray. The first and last residues of the motifs are labeled, and any residues that are absolutely conserved between the three caveolins are labeled and marked with an asterisk. (J–L) Overall structure of caveolin complexes highlighting one protomer, i, in light blue and its interacting protomers in magenta. The interacting protomers are labeled i −2 to i + 2 for the caveolin complexes with the S. rosetta caveolin complex also exhibiting interactions at protomers i −5 and i + 5. (M–O) Packing of two protomers with secondary structure elements labeled. (P–R) Zoomed-in view of membrane-facing residues indicated by a dashed box on overall caveolin structures in J–L. Complexes are rotated −160° around the x axis from J–L to show the membrane-facing surface. Membrane-interacting residues of interest are noted. (S–U) Cartoon depiction of caveolin complexes to illustrate the organization of interacting protomers. Color and labeling scheme remain the same as (J–L).
Figure S8.
Figure S8.
Distribution of charged residues and hydrophobicity of the predicted membrane- and cytoplasmic-facing surfaces of H. sapiens, S. rosetta, and S. purpuratus caveolin complexes. (A–F) Space-filling models of the caveolin complexes rotated 90°, showing (A–C) the charge of the amino acids or (D–F) hydrophobicity values. Note that side views in A–C are shown with the surface of the complex, whereas a cut through the center of the complex is shown in D–F.
Figure 10.
Figure 10.
S. purpuratus caveolin displays various curvatures in 2D classes and 3DVA. (A–C) S. purpuratus caveolin 2D class averages that show a flat (A), concave (B), and convex (C) curvature of the complex. Scale bar, 100 Å. (D) Difference in curvature is highlighted with overlaid traces of the membrane-facing surface from 2D class averages. (E) Structures representing the negative and positive values along the reaction coordinate of a 3DVA component calculated with a resolution limit of 8 Å. The complex on the left (orange) shows a concave membrane surface curvature, while the complex on the right (light blue) shows a flat membrane surface curvature and “lifting” of the β-barrel above the rim of the complex. The proposed membrane-facing surface is shown (top), rotated 90° around the x axis to show a side view (middle), and rotated an additional 45° to show a view of the predicted cytoplasmic-facing surface (bottom).

References

    1. Abramson, J., Adler J., Dunger J., Evans R., Green T., Pritzel A., Ronneberger O., Willmore L., Ballard A.J., Bambrick J., et al. 2024. Accurate structure prediction of biomolecular interactions with AlphaFold 3. Nature. 630:493–500. 10.1038/s41586-024-07487-w - DOI - PMC - PubMed
    1. Altschul, S.F., Madden T.L., Schäffer A.A., Zhang J., Zhang Z., Miller W., and Lipman D.J.. 1997. Gapped BLAST and PSI-BLAST: A new generation of protein database search programs. Nucleic Acids Res. 25:3389–3402. 10.1093/nar/25.17.3389 - DOI - PMC - PubMed
    1. Ariotti, N., and Parton R.G.. 2013. SnapShot: Caveolae, caveolins, and cavins. Cell. 154:704–704.e1. 10.1016/j.cell.2013.07.009 - DOI - PubMed
    1. Attwood, M.M., Krishnan A., Almén M.S., and Schiöth H.B.. 2017. Highly diversified expansions shaped the evolution of membrane bound proteins in metazoans. Sci. Rep. 7:12387. 10.1038/s41598-017-11543-z - DOI - PMC - PubMed
    1. Bastiani, M., and Parton R.G.. 2010. Caveolae at a glance. J. Cell Sci. 123:3831–3836. 10.1242/jcs.070102 - DOI - PubMed

LinkOut - more resources