. 2025 Aug 7;25(1):281.
doi: 10.1007/s10238-025-01819-4.

Association of non-traditional lipid indices with diabetes and insulin resistance in US adults: mediating effects of HOMA-IR and evidence from a national cohort

Affiliations

Association of non-traditional lipid indices with diabetes and insulin resistance in US adults: mediating effects of HOMA-IR and evidence from a national cohort

Kai Wang et al. Clin Exp Med. .

Abstract

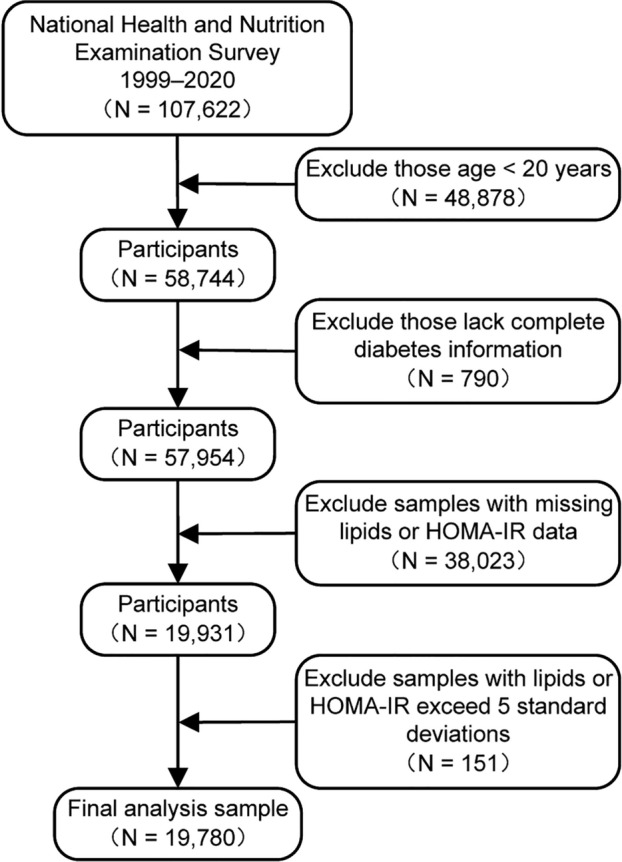
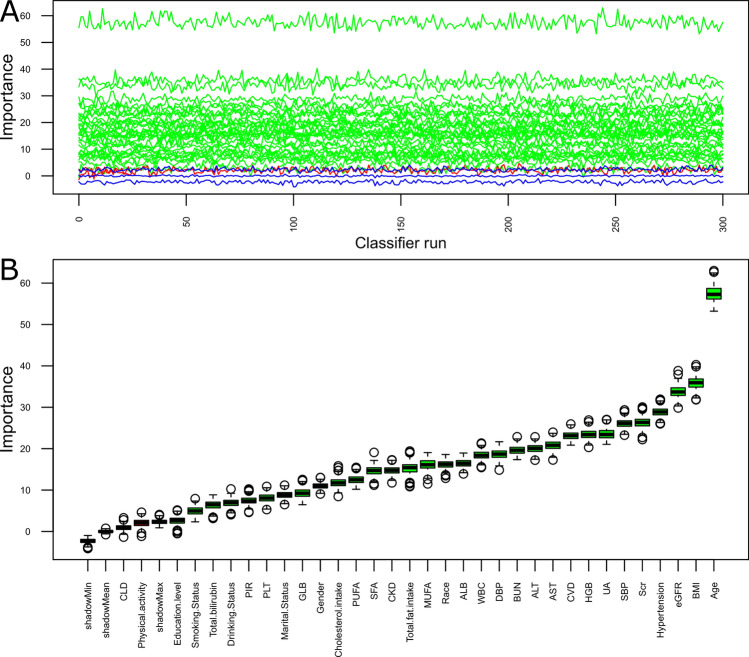
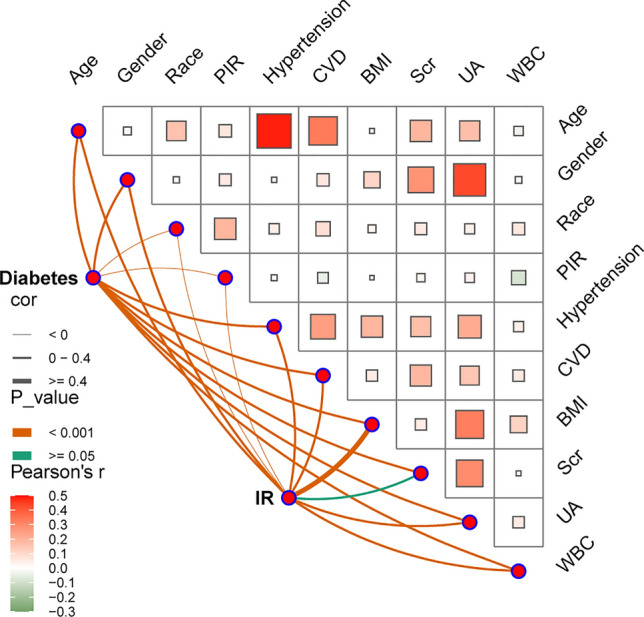
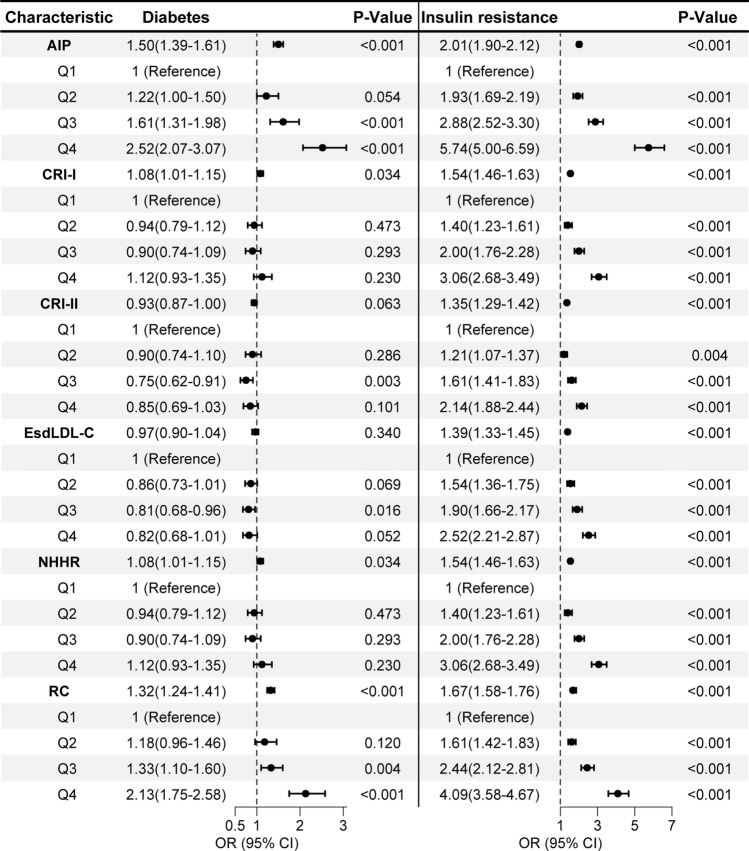
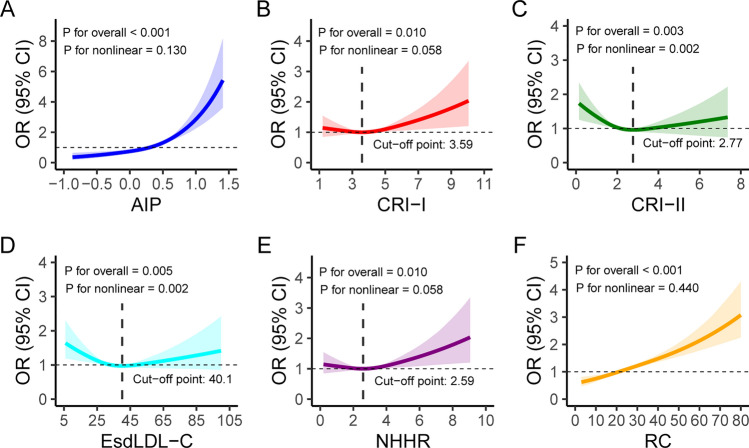
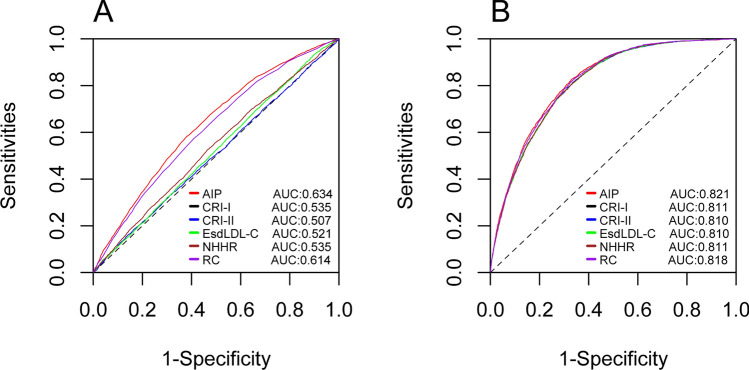
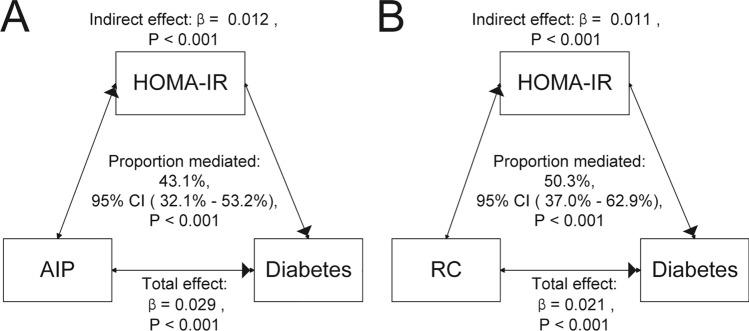
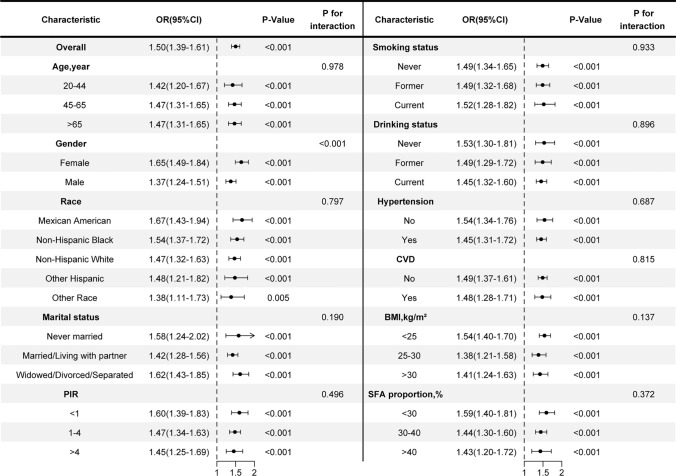
Dyslipidemia, diabetes mellitus, and insulin resistance (IR) are intricately linked. In recent years, a series of novel lipid indices have emerged. Investigating their correlation with diabetes and IR is critical for early intervention. This study analyzed 19,780 National Health and Nutrition Examination Survey (NHANES) participants (1999-2020), examining the atherogenic index of plasma (AIP), Castelli risk index I (CRI-I) and II (CRI-II), estimated small dense LDL cholesterol (EsdLDL-C), non-HDL cholesterol-to-HDL cholesterol ratio (NHHR), and remnant cholesterol (RC). Covariates were selected via Boruta and LASSO regression. Multivariate logistic regression, restricted cubic splines, ROC, subgroup, and mediation analyses were employed, validated by sensitivity analyses. The prevalence of diabetes was 15.0%. After adjustment, four indices (excluding CRI-II and EsdLDL-C) were associated with diabetes. For Q4 vs Q1, AIP and RC showed significantly elevated risk (OR: 2.52 [2.07-3.07] and 2.13 [1.75-2.58], respectively). Regarding IR, all indices exhibited dose-dependent associations, with AIP (OR: 5.74 [5.00-6.59]) and RC (4.09 [3.58-4.67]) showing the strongest links. For diabetes diagnosis, AIP (AUC: 0.824) and RC (0.822) outperformed other lipid indices (cutoffs: 0.31, 31.0) but were less effective than fasting glucose and HbA1c. For IR, AIP (AUC: 0.837) and RC (0.830) remained superior among lipid indices and showed no significant diagnostic disadvantage vs IR-related indicators. Subgroup analyses indicated stronger AIP/RC-diabetes/IR associations in females. Mediation analyses showed HOMA-IR mediated 43.1% and 50.3% of AIP/RC-diabetes associations, more pronounced in older adults (> 65 years), males and those with BMI ≥ 25 kg/m2, while fatty acid intake did not affect these mediators. All six indices correlate with IR, but only AIP and RC strongly associate with diabetes, mediated by HOMA-IR. Females show enhanced AIP/RC-diabetes links, while older, male, and overweight groups exhibit greater HOMA-IR mediation. And AIP or RC's diagnostic performance for IR is not inferior to other IR assessment indices. Thus, AIP and RC are prioritized biomarkers for diabetes and IR monitoring.

Keywords: AIP; CRI-I; CRI-II; Diabetes; EsdLDL-C; HOMA-IR; NHHR; RC.


Conflict of interest statement

Declarations. Conflict of interest: The authors declare no competing interests. Ethical approval: The Ethics Review Board of the National Center for Health Statistics has undertaken a review and provided approval for the NHANES ethical policies to guarantee participants' voluntary informed consent. Consent for publication: Not applicable.

Figures

Fig. 1
Fig. 1
Flowchart of the study participants. Abbreviations HOMA-IR: homeostatic model assessment of insulin resistance
Fig. 2
Fig. 2
Boruta algorithm-based feature selection for diabetes-related covariates. A Iterative selection process curve for diabetes-related covariates; B Boxplot of feature importance scores for diabetes-related covariates. The Boruta algorithm, through iterative comparison of original feature importance scores with those of randomly shuffled 'shadow features', identifies three types of covariates: significantly important (shown in green), insignificant (shown in red), and those with indeterminate importance (shown in yellow). The shadow features are displayed in blue. Higher importance scores denote that the covariates are more strongly associated with the target variable. Abbreviations PIR: poverty income ratio; CVD: cardiovascular disease; CLD: chronic lung disease; CKD: chronic kidney disease; BMI: body mass index; SBP: systolic blood pressure; DBP: diastolic blood pressure; ALB: albumin; GLB: globulin; ALT: alanine aminotransferase; AST: aspartate aminotransferase; UA: uric acid; BUN: blood urea nitrogen; Scr: serum creatinine; eGFR: estimated glomerular filtration rate; WBC: white blood cell; HGB: hemoglobin; PLT: platelet; SFA: saturated fatty acid; MUFA: monounsaturated fatty acid; PUFA: polyunsaturated fatty acid
Fig. 3
Fig. 3
Network heatmap analysis of covariates associated with diabetes and insulin resistance. The right panel presents a correlation heatmap of the covariates. The color intensity represents the strength of Pearson's correlation coefficient (Pearson’s r), where red denotes positive correlations (ranging from 0 to 0.5) and green indicates negative correlations (ranging from − 0.3 to 0). A deeper color gradient reflects a stronger correlation. The left panel presents a directed network analysis focusing on diabetes and insulin resistance. The line width reflects the strength of associations between variables, quantified by correlation coefficient (cor), and the line color denotes different significance levels. Abbreviations IR: insulin resistance; PIR: poverty income ratio; CVD: cardiovascular disease; BMI: body mass index; Scr: serum creatinine; UA: uric acid; WBC: white blood cell
Fig. 4
Fig. 4
Associations of lipid indices with diabetes and insulin resistance. All models were adjusted for age, gender, race, PIR, hypertension, CVD, BMI, Scr, UA and WBC. Continuous variables were standardized using z-scores (mean = 0, SD = 1). Abbreviation AIP: atherogenic index of plasma; CRI-I: Castelli risk index I; CRI-II: Castelli risk index II; EsdLDL-C: estimated small dense low-density lipoprotein cholesterol; NHHR: non-high-density lipoprotein cholesterol-to-high-density lipoprotein cholesterol ratio; RC: remnant cholesterol; PIR: poverty income ratio; CVD: cardiovascular disease; BMI: body mass index; Scr: serum creatinine; UA: uric acid; WBC: white blood cell; OR: odds ratio; CI: confidence interval; Q: quartile; SD: standard deviation
Fig. 5
Fig. 5
Restricted cubic splines for the associations between lipid indices and diabetes. A Linear association of AIP with diabetes; B Linear association of CRI-I with diabetes; C Nonlinear association of CRI-II with diabetes; D Nonlinear association of EsdLDL-C with diabetes; E Linear association of NHHR with diabetes; F Linear association of RC with diabetes. All models were adjusted for age, gender, race, PIR, hypertension, CVD, BMI, Scr, UA and WBC. Abbreviation OR: odds ratio; CI: confidence interval; AIP: atherogenic index of plasma; CRI-I: Castelli risk index I; CRI-II: Castelli risk index II; EsdLDL-C: estimated small dense low-density lipoprotein cholesterol; NHHR: non-high-density lipoprotein cholesterol-to-high-density lipoprotein cholesterol ratio; RC: remnant cholesterol; PIR: poverty income ratio; CVD: cardiovascular disease; BMI: body mass index; Scr: serum creatinine; UA: uric acid; WBC: white blood cell
Fig. 6
Fig. 6
ROC curves of lipid indices with diabetes. A ROC curves of lipid indices with diabetes without any adjustment; B ROC curves of lipid indices with diabetes, were adjusted for age, gender, race, PIR, hypertension, CVD, BMI, Scr, UA and WBC. Abbreviations ROC: receiver operating characteristic; AIP: atherogenic index of plasma; CRI-I: Castelli risk index I; CRI-II: Castelli risk index II; EsdLDL-C: estimated small dense low-density lipoprotein cholesterol; NHHR: non-high-density lipoprotein cholesterol-to-high-density lipoprotein cholesterol ratio; RC: remnant cholesterol; PIR: poverty income ratio; CVD: cardiovascular disease; BMI: body mass index; Scr: serum creatinine; UA: uric acid; WBC: white blood cell; AUC: area under the ROC curve
Fig. 7
Fig. 7
Mediation effects of HOMA-IR scores on the association between AIP/RC and diabetes. A Proportion of the association between AIP and diabetes mediated by HOMA-IR; B Proportion of the association between RC and diabetes mediated by HOMA-IR. All models were adjusted for age, gender, race, PIR, hypertension, CVD, BMI, Scr, UA and WBC. Abbreviations HOMA-IR: homeostatic model assessment of insulin resistance; AIP: atherogenic index of plasma; RC: remnant cholesterol; PIR: poverty income ratio; CVD: cardiovascular disease; BMI: body mass index; Scr: serum creatinine; UA: uric acid; WBC: white blood cell; CI: confidence interval
Fig. 8
Fig. 8
Subgroup analysis of the association between AIP and diabetes. All models were adjusted for age, gender, race, PIR, hypertension, CVD, BMI, Scr, UA and WBC. Continuous AIP variable was standardized using z-scores (mean = 0, SD = 1). Abbreviations AIP: atherogenic index of plasma; OR: odds ratio; CI: confidence interval; PIR: poverty income ratio; CVD: cardiovascular disease; BMI: body mass index; Scr: serum creatinine; UA: uric acid; WBC: white blood cell; SD: standard deviation
Fig. 9
Fig. 9
Subgroup analysis of the association between RC and diabetes. All models were adjusted for age, gender, race, PIR, hypertension, CVD, BMI, Scr, UA and WBC. Continuous RC variable was standardized using z-scores (mean = 0, SD = 1). Abbreviations RC: remnant cholesterol; OR: odds ratio; CI: confidence interval; PIR: poverty income ratio; CVD: cardiovascular disease; BMI: body mass index; Scr: serum creatinine; UA: uric acid; WBC: white blood cell; SD: standard deviation

Similar articles

References

    1. Ferrari AJ, Santomauro DF, Aali A, Abate YH, Abbafati C, Abbastabar H, et al. Global incidence, prevalence, years lived with disability (YLDs), disability-adjusted life-years (DALYs), and healthy life expectancy (HALE) for 371 diseases and injuries in 204 countries and territories and 811 subnational locations, 1990–2021: a systematic analysis for the global burden of disease study 2021. Lancet. 2024;403:2133–61. - PMC - PubMed
    1. Sun H, Saeedi P, Karuranga S, Pinkepank M, Ogurtsova K, Duncan BB, et al. IDF diabetes atlas: Global, regional and country-level diabetes prevalence estimates for 2021 and projections for 2045. Diabetes Res Clin Pract. 2022;183: 109119. - PMC - PubMed
    1. Vekic J, Stromsnes K, Mazzalai S, Zeljkovic A, Rizzo M, Gambini J. Oxidative stress, atherogenic dyslipidemia, and cardiovascular risk. Biomedicines. 2023;11:2897. - PMC - PubMed
    1. Ginsberg HN, Huang L-S. The insulin resistance syndrome: impact on lipoprotein metabolism and atherothrombosis. Eur J Cardiovasc Risk. 2000;7:325–31. - PubMed
    1. Vergès B. Abnormal hepatic apolipoprotein B metabolism in type 2 diabetes. Atherosclerosis. 2010;211:353–60. - PubMed

LinkOut - more resources