

Prognostic and immunotherapeutic response prediction in hepatocellular carcinoma: role of non-histone acetylation/deacetylation scoring
- PMID: 40773148
- PMCID: PMC12332175
- DOI: 10.1007/s12672-025-03339-9
Prognostic and immunotherapeutic response prediction in hepatocellular carcinoma: role of non-histone acetylation/deacetylation scoring
Abstract
Background: Post-translational modification is crucial, with acetylation and deacetylation enzymes playing important roles. Their roles in liver cancer, however, remain unclear.
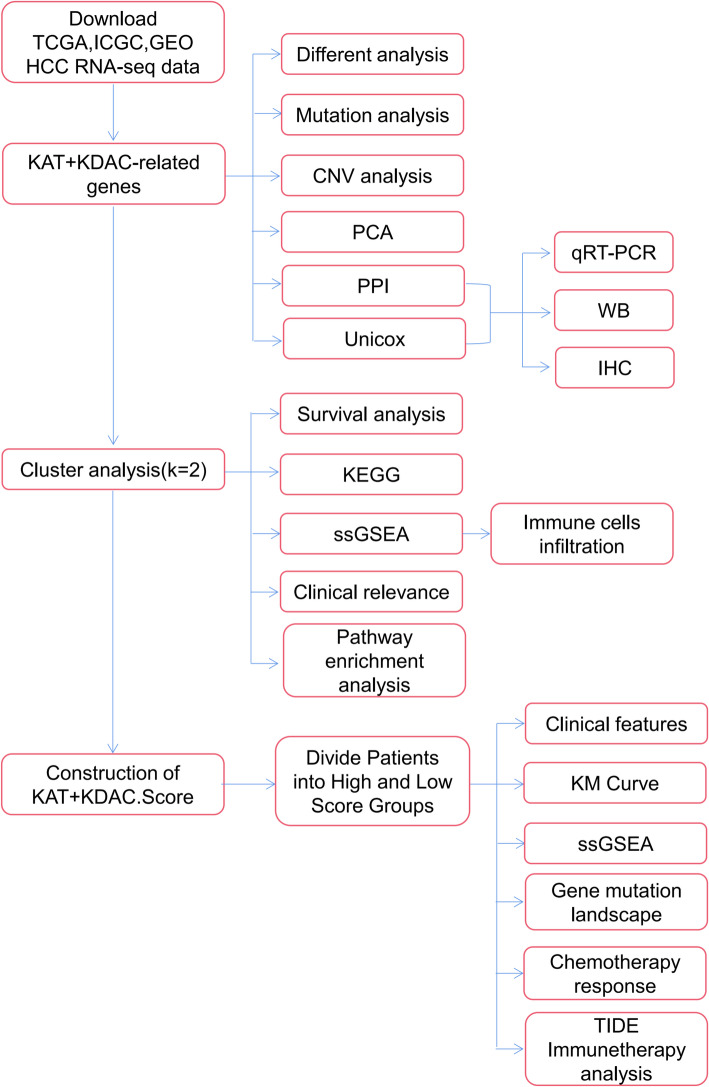
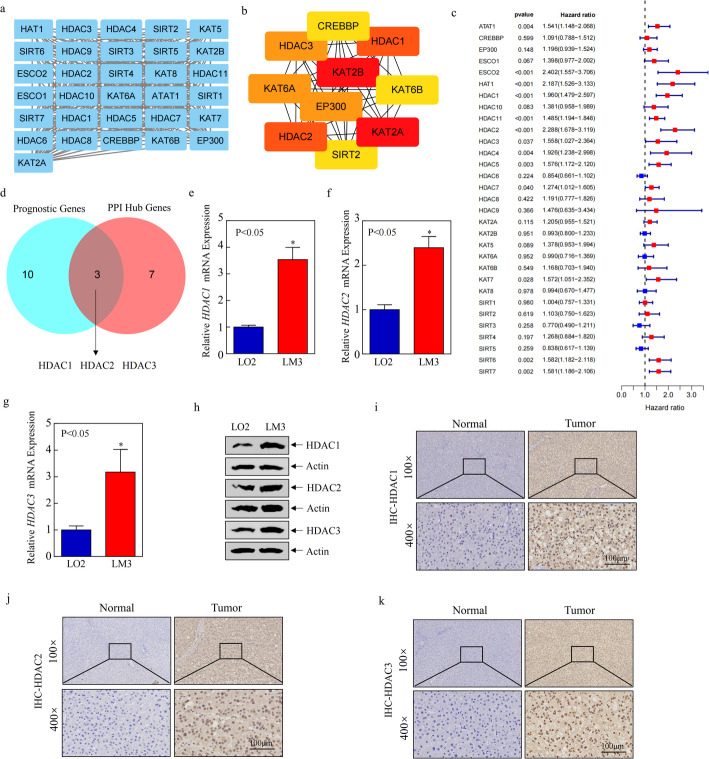
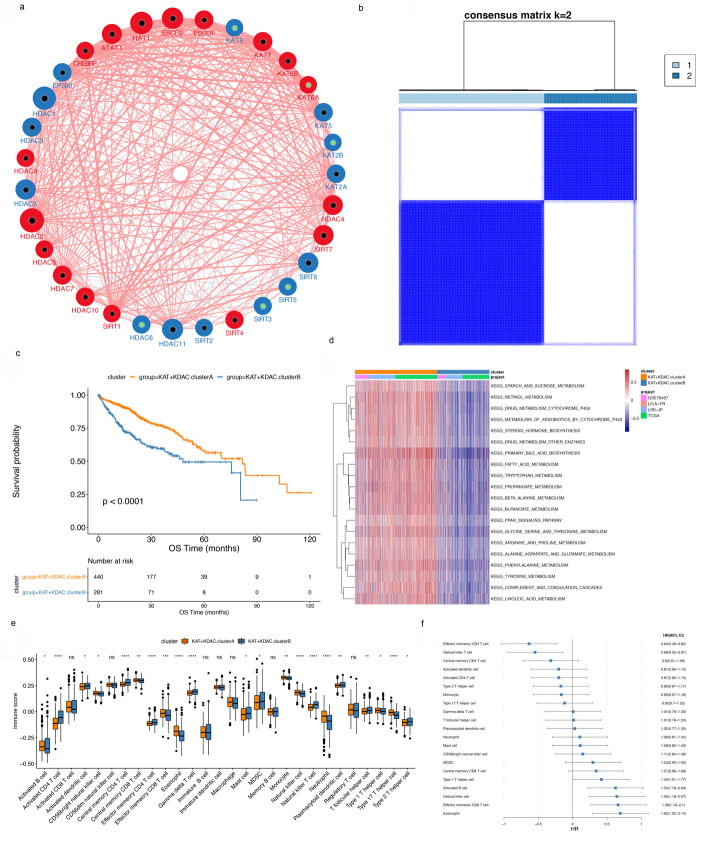
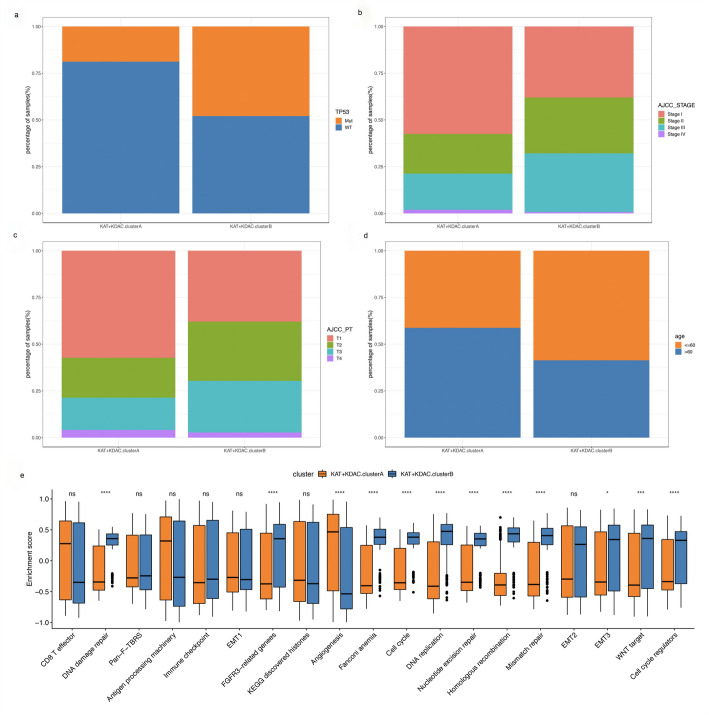
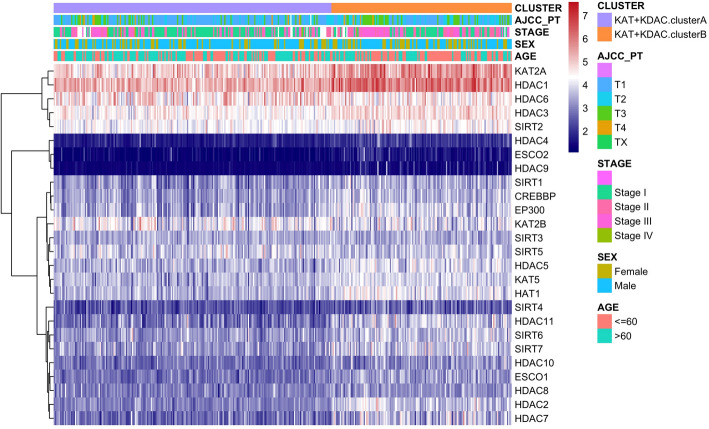
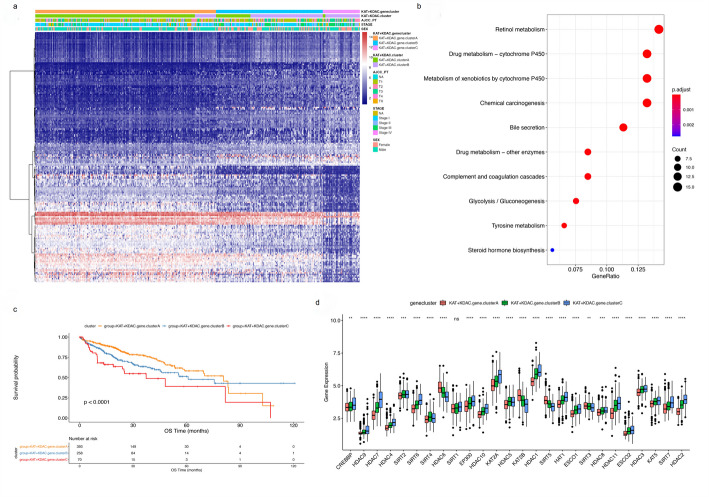
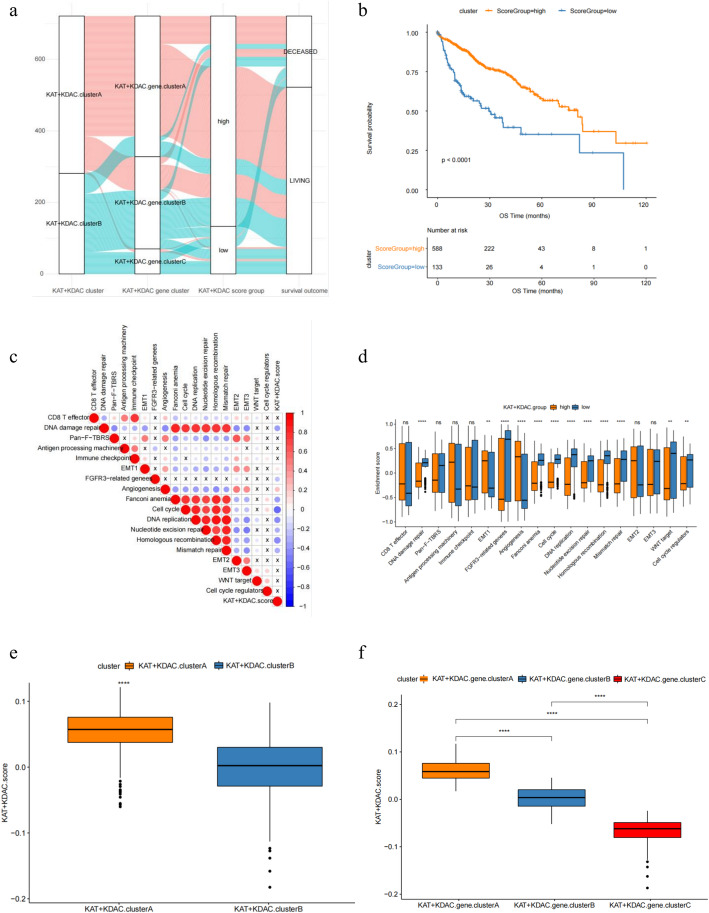
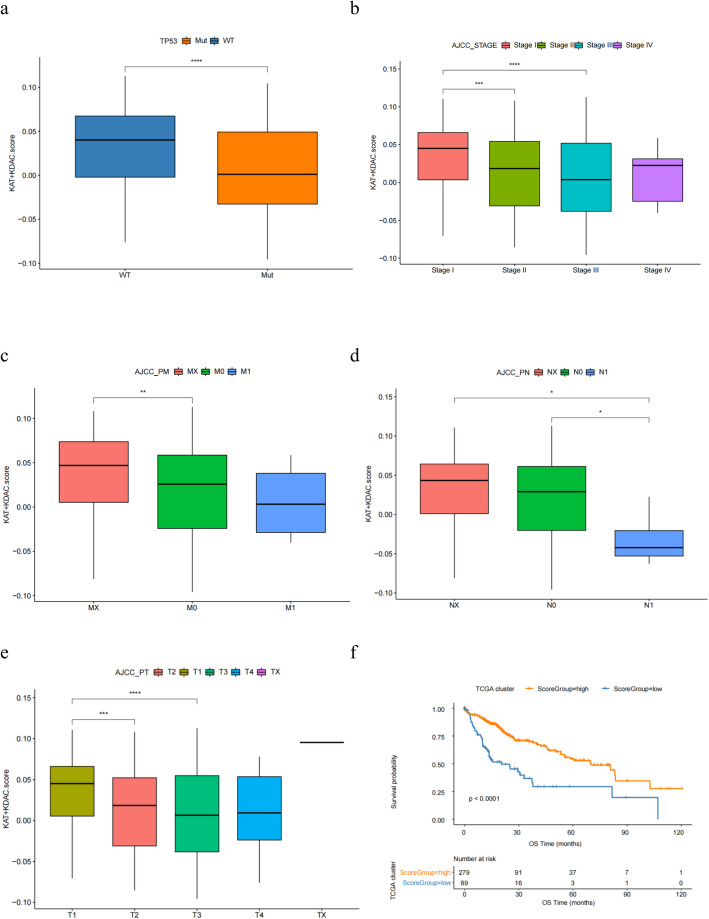
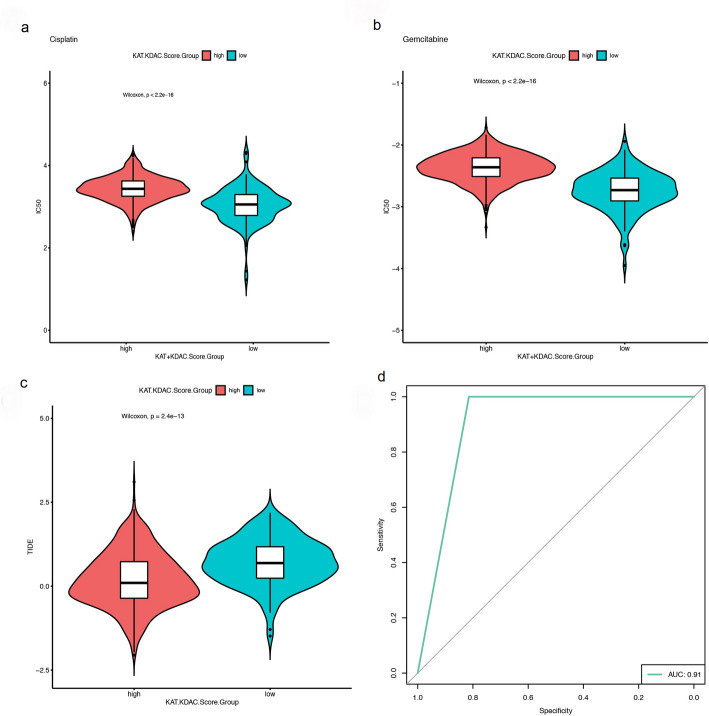
Methods: In this study, a KAT + KDAC score was developed to assess the prognosis and response to immunotherapy in liver cancer patients. The association of HDAC1, HDAC2, and HDAC3 with patient prognosis was analyzed, and the PPI network was constructed. The correlation between the score and P53 mutation status, stage, and TNM staging was also investigated. Additionally, the response to chemotherapy was evaluated. The TIDE score was also assessed.
Results: Our analysis showed that HDAC1, HDAC2, and HDAC3 are highly associated with patient prognosis and are centrally located in the PPI network. Patients with high KAT + KDAC scores had a better prognosis, and the score correlated with P53 mutation status, stage, and TNM staging. Notably, patients with low KAT + KDAC scores demonstrate resistance to cisplatin and gemcitabine, and have a lower TIDE score. Moreover, the KAT + KDAC score accurately predicted patient response to immunotherapy.
Conclusion: The KAT + KDAC modification pattern is critical in the initiation and progression of liver cancer. This score can be used to predict patient prognosis and immunotherapy response. Future studies are needed to further explore the underlying mechanisms and potential therapeutic applications.
Keywords: Acetylation; Consistent clustering; Deacetylation; Immunotherapy; Prognosis.
© 2025. The Author(s).
Conflict of interest statement
Declarations. Ethics approval and consent to participate: This retrospective study was performed in line with the principles of the Declaration of Helsinki. Approval was granted by the Ethics Committee of the First Affiliated Hospital of Wenzhou Medical University (Date 2025-04-09/No. KY2025-R120). Informed consent: Given the retrospective nature of the study and the use of anonymized data, the requirement for written informed consent was waived by the Ethics Committee. Consent for publication: Not applicable. Competing interests: The authors declare no competing interests.
Figures
Similar articles
-
A rapid and systematic review of the clinical effectiveness and cost-effectiveness of paclitaxel, docetaxel, gemcitabine and vinorelbine in non-small-cell lung cancer.Health Technol Assess. 2001;5(32):1-195. doi: 10.3310/hta5320. Health Technol Assess. 2001. PMID: 12065068
-
Cost-effectiveness of using prognostic information to select women with breast cancer for adjuvant systemic therapy.Health Technol Assess. 2006 Sep;10(34):iii-iv, ix-xi, 1-204. doi: 10.3310/hta10340. Health Technol Assess. 2006. PMID: 16959170
-
Interplay between tumor mutation burden and the tumor microenvironment predicts the prognosis of pan-cancer anti-PD-1/PD-L1 therapy.Front Immunol. 2025 Jul 24;16:1557461. doi: 10.3389/fimmu.2025.1557461. eCollection 2025. Front Immunol. 2025. PMID: 40777041 Free PMC article.
-
Systemic treatments for metastatic cutaneous melanoma.Cochrane Database Syst Rev. 2018 Feb 6;2(2):CD011123. doi: 10.1002/14651858.CD011123.pub2. Cochrane Database Syst Rev. 2018. PMID: 29405038 Free PMC article.
-
Are Current Survival Prediction Tools Useful When Treating Subsequent Skeletal-related Events From Bone Metastases?Clin Orthop Relat Res. 2024 Sep 1;482(9):1710-1721. doi: 10.1097/CORR.0000000000003030. Epub 2024 Mar 22. Clin Orthop Relat Res. 2024. PMID: 38517402
References
-
- Bray F, Laversanne M, Sung H, Ferlay J, Siegel RL, Soerjomataram I, et al. Global cancer statistics 2022: GLOBOCAN estimates of incidence and mortality worldwide for 36 cancers in 185 countries. CA Cancer J Clin. 2024;74(3):229–63. - PubMed
-
- Chen W, Zheng R, Baade PD, Zhang S, Zeng H, Bray F, et al. Cancer statistics in China, 2015. CA Cancer J Clin. 2016;66(2):115–32. - PubMed
Grants and funding
LinkOut - more resources
Full Text Sources
Research Materials
Miscellaneous