. 2025 Aug 12;122(32):e2502687122.
doi: 10.1073/pnas.2502687122. Epub 2025 Aug 7.

O-GlcNAc modulation of nuclear pore complexes orchestrates mRNA export efficiency

Affiliations

O-GlcNAc modulation of nuclear pore complexes orchestrates mRNA export efficiency

Samuel L Junod et al. Proc Natl Acad Sci U S A. .

Abstract

Efficient gene expression depends on the tightly regulated export of messenger RNA (mRNA) through nuclear pore complexes (NPCs), which are densely modified by O-linked N-acetylglucosamine (O-GlcNAc). Although dysregulated O-GlcNAcylation has been linked to a variety of human diseases, the precise distribution of O-GlcNAc within the NPC and its effects on mRNA export remain poorly understood. Here, we combined single-point edge-excitation subdiffraction (SPEED) microscopy with stochastic optical reconstruction microscopy (STORM) to map the nanometer-scale distribution of an O-GlcNAc analog (GlcNAz) within NPCs and to quantify the export kinetics of mRNA-protein complexes (mRNPs) under both normal and perturbed O-GlcNAcylation conditions. Under basal conditions, GlcNAz is predominantly localized around the central channel of the NPC. However, both hypo- and hyper-O-GlcNAcylation cause GlcNAz to redistribute toward the nuclear and cytoplasmic peripheries. This shift is paralleled by changes in mRNP localization and altered distributions of key, highly O-GlcNAcylated, phenylalanine-glycine nucleoporins. These architectural rearrangements are accompanied by functional consequences: Elevated O-GlcNAcylation nearly doubles mRNA export efficiency (~61%), while reduced O-GlcNAcylation lowers it to ~16%, along with reduced NPC engagement. The transport receptor TAP exhibits analogous efficiency changes, reinforcing the role of O-GlcNAcylation as a key regulator of nucleocytoplasmic transport. Together, these results suggest that O-GlcNAcylation modulates NPC architecture and transport dynamics to fine-tune mRNA export, and indicate that targeted modulation of NPC O-GlcNAc levels may offer a promising strategy for addressing diseases associated with nuclear transport dysfunction.

Keywords: O-GlcNAc; messenger RNA; nuclear pore complex; posttranslational modification; superresolution fluorescence microscopy.


Conflict of interest statement

Competing interests statement:The authors declare no competing interest.

Figures

Fig. 1.
Fig. 1.
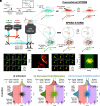
O-GlcNAcylation of the Nuclear Pore Complex (NPC). (A) Schematic of the NPC, highlighting its major subregions and the proposed distribution of O-GlcNAc–modified FG-Nups (92). (B) Histogram showing the O-GlcNAc concentration for each Nup, adjusted for their average copy numbers. Error bars represent the weighted O-GlcNAc score provided by the “The O-GlcNAc Database v2.0” (62). Most Nups possess potential O-GlcNAcylation sites. (B and C) Comparison of FG sites (blue), predicted amino acid disorder (black line), and O-GlcNAc sites (orange) for the four most heavily O-GlcNAcylated Nups: Nup153, Nup68, Nup214, and Nup62. Disorder scores were calculated using the IUPred3 “long disorder” algorithm (93) with medium smoothing. FG sites include FxFG and GLFG motifs. O-GlcNAc sites were obtained from “The O-GlcNAc Database v2.0.” Approximate structured regions (gray) are based on the PDB entries listed at the end of this figure legend. (D) Catalytic sites of OGT and OGA, which can be inhibited by OSMI-4 and Thiamet-G, respectively. OGT adds O-GlcNAc moieties to proteins, while OGA removes them. (E) Confocal images of untreated, OGT-inhibited, and OGA-inhibited POM121-GFP HeLa cells labeled with the Nup-specific anti–O-GlcNAc RL2 antibody conjugated to Alexa Fluor 647 (AF647). The yellow inset boxes in the OGT-inhibited images are displayed at 40% higher brightness than the larger images. (Scale bar, 5 μm.) (F) Scatter plot overlay of nuclear envelope (NE) intensities measured in the RL2–AF647 channel under untreated (n = 307), OGT-inhibited (n = 255), and OGA-inhibited (n = 284) conditions, normalized to the untreated condition. The underlying box-and-whisker plots show the SD in the box, the mean as the central line, and the 95% CI as whiskers. P-values were calculated via two-sided Welch’s t test. ****P < 1 × 10⁻⁴. PDB References: Nup153: 2EBQ, 2EBR, 2EBV, 2GQE (94), Nup214: 2OIT (95), 7R5J (96), Nup62: 7R5J (96), Nup98: 2Q5X (97), 4OWR (98).
Fig. 2.
Fig. 2.
Determining the distribution of the O-GlcNAc analog in the NPC. (A) Overview of the method for labeling O-GlcNAc sites. Live cells incorporate GlcNAz in place of GlcNAc, and after fixation and permeabilization, a Cu(I)-catalyzed azide–alkyne cycloaddition (CuAAC) is used to attach alkyne–AF647 to GlcNAz. (B) Simplified schematic of the SPEED-STORM microscope, highlighting both the inclined point spread function (PSF) used in SPEED-STORM and the narrow-field illumination employed in conventional STORM. The 488 nm and 633 nm laser beams are coaligned using dichroic filters (DF) and reflection mirrors (RM). Narrow-field illumination is achieved by inserting an additional set of lenses (dotted gray square) so that the laser passes through the center of the objective’s back aperture. For SPEED-STORM, these lenses are removed, and the laser beam is shifted off-center by a micrometer stage, enabling inclined illumination that produces the single-point edge-excitation subdiffraction (SPEED) PSF. (C) Three-dimensional depiction of conventional STORM with narrow-field illumination in a HeLa cell expressing GFP-tagged NE. After imaging the NE using a 488 nm laser in the x–y plane, the same cell is illuminated at 633 nm to excite multiple AF647–GlcNAz molecules, collecting thousands of 2D emission frames. (D) Cross-sectional view of the NE under 488 nm illumination. A single GFP-labeled NPC is excited, marking the NPC centroid at (0,0) in the x–y plane. A 633 nm laser then excites a single AF647–GlcNAz molecule within or around the same NPC. (E) Representative initial frames from a conventional STORM video using the narrow-field setup. The red and yellow crosses indicate AF647–GlcNAz localizations. Yellow crosses denote AF647–GlcNAz signals within ±100 nm of the NE center determined by a Gaussian fit to the GFP intensity peaks. (Scale bar, 1 µm.) (F) Single-molecule localizations of AF647–GlcNAz (red dots) and colocalizations (yellow dots) from panel E plotted on a Cartesian graph alongside the NE (green line). (G) Representative initial frames from a SPEED–STORM video using vertical illumination. Like panel F, yellow crosses mark AF647–GlcNAz localizations within ±100 nm of the single GFP-labeled NPC centroid (0,0). (Scale bar, 1 µm.) (H) Single-molecule localizations from panel G, showing AF647–GlcNAz (red dots), colocalizations (yellow dots), the NE boundary (±100 nm from the center; green lines), and the NPC centroid (green circle). N, nucleus; C, cytoplasm. (I) SPEED–STORM results under (i) untreated, (ii) OGT-inhibited (reduced O-GlcNAcylation), and (iii) OGA-inhibited (increased O-GlcNAcylation) conditions. Scatter plots show GlcNAz localizations relative to each NPC centroid (0,0). The total number of localizations (n) is indicated in the Top-Right corner of each plot. Dashed lines separate the nuclear basket (–100 to –20 nm), central channel (–20 to 20 nm; yellow), and cytoplasmic fibrils (20 to 100 nm; red and purple). The x- and y-dimensions of each dataset were fitted with Gaussian curves to reveal subregional densities. Each curve is labeled and accompanied by its percent area of the total fit, peak position, and SD. Goodness-of-fit is indicated by R2 for the x- and y-fits. Bin size: 5 nm; all ± values are SE.
Fig. 3.
Fig. 3.
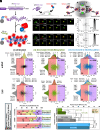
Nuclear export dynamics of mRNP and TAP under altered O-GlcNAcylation in live cells, resolved by SPEED microscopy. (A) Schematic of the mRNP plasmid construct and labeling strategy. The pmG–MS2 plasmid contains 24 MS2 stem loops (MS2_24×) at the 3′ end, which mature into an mRNP when coexpressed with mCherry–MCP–NLS (red). Each mRNP typically binds ~9 copies of mCherry–MCP–NLS. The fluorophore is excited at 561 nm. (B) Diagram of the MS2-loop and mCherry–MCP model mRNA system used for live-cell single-molecule imaging of mRNP export. (C) Illustration of a labeled mRNP (red) either successfully traversing the NPC (green) from nucleus to cytoplasm or returning to the nucleus in an abortive event. (D) Example of a successful single-molecule mRNP transit. A single mCherry–mRNP (red) originates in the nucleus, engages with the GFP-labeled NPC (green), and arrives in the cytoplasm. (Scale bar, 1 µm.) (E) Cartesian plot of the mRNP trajectory from the successful event in (D). Colors indicate the time sequence of each localization. (F) Example of an abortive single-molecule event. A single mCherry–mRNP (red) exits the nucleus, interacts with the GFP-labeled NPC (green), but returns to the nucleus. (Scale bar, 1 µm.) (G) Cartesian plot of the mRNP trajectory from the abortive event in (F), color-coded by time. In both (E and G), light gray shading indicates the x-regions of –100 to –20 nm and 20 to 100 nm, while dark gray shading represents –20 to 20 nm, corresponding to the NPC’s central channel. N, nucleus; C, cytoplasm. (H) Two-dimensional spatial distributions of mRNP localizations at the NPC under (i) untreated, (ii) decreased, and (iii) increased O-GlcNAcylation. The NPC centroid is at (0,0). The total number of localizations (n) is shown in the Top-Right corner of each plot. Dashed lines along the x-axis approximate the nuclear basket region (–100 to –20 nm), central channel (–20 to 20 nm, yellow), and cytoplasmic fibrils (20 to 100 nm, red/purple). (I) Two-dimensional distributions of TAP localizations under the same conditions as in (H). Distributions in (H and I) were fitted with Gaussian curves in the x- and y-dimensions to determine peak positions, SD, and percent areas. The minimum number of Gaussians yielding R2 > 0.95 was used for each dataset. Bin size is 10 nm, and all ± values are SE. (J) Comparison of the percentage of localizations in the nuclear (<–20 nm), central (–20 to 20 nm), and cytoplasmic (>20 nm) subregions for GlcNAz, mRNP, and TAP under each condition. Error bars represent the number of localizations within ± (localization precision √2) around the threshold values of –20 nm and 20 nm (±10 nm for mRNP and TAP, ±8 nm for GlcNAz). (K) Export efficiencies of TAP and mRNP for each O-GlcNAcylation state, with significance determined by two-sided proportion tests. n.s., not significant; *P < 0.05; **P < 0.01; ****P < 10−4.
Fig. 4.
Fig. 4.
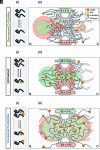
Model for O-GlcNAcylation-Dependent Regulation of Nucleocytoplasmic Transport. Integrating our findings with prior knowledge relating FG-Nups and O-GlcNAcylation (i), we propose cartoons illustrating how different O-GlcNAcylation states affect FG-Nup structure (ii), thereby altering NPC function. The boxed percentage values show the nuclear export efficiencies. (A) Under reduced O-GlcNAcylation, strengthened FG–FG interactions generate a more compact and rigid barrier, delaying or rejecting large export complexes such as mRNPs and reducing overall export efficiency. (B) In untreated cells, balanced FG–FG interactions maintain an optimal barrier that permits efficient yet selective nucleocytoplasmic transport. (C) Elevated O-GlcNAcylation weakens FG–FG cohesion, increasing pore flexibility and permeability, thereby accelerating mRNP transit but potentially relaxing transport selectivity.

Similar articles

References

    1. Ma J., Hou C., Wu C., Demystifying the O-GlcNAc code: A systems view. Chem. Rev. 122, 15822–15864 (2022). - PubMed
    1. Zhang F., et al. , O-GlcNAc modification is an endogenous inhibitor of the proteasome. Cell 115, 715–725 (2003). - PubMed
    1. Ohn T., Kedersha N., Hickman T., Tisdale S., Anderson P., A functional RNAi screen links O-GlcNAc modification of ribosomal proteins to stress granule and processing body assembly. Nat. Cell Biol. 10, 1224–1231 (2008). - PMC - PubMed
    1. Ruan H.-B., et al. , O-GlcNAc transferase/host cell factor C1 complex regulates gluconeogenesis by modulating PGC-1α stability. Cell Metab. 16, 226–237 (2012). - PMC - PubMed
    1. Slawson C., Lakshmanan T., Knapp S., Hart G. W., A mitotic GlcNAcylation/phosphorylation signaling complex alters the posttranslational state of the cytoskeletal protein vimentin. Mol. Biol. Cell 19, 4130–4140 (2008). - PMC - PubMed

LinkOut - more resources