Published Erratum
. 2025 Aug 12;122(32):e2518853122.
doi: 10.1073/pnas.2518853122. Epub 2025 Aug 7.

Correction for Brill et al., Dissociation of SYNGAP1 enzymatic and structural roles: Intrinsic excitability and seizure susceptibility

No authors listed
Published Erratum

Correction for Brill et al., Dissociation of SYNGAP1 enzymatic and structural roles: Intrinsic excitability and seizure susceptibility

No authors listed. Proc Natl Acad Sci U S A. .
No abstract available


Figures

Fig. 1.
Fig. 1.
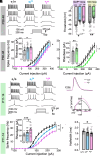
Layer 2/3 pyramidal cells in Syngap1 +/GAP* and GAP*/GAP* mice have reduced intrinsic excitability, similar to heterozygous KO mice. (AD) Data from P38–48 GAP* and KO mice. (A) Example current clamp traces in from 500 ms current injections in +/+ (WT), */GAP* (+/*) and GAP*/GAP* (*/*) cells, showing reduced spiking and increased rheobase in +/* and */* cells. Current injections of +150, +225, +300, and +375 pA (Bottom to Top). (B) Summary graphs showing spike threshold in pyramidal cells from +/+, +/* and */* mice, as well as +/+ and +/− mice. (C) Input/output curves showing spike frequency in response to hyperpolarizing and depolarizing current injections for GAP* mice. Inset: Rheobase in +/+, +/* and */* cells. (D) Input/output curves showing spike frequency in response to hyperpolarizing and depolarizing current injections for KO mice. Inset: Rheobase in +/+ and +/– cells. (EH) Data from P11–14 GAP* mice. (E) Example current clamp traces in from 500 ms current injections in +/+ (WT), */GAP* (+/*) and GAP*/GAP* (*/*) cells, showing reduced spiking and increased rheobase in +/* and */* cells. Current injections of +50, +125, +200, and +275 pA (Bottom to Top). (F) Top: Representative action potentials from WT (black) and */* (magenta) mice, scaled to peak and aligned to threshold. Bottom: Phase plot (V vs. ΔV) from the action potentials shown in the Left. The action potential from the */* cell has a shorter halfwidth and both faster rise and decay phases. (G) Input/output curves showing spike frequency in response to hyperpolarizing and depolarizing current injections for GAP* mice. Inset: Rheobase in +/+, +/* and */* cells. (H) Summary graphs showing spike halfwidth in pyramidal cells from +/+, +/* and */* mice. *, **, *** indicate P < 0.05, P < 0.01, P < 0.005, respectively. Unpaired t test for comparing +/+ vs. +/−; ANOVA for comparing +/+ vs. +/* vs. */*.
Fig. 2.
Fig. 2.
Decreased input resistance is the likely cause of reduced excitability. (AC) Passive membrane properties. Summary graphs showing RMP (A), input resistance (B), and membrane time constant (C) in pyramidal cells from younger and older wt, +/*, and */* mice, as well as wt and +/− mice. Insets in B and C show representative traces from wt and */* mice highlighting decreased input resistance in */* (B) and shorter membrane time constant in */* cells in the younger age group (C). (D) Ih. Top: Exemplar traces from P38-48 WT (black) and +/− (green) mice showing currents in response to a hyperpolarizing voltage step (−60 to −85 mV) to measure Ih. A larger current is observed in the +/− cell. Bottom: Summary graphs showing Ih in pyramidal cells from younger and older wt, +/*, and */* mice, as well as wt and +/− mice. The only significant difference is observed in cells from +/− mice. (E) Leak potassium currents. Left: Example response to −60 to −65 mV voltage step in the presence of TTX and CdCl2 in cells from wt (black) and +/− (green) animals, aged P30-35. Larger current is evoked in the +/− cell, indicating higher leak currents. Cell capacitance was measured as the area under the curve of the second capacitive current transient (which is similar in both cells). Right: Summary graphs showing leak current density (current/capacitance) in wt and +/− cells. Current density is increased in +/− cells, consistent with larger leak potassium currents. *, **, *** indicate P < 0.05, P < 0.01, P < 0.005, respectively. Unpaired t test for comparing +/+ vs. +/−; ANOVA for comparing +/+ vs. +/* vs. */*.

Erratum for

Publication types

LinkOut - more resources