. 2025 Aug 7;10(18):e194497.
doi: 10.1172/jci.insight.194497. eCollection 2025 Sep 23.

Longitudinal single-cell analysis of glucagon-like peptide-2 treatment in patients with short bowel syndrome

Affiliations

Longitudinal single-cell analysis of glucagon-like peptide-2 treatment in patients with short bowel syndrome

Yumi Kudo et al. JCI Insight. .

Abstract

BACKGROUNDGlucagon-like peptide-2 (GLP-2) analogs are used clinically to enhance nutrient absorption in patients with short bowel syndrome (SBS); however, the precise mechanism remains unclear. To address this, the study aimed to clarify the dynamics of intestinal epithelial cells and immune cells in patients with SBS treated with GLP-2 analogs.METHODSFive male patients diagnosed with SBS, all of whom received treatment with the GLP-2 analog teduglutide, were included in the study. We conducted longitudinal single-cell RNA sequencing (scRNA-Seq) analysis of intestinal tissue from patients with SBS over a year, integrating microbiome composition analysis.RESULTSAfter treatment, the α-diversity of the gut microbiome increased, indicating a more varied microbial environment. ScRNA-Seq analysis revealed a reduction of T helper 2 cells and an increase in regulatory T cells, suggesting a shift toward an immunoregulatory intestinal environment. Additionally, nutrient-absorbing enterocyte-Top2 and middle clusters expanded, enhancing the absorption capacity, whereas major histocompatibility complex class I/II-expressing enterocyte-Top1 cells declined, potentially modulating immune responses.CONCLUSIONThe study findings indicate that GLP-2 analogs reshape intestinal immunity and microbiota, fostering a less inflammatory environment while promoting nutrient uptake efficiency. These insights offer a deeper understanding of the role of GLP-2 analogs in gut adaptation and provide a foundation for refining clinical strategies for SBS treatment.FUNDINGThis work was supported by Sakaguchi Memorial Foundation, Grants-in-Aid from the Japanese Society for the Promotion of Science (JSPS) (21K18272, 23H03665, 23H02899, 23K27590, 25K22627, 23K08037), JST FOREST(21457195), and the Takeda Japan Medical Office Funded Research Grant 2022.

Keywords: Clinical Research; Drug therapy; Gastroenterology.


Conflict of interest statement

Conflict of interest: The authors have declared that no conflict of interest exists.

Figures

Figure 1
Figure 1. GLP-2 analog is effective for patients with SBS.
(A) Study design: Five male patients with short bowel syndrome (SBS) were enrolled and treated with the glucagon-like peptide-2 (GLP-2) analog teduglutide. Serum samples, intestinal tissue biopsies, luminal microbiome samples, and clinical records were collected at 3 time points: before treatment (0 months, 0M), 6 months after initiation (6M), and 12 months after initiation (12M). Intestinal microbiomes were analyzed using 16S ribosomal RNA (16S rRNA) sequencing, and intestinal tissue samples underwent histological examination and single-cell RNA sequencing (scRNA-Seq). (B and D) Body weight (B) and stool output (D): Each line represents changes in body weight or stool weight for an individual patient across the 3 time points. (C) Parenteral fluid volume: Each dot represents the volume of parenteral fluid administered to an individual patient across the 3 time points; bars indicate the mean ± SD. (E) The eicosatrienoic acid/arachidonic acid (T/T) ratio in blood: The left panel shows changes in the T/T ratio at the 3 time points. The right panel compares the T/T ratio before treatment (0M) with posttreatment (either 6M or 12M, with the later time point selected). Each dot represents an individual sample; bars indicate the mean ± SD. Values are log-transformed. (F) Blood biomarkers: Changes in blood levels of lipase and citrulline at the 3 time points. (G) Intestinal villi length: Changes in the total villus length (sum of villus height and crypt depth) at the 3 time points based on histological analysis. Each dot represents an individual sample; bars indicate the mean ± SD. Due to missing crypt depth data for case 4 at 6M, this data point was excluded. Statistical analyses included the 1-tailed paired t tests (BF) and the Mann-Whitney test (G). IE, intestinal epithelium; LP, lamina propria; N/A, not available due to missing crypt depth data.
Figure 2
Figure 2. GLP-2 analog therapy enhances microbial diversity and functional capacity without uniform taxonomic shifts in SBS.
(A) β-diversity analysis: Principal coordinate analysis (PCoA) based on the Bray-Curtis dissimilarity index to assess gut microbiota differences among samples. (B) α-diversity analysis: Comparison of microbial diversity at 0 months (0M), 6M, and 12M based on observed operational taxonomic units (OTUs). The box shows the interquartile range (IQR), with the line inside indicating the median. The whiskers extend to the smallest and largest values within 1.5 times the IQR. Each dot represents an individual sample. (C) Microbial composition: Relative abundance of gut microbiota in each sample, represented by bacterial genus and categorized by phylum. (D) Differentially abundant taxa: Log2 fold change (LFC) of differentially abundant genera identified through Analysis of Compositions of Microbiomes with Bias Correction 2 (AMCOM-BC2). Genera with LFC > 1 were positively enriched, while those with LFC < –1 were negatively enriched. (E) MetaCyc functional pathways: Predicted MetaCyc functional pathways that showed significant temporal differences by Friedman test and exhibited increased abundance at 12M compared with 0M and/or 6M are shown. The x-axis represents the –Log10 (P value) from statistical comparisons of pathway abundances. Statistical analyses included permutational multivariate 2-way ANOVA (A), the Mann-Whitney test (B), and Friedman test (E).
Figure 3
Figure 3. Single-cell transcriptomics reveals epithelial expansion and mucosal remodeling during GLP-2 therapy.
(A) Uniform manifold approximation and projection (UMAP) visualization of small intestine mucosal cells after removing dead cells. Data from 4 patients (0 months [0M], 6M, and 12M) include a total of 37,314 cells: case 1 (17,510 cells), case 2 (8,067 cells), case 3 (8,201 cells), and case 5 (3,536 cells). Cells were clustered into 19 groups, color-coded based on metadata. (B) Dot plot showing expression levels of key genes in each cluster. Dot color represents scaled expression, and size indicates the percentage of cells expressing each gene. (C) Visualization of cell distributions at 0M (10,187 cells), 6M (14,095 cells), and 12M (13,032 cells). (D) Changes in cell cluster proportions over time (0M, 6M, 12M).
Figure 4
Figure 4. GLP-2 therapy modulates the intestinal immune cell landscape with selective changes in T cell subsets.
(A) Uniform manifold approximation and projection (UMAP) visualization of immune cells identified using PTPRC, with B cells, plasma cells, and myeloid cells excluded. Data from 4 patients at 0 months (0M), 6M, and 12M include a total of 17,736 cells: case 1 (7,769 cells), case 2 (3,915 cells), case 3 (4,161 cells), and case 5 (1,891 cells). Cells were clustered into 16 groups, color-coded by metadata. (B) Dot plot showing expression levels of key genes in immune cell clusters. (C) Cell distributions at 0M (4,937 cells), 6M (6,653 cells), and 12M (6,146 cells). (D) Changes in immune cell clusters at 0M, 6M, and 12M. ILC, innate lymphoid cell; NK, natural killer.
Figure 5
Figure 5. GLP-2 analog treatment selectively expands Tregs and activates growth-associated signaling pathways in the CD4+ compartment.
(A) Uniform manifold approximation and projection (UMAP) visualization of CD4+ T cells identified using CD4. Data from 4 patients at 0 months (0M), 6M, and 12M include a total of 7,093 cells: case 1 (2,990 cells), case 2 (1,697 cells), case 3 (1,703 cells), and case 5 (703 cells). Cells were clustered into 9 groups, color-coded by metadata. (B) Expression patterns of key genes in CD4+ T cell clusters. Each dot represents a gene, where color intensity indicates the scaled expression level in each cluster, and dot size represents the percentage of cells expressing the gene. (C) Cell distributions at 0M (1,772 cells), 6M (2,916 cells), and 12M (2,405 cells). (D) Proportion of each cluster in CD4+ T cells at 0M, 6M, and 12M. (E) The percentage of Th1-CXCR3 cells, Th1-TBX21 cells, T regulatory cells (Tregs), Th17 cells, and Th2 cells at 0M, 6M, and 12M. (F) Comparison of differentially expressed gene (DEG) sets related to Gene Ontology (GO) Biological Process (BP) across 0M, 6M, and 12M using compareCluster. Significantly enriched GO terms (y-axis) with P < 0.01 and q < 0.05 are visualized as dot plots. (G) Comparison of DEG sets related to biological pathways based on WikiPathways (WP) across 0M, 6M, and 12M using compareCluster. Significantly enriched pathways (y-axis) with P < 0.05 and q < 0.2 are visualized as dot plots. (F and G) Numbers below the column name represent the number of genes related to GOBP (F) or WP (G) for each cluster. Dot size represents the gene ratio (proportion of DEGs), and color indicates the adjusted P value. The 2-tailed paired Student’s t test was used to compare cluster proportions (E). compareCluster analysis was performed using Over-Representation Analysis (ORA) based on a hypergeometric test. Multiple-testing correction was applied using the Benjamini-Hochberg (BH) method to control the false discovery rate (FDR) (F and G).
Figure 6
Figure 6. Diverse CD8+ T cell subset dynamics reflect patient-specific responses to GLP-2 analog therapy.
(A) Uniform manifold approximation and projection (UMAP) visualization of CD8+ T cells identified using CD8A and CD8B markers. Data from 4 patients at 0 months (0M), 6M, and 12M include a total of 5,904 cells: case 1 (2,486 cells), case 2 (1,300 cells), case 3 (1,472 cells), and case 5 (646 cells). Cells were clustered into 13 groups, color-coded by metadata. (B) Expression patterns of key genes in CD8+ T cell clusters. Each dot represents a gene, where color intensity indicates the scaled expression level in each cluster, and dot size represents the percentage of cells expressing the gene. (C) Cell distributions at 0M (1,744 cells), 6M (2,185 cells), and 12M (1,975 cells). (D) Proportion of each cluster in CD8+ T cells at 0M, 6M, and 12M. (E) Comparison of differentially expressed gene (DEG) sets related to Gene Ontology (GO) Biological Process (BP) across 0M, 6M, and 12M using compareCluster. Significantly enriched GO terms (y-axis) with P < 0.01 and q < 0.05 are visualized as dot plots. (F) Comparison of DEG sets related to biological pathways based on WikiPathways (WP) across 0M, 6M, and 12M using compareCluster. Significantly enriched pathways (y-axis) with P < 0.05 and q < 0.2 are visualized as dot plots. (E and F) Numbers below the column name represent the number of genes related to GOBP (E) or WP (F) for each cluster. Dot size represents the gene ratio (proportion of DEGs), and color indicates the adjusted P value. compareCluster analysis was performed using Over-Representation Analysis (ORA) based on a hypergeometric test. Multiple testing correction was applied using the Benjamini-Hochberg (BH) method to control the false discovery rate (FDR) (E and F).
Figure 7
Figure 7. GLP-2 therapy promotes nutrient-absorptive epithelial lineages while suppressing immune-associated enterocyte subtypes.
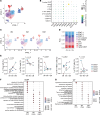
(A) Uniform manifold approximation and projection (UMAP) embedding of epithelial cells identified by EPCAM expression from the total cell population. Cells from all 4 patients across 3 time points (0 months [0M], 6M, and 12M) are included, with a total of 6,636 cells (5,112 from case 1, 244 from case 2, 936 from case 3, and 344 from case 5). Cells are clustered into 7 groups, colored by metadata as indicated in the figure. (B) Expression patterns of key marker genes for each cluster. Each dot represents a gene, where color saturation indicates scaled expression levels, and dot size represents the percentage of cells expressing that gene. (C) UMAP embedding of epithelial cells across 3 time points: 0M, 6M, and 12M (505 cells at 0M, 2,076 cells at 6M, and 4,055 cells at 12M). (D) Proportions of epithelial cell clusters at 0M, 6M, and 12M. (E) Heatmap of Z-score normalized gene expression for key intestinal mucosal pathways across clusters. Columns represent clusters (indicated by color and label), and rows represent genes categorized by pathway. To compare gene expression between clusters, the Wilcoxon rank-sum test was used.
Figure 8
Figure 8. Longitudinal gene expression profiling uncovers coordinated enhancement of absorptive function and barrier integrity in response to GLP-2.
(A) Volcano plot showing differentially expressed genes (DEGs) in epithelial cells at 0 months (0M) versus 6M. The x-axis represents Log2 fold change (LFC), and the y-axis represents –Log10 (P value). Vertical dashed lines indicate a threshold of |LFC| > 0.58, and the horizontal dashed line indicates a P value cutoff of 5 × 10⁻¹⁰. (B) Gene Ontology (GO) pathway enrichment analysis of DEGs between 0M and 6M. Genes with LFC > 0.58 that were upregulated at 6M were analyzed. Dot plots display significantly enriched biological processes (BPs) (P < 0.01, q < 0.05), with dot size indicating gene count and color representing the adjusted P value. (C) GOBP enrichment analysis of DEGs across 0M, 6M, and 12M using compareCluster. (D) Differential gene expression analysis of biological pathways based on WikiPathways (WP) across 0M, 6M, and 12M using compareCluster. (C and D) Numbers below the column name represent the number of genes related to GOBP (C) or WP (D) for each cluster. Dot plots show significantly enriched GO terms (P < 0.01, q < 0.05) (C) or pathways (P < 0.05, q < 0.2) (D), with dot size representing the gene ratio (proportion of DEGs) and color indicating the adjusted P value. (E) Heatmap of Z-score normalized gene expression for key intestinal mucosal pathways across time points. Columns represent clusters (indicated by color and label), and rows represent genes categorized by pathway. GO analysis and compareCluster analysis were performed using Over-Representation Analysis (ORA) based on a hypergeometric test (BD). Multiple-testing correction was performed using the Benjamini-Hochberg (BH) method to control the false discovery rate (FDR) (C and D). To compare gene expression between clusters, the Wilcoxon rank-sum test was used (E).
Figure 9
Figure 9. Longitudinal gene expression analysis of enterocyte-Top2 cluster reveals functional reprogramming in response to GLP-2.
(A) Volcano plot showing differentially expressed genes (DEGs) in enterocyte-Top2 cluster at 0 months (0M) versus 12M. The x-axis represents Log2 fold change (LFC), and the y-axis represents –Log10 (P value). Vertical dashed lines indicate a threshold of |LFC| > 0.58, and the horizontal dashed line indicates a P value cutoff of 0.05. (B and C) Heatmap of Z-score normalized gene expression for DEGs shown in A, across time points (B) and clusters (C). (D and E) CompareCluster analysis of DEGs in enterocyte-Top2 cluster across 0M, 6M, and 12M. Rows represent Gene Ontology (GO) Biological Process (BP) (D) and Kyoto Encyclopedia of Genes and Genomes (KEGG) pathways (E). Dot plots show significantly enriched GO terms or pathways (P < 0.01, q < 0.05), with dot size indicating the gene ratio (proportion of DEGs) and color indicating the adjusted P value. Numbers below the column name indicate the number of genes related to the pathways for each cluster. (F) Gene expression related to glycerophospholipid metabolism in enterocyte-Top2 cluster across time points. Each dot represents a gene, color intensity indicates the scaled expression level in each cluster, and dot size represents the percentage of cells expressing the gene. (G and H) Heatmap of Z-score normalized expression of genes related to glycerophospholipid metabolism across time points (G) and clusters (H). compareCluster analysis was performed using Over-Representation Analysis (ORA) based on a hypergeometric test (D and E). Multiple-testing correction was performed using the Benjamini-Hochberg (BH) method to control the false discovery rate (FDR) (D and E). To compare gene expression between clusters, the Wilcoxon rank-sum test was used (B, C, G, and H).
Figure 10
Figure 10. Changes in ligand–receptor interactions between clusters reveal enhanced intercellular communication following GLP-2 analog treatment.
(AC) Heatmaps showing outgoing signaling patterns (left panels) and incoming signaling patterns (right panels) for each cluster at 0 months (0M) (A), 6M (B), and 12M (C). Columns represent cell clusters (indicated by color and label), and rows represent signaling pathways. Relative interaction strength is shown on the scale bars.
Figure 11
Figure 11. GLP-2 analog treatment enhances communication between epithelial, immune, and CD34+ cells.
(AD) Circle plots showing intercellular signaling networks. The TGF-β (A), SEMA3 (B), and PARs (D) signaling pathways were newly detected at 12 months (12M). The TWEAK signaling pathway (C) was upregulated at 12M compared with 0M. Arrow colors indicate the source (sender) clusters of the signaling, and arrow widths represent the relative signaling strength.

References

    1. Orskov C, et al. Glucagon-like peptides GLP-1 and GLP-2, predicted products of the glucagon gene, are secreted separately from pig small intestine but not pancreas. Endocrinology. 1986;119(4):1467–1475. doi: 10.1210/endo-119-4-1467. - DOI - PubMed
    1. Dube PE, et al. The essential role of insulin-like growth factor-1 in the intestinal tropic effects of glucagon-like peptide-2 in mice. Gastroenterology. 2006;131(2):589–605. doi: 10.1053/j.gastro.2006.05.055. - DOI - PubMed
    1. Rowland KJ, et al. Loss of glucagon-like peptide-2-induced proliferation following intestinal epithelial insulin-like growth factor-1-receptor deletion. Gastroenterology. 2011;141(6):2166–2175. doi: 10.1053/j.gastro.2011.09.014. - DOI - PubMed
    1. Burrin DG, et al. Glucagon-like peptide 2 dose-dependently activates intestinal cell survival and proliferation in neonatal piglets. Endocrinology. 2005;146(1):22–32. doi: 10.1210/en.2004-1119. - DOI - PubMed
    1. Fesler Z, et al. GLP-2, EGF, and the intestinal epithelial IGF-1 receptor interactions in the regulation of crypt cell proliferation. Endocrinology. 2020;161(4):bqaa040. doi: 10.1210/endocr/bqaa040. - DOI - PMC - PubMed