. 2025 Aug 7;10(18):e183676.
doi: 10.1172/jci.insight.183676. eCollection 2025 Sep 23.

BLIMP-1 and CEACAM1 cooperatively regulate human Treg homeostasis and function to control xenogeneic GVHD

Affiliations

BLIMP-1 and CEACAM1 cooperatively regulate human Treg homeostasis and function to control xenogeneic GVHD

Ying Ding et al. JCI Insight. .

Abstract

Regulatory T cells (Tregs) are essential for peripheral tolerance and depend on TCR and IL-2 receptor (IL-2R) signaling for their homeostasis and function. In mice, IL-2-dependent B-lymphocyte-induced maturation protein 1 (BLIMP-1) contributes to Treg homeostasis. BLIMP-1 is a major transcriptional hub in human Tregs, but its mechanisms of action remain undefined. Here, using CRISPR/Cas9 ablation, we show that BLIMP-1 limits human Treg proliferation but supports IL-10, cytotoxic T lymphocyte-associated protein 4, several immune checkpoints including carcinoembryonic antigen-related cell adhesion molecule 1 (CEACAM1), and Treg functional activity. BLIMP-1 restrains Treg expansion to IL-2 by downregulating CD25 and IL-2R signaling, and by enhancing CEACAM1 expression, which in turn inhibits responsiveness to CD3/CD28 signaling and activation of mTOR. Prolonged IL-2R signaling optimizes BLIMP-1 expression, supporting chromosomal opening of CEACAM1 to increased CEACAM1 expression through STAT5- and BLIMP-1-driven enhancers. Correspondingly, CEACAM1 is highly induced on Tregs from patients with autoimmune disease undergoing low-dose IL-2 therapy, and these Tregs showed reduced proliferation. A humanized mouse model of xenogeneic graft-versus-host disease demonstrates that BLIMP-1 normally promotes, while CEACAM1 restrains, Treg suppressive activity. Collectively, our findings reveal that BLIMP-1 and CEACAM1 function in an IL-2-dependent feedback loop to restrain Treg proliferation and affect suppressive function. CEACAM1 also acts as a highly selective biomarker of IL-2R signaling in human T cells.

Keywords: Adaptive immunity; Autoimmune diseases; Autoimmunity; Immunology; Immunotherapy.


Figures

Figure 1
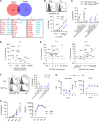
Figure 1. BLIMP-1–dependent transcriptional programs in human Tregs.
(A) Schematic of culture conditions and Cas9:single-guide RNA ribonucleoprotein (Cas9 RNP) delivery. (B) BLIMP-1 mRNA expression in control and PRDM1KO Tregs was measured by RT-PCR. Primers were designed to amplify a 910 bp region spanning exon 2 (upstream of the sgRNA site) to exon 5 (downstream of the editing site). Knockout efficiency is shown. Units are bp. (C) Immunoblot analysis of BLIMP-1 protein. The black vertical lines on B and C indicate that lanes were run on the same gel or blot but were noncontiguous. (DF) At 7 days posttransfection, Tregs were rested overnight in media and stimulated with anti-CD3/CD28 and IL-2 for 16 hours before RNA-Seq. (D) Volcano plot comparing gene expression in control and PRDM1KO Tregs. Genes with ≥1.5-fold change (FC) and FDR < 0.05 are colored in red. (E) Reactome pathway analysis of DEGs. (F) Representative gene set enrichment analysis (GSEA) plots illustrating transcriptional signatures in PRDM1KO versus control Tregs, using gene sets from Molecular Signatures Database (MSigDB) (Hallmark, KEGG, and Reactome). Normalized enrichment score (NES) and P value are indicated.
Figure 2
Figure 2. BLIMP-1 limits proliferation of human Tregs.
(A) Control and PRDM1KO Tregs (n = 3) were cultured for 3 days after electroporation, subcultured every 2 days at 2 × 10⁵ cells/mL with IL-2, and counted before each passage. Total (left) and per-passage (right) expansion are shown. (B) At 3 days after transfection, Tregs (5 × 10⁴/well; n = 3) were cultured for 4 additional days, where [3H]-thymidine was added during the last 4 hours of culture. (C and D) Control and PRDM1KO Tregs (n = 7) were stimulated as indicated with 500 U/mL (C) or with various concentrations (D) of IL-2 for 3 days; cell proliferation was assessed by [3H]-thymidine incorporation. CPM, counts per million. (E) At 7 days after transfection, the indicated Tregs (n = 5) were rested for 4 hours and stimulated with the indicated concentrations of IL-2 for 15 minutes and pSTAT5 was enumerated. (F) IL-2R subunit expression was evaluated by flow cytometry on day 7; representative histograms and quantitative data (n = 5). Data are shown as the mean ± SEM and analyzed by 2-way ANOVA with multiple comparisons (A and CE), or a paired 2-tail t test (B), or a 1-sample 2-sided t test (F). *P < 0.05, **P < 0.01, ***P < 0.001, ****P < 0.0001.
Figure 3
Figure 3. BLIMP-1 is required for optimal Treg function.
(AC) At 7 days after transfection with Cas9 RNP, the indicated Tregs were stimulated with anti-CD3/CD28 and IL-2 and assayed 16 hours later. (A) FOXP3 and HELIOS expression by flow cytometry (n = 6). (B) RNA expression by RNA-Seq of the indicated transcripts (n = 4). RNA data are expressed as transcripts/million (TPM). (C) PD1 and CTLA4 expression by flow cytometry (n = 6). (D) IL-10 secretion quantified by ELISA after PMA and ionomycin stimulation on day 7 posttransfection (n = 4). (E) In vitro suppression assay with control and PRDM1KO Tregs (n = 3). (FI) Effect of PRDM1KO Tregs on the development of xGVHD. Irradiated NSG mice were adoptively transferred with PBMCs to induce xGVHD or in combination with control scramble or with PRDM1KO Tregs, as indicated. xGVHD was assessed by weight loss (F), clinical scores (G), and overall survival (H) (n = 12 from 2 independent experiments). HSCT, hematopoietic stem cell transplantation. (I) Treg cell numbers in the blood were assessed at indicated time points after transplantation. Data are shown as the mean ± SEM and analyzed by a paired 2-tail t test (AD), 2-way ANOVA with multiple comparisons (E), AUC with 1-way ANOVA with multiple comparisons (F and G), a log-rank (Mantel-Cox) test (H), or 1-way ANOVA with multiple comparisons (I). *P < 0.05, **P < 0.01, ***P < 0.001, ****P < 0.0001.
Figure 4
Figure 4. CEACAM1 expression is IL-2 dependent and more robust in human Tregs than Teff cells.
(A) BLIMP-1–dependent DEGs identified in human Tregs (Figure 1D) were compared with Blimp-1–regulated DEGs in mouse Tregs. Venn diagram shows overlapping genes (≥1.5-fold change, P < 0.05); BLIMP-1–activated genes in red, repressed in blue. (B) Human CD4+ T cells were cultured for 2 days with IL-2; CEACAM1 expression was measured in Tregs (CD4+Foxp3+) and TEM cells (CD4+Foxp3CD25med) by flow cytometry; representative histograms (100 U/mL) and quantification (n = 3, mean ± SEM) are shown. (C) CD4+ T cells were cultured with IL-2 or anti-CD3/CD28 ± anti-IL-2; CEACAM1 expression was examined on gated Tregs and Teff cells (CD4+Foxp3) (n = 4, mean ± SEM; paired 2-sided t test). (D and E) FACS-sorted CD4+CD25hiCD127lo Tregs were cultured in media (n = 6), IL-2 (100 U/mL) (n = 4), or anti-CD3/CD28 with anti–IL-2 (TCR/CD28) (n = 6) for 4 or 16 hours. (D) RNA-Seq identified IL-2–induced DEGs (≥3-fold, FDR < 0.01) at 4 hours compared with basal expression in media. (E) Comparison of IL-2–dependent DEGs in D in relationship to the fold-change observed after culture with IL-2 versus TCR/CD28 at 4 and 16 hours. (F) FACS-sorted Tregs and CD4+CD45RACD25medCD127hi TEM cells were cultured for 5–6 days with IL-2 ± anti-CD3/CD28. CEACAM1 expression was determined by flow cytometry; representative histograms and quantification (n = 2, mean ± SEM). (G and H) Purified Tregs and TEM cells were activated by anti-CD3/CD28 and IL-2 on day 0 and subcultured with only IL-2 on days 3 and 6. CEACAM1 and CD25 RNA (G) or surface protein (H) were determined by RNA-Seq or flow cytometry (n = 4, mean ± SEM; 2-way ANOVA). *P < 0.05, **P < 0.01, ***P < 0.001, ****P < 0.0001.
Figure 5
Figure 5. Low-dose IL-2 upregulates CEACAM1 in Tregs from autoimmune patients.
A total of 27 patients with 8 autoimmune diseases (SLE n = 6; RA, psoriasis, CD, SC, ankylosing spondylitis, Sjögren’s syndrome, and SSc n = 3 each) received human IL-2 (1 million IU/d) from day 1–5 (induction), then biweekly from day 15–180 (maintenance). Samples were collected prior to treatment (D1), 3 days after induction period (D8), at month 3 (M3) prior to the maintenance injection, and at month 8 (M8), 2 months after the completion of therapy. (A) Representative histograms of CEACAM1 expression in CD4+ Tregs or TEM cells at the indicated time points. (B) Quantification of CEACAM1 expression in Tregs and CD4+CD45RA TEM cells from all patients. Data show the mean and were analyzed by unpaired 2-sided t test. (C) CEACAM1 expression in Tregs at day 8 by disease group (mean ± SEM, 1-way ANOVA). (D) The relationship between CEACAM1 and CD25 expression. Fold change for the percentage of CEACAM1+ Tregs (left) and MFI of CD25 expression (middle) after low-dose IL-2, with correlation across patients analyzed by Spearman’s rank method (right). ****P < 0.0001.
Figure 6
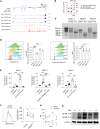
Figure 6. IL-2R–dependent CEACAM1 expression depends on chromatin opening and BLIMP-1.
(A) Purified human Tregs were stimulated with anti-CD3/CD28 and IL-2, then subcultured with IL-2 alone on days 3 and 6. ATAC-Seq and RNA-Seq were performed at the indicated times, and Genome browser tracks were plotted for the CEACAM1 locus. Peaks with STAT and PRDM1 motifs were identified using Meme suite 5.4.1. Peak IDs refer to regions with substantial changes in sequence reads, showing peaks with STAT and PRDM1 motifs. (B) Variance in accessibility across peaks over time is shown. (C and D) Purified Tregs stimulated for 3 days with anti-CD3/CD28 plus IL-2 were transfected with scramble or Cas9 RNPs targeting accessible regions (regions 3–5) and cultured for 7 more days with IL-2. (C) T7EI assay confirmed editing at the targeted region. Expected PCR product sizes are 928 bp (region 3), 663 bp (region 4), and 1,036 bp (region 5). (D) CEACAM1 and Foxp3 expression was analyzed by flow cytometry; representative and quantitative data (n = 3). (E) HEK-Blue IL-2 cells were cotransfected with luciferase reporters driven by the indicated wild-type or mutated CEACAM1 regions and either control or PRDM1 vectors. Cells were treated ± IL-2 (500 U/mL) for 24 hours, and luciferase activity was measured and normalized to baseline. (F) CEACAM1 expression was assessed by flow cytometry; representative histograms and quantitative data (n = 5). (G and H) Purified Tregs were initially stimulated with anti-CD3/CD28 and IL-2 and subcultured with IL-2 on days 3 and 6. (G) Time course of PRDM1 and CEACAM1 mRNA expression by RNA-Seq. (H) Expression of BLIMP-1 during expansion was examined by Western blotting analysis. Data were analyzed by 1-way ANOVA (D and E) or paired 2-sided t test (F). *P < 0.05, ***P < 0.001, ****P < 0.0001.
Figure 7
Figure 7. CEACAM1 is a TCR checkpoint in Tregs.
(A) RT-PCR showing CEACAM1 long (197 bp) and short (143 bp) isoforms. (B and C) Purified Tregs were stimulated with anti-CD3/CD28 and IL-2 for 3 days, electroporated with scramble or CEACAM1-targeting Cas9 RNPs, and then subcultured with IL-2 for 7 days. (B) Representative histograms of CEACAM1 expression with MFI values. (C) Proliferation assessed by 3H-thymidine incorporation after 3-day restimulation on scramble and CEACAM1KO Tregs. Data were normalized to the scramble control and shown as quantitative data of fold change (n = 4 biological replicates; mean ± SEM; 1-sample 2-sided t test). (D and E) CEACAM1+ and CEACAM1- Tregs from low-dose IL-2–treated patients (see legend to Figure 5) on day 8 were analyzed for proliferation (D) and immune markers (E) (paired 2-sided t test). (F) After 7-day IL-2 expansion, scramble and CEACAM1KO Tregs were rested overnight and treated for 6 hours as indicated. Representative plots and quantitative data of pS6 activation (n = 3; mean ± SEM; 2-way ANOVA). *P < 0.05; **P < 0.01; ***P < 0.001; ****P < 0.0001.
Figure 8
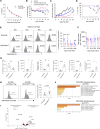
Figure 8. CEACAM1 restrains the suppressive function of human Tregs in vivo.
(A) The in vitro suppressive activity of scramble and CEACAM1KO Tregs on day 5 after electroporation (n = 3; mean ± SEM). (BD) Irradiated NSG mice were adoptively transferred with PBMCs or in combination with scramble or CEACAM1KO Tregs (n = 10–14). xGVHD was assessed by body weight (B), clinical scores (C), and survival (D). (E and F) Blood was collected on day 7, 14, 21, and 28 after transplantation. CEACAM1 expression (E) and human Treg number (F) were measured by flow cytometry (n = 14). (G and H) On day 36, spleens were analyzed for CEACAM1 expression by Tregs and cell numbers of the indicated cell populations (G) and Ki67 expression by human Tregs (H) (n = 5). (I and J) RNA-Seq of donor control and CEACAM1KO human Tregs before transplantation. (I) Volcano plot illustrating CEACAM1-activated and -repressed genes. DEGs with an expression difference of ≥1.25-fold and FDR value of <0.05 are colored in red. (J) Hallmark pathway analysis of DEGs. Data (BH) are from 2 independent experiments and are analyzed using AUC with 1-way ANOVA (B and C), log-rank (Mantel-Cox) test (D), 2-way ANOVA with multiple comparisons (E and F), and unpaired 2-sided t test (G and H); *P < 0.05, **P < 0.01, ***P < 0.001, ****P < 0.0001.

References

    1. Toomer KH, et al. Essential and non-overlapping IL-2Rα-dependent processes for thymic development and peripheral homeostasis of regulatory T cells. Nat Commun. 2019;10(1):1037. doi: 10.1038/s41467-019-08960-1. - DOI - PMC - PubMed
    1. Dikiy S, Rudensky AY. Principles of regulatory T cell function. Immunity. 2023;56(2):240–255. doi: 10.1016/j.immuni.2023.01.004. - DOI - PubMed
    1. Klatzmann D, Abbas AK. The promise of low-dose interleukin-2 therapy for autoimmune and inflammatory diseases. Nat Rev Immunol. 2015;15(5):283–294. doi: 10.1038/nri3823. - DOI - PubMed
    1. Grasshoff H, et al. Low-dose IL-2 therapy in autoimmune and rheumatic diseases. Front Immunol. 2021;12:648408. doi: 10.3389/fimmu.2021.648408. - DOI - PMC - PubMed
    1. Botta D, et al. Dynamic regulation of T follicular regulatory cell responses by interleukin 2 during influenza infection. Nat Immunol. 2017;18(11):1249–1260. doi: 10.1038/ni.3837. - DOI - PMC - PubMed

MeSH terms