. 2025 Aug 26;44(8):116078.
doi: 10.1016/j.celrep.2025.116078. Epub 2025 Aug 6.

A cholinergic spinal pathway for the adaptive control of breathing

Affiliations

A cholinergic spinal pathway for the adaptive control of breathing

Minshan Lin et al. Cell Rep. .

Abstract

The ability to amplify motor neuron (MN) output is essential for generating high-intensity motor actions. This is critical for breathing that must be rapidly adjusted to accommodate changing metabolic demands. While brainstem circuits generate the breathing rhythm, the pathways that directly augment respiratory MN output are not well understood. Here, we map first-order inputs to phrenic motor neurons (PMNs), a key respiratory MN population that initiates diaphragm contraction to drive breathing. We identify a predominant spinal input from a distinct subset of genetically defined V0C cholinergic interneurons. We find that these interneurons receive phasic excitation from brainstem respiratory centers, augment phrenic output through M2 muscarinic receptors, and are highly activated under a hypercapnia challenge. Specifically silencing cholinergic interneuron neurotransmission impairs the breathing response to hypercapnia. Collectively, our findings identify a spinal pathway that amplifies breathing, presenting a potential target for promoting recovery of breathing following spinal cord injury.

Keywords: CP: Neuroscience; breathing; cholinergic interneurons; motor circuits; neuromodulation; phrenic motor neurons; spinal cord.


Conflict of interest statement

Declaration of interests The authors declare no competing interests.

Figures
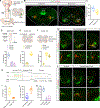
Figure 1.
Figure 1.. Distribution of monosynaptic inputs to PMNs
(A) Tracing strategy for mapping monosynaptic PMN inputs. (B) Examples of mCherry-labeled brainstem (rVRG) and spinal cord neurons projecting to PMNs. moXII, hypoglossal motor nucleus; NA, nucleus ambiguus; cc, central canal. Scale bar, 200 μm. (C) Distribution of PMN inputs in the brainstem and spinal cord (n = 7). (D) Quantification of the rostrocaudal distribution of spinal inputs to PMNs. (E) Spinal cord PMN inputs are largely localized to the ipsilateral side. (F) Dorsoventral distribution of PMN inputs in the spinal cord. (G) Cholinergic interneurons (ChAT+ INs) around the cc in the cervical spinal cord directly project to PMNs. Scale bars, 200 μm (top) and 50 μm (bottom). (H) Rostrocaudal distribution of ChAT+ INs projecting to PMNs (ChAT+ INs → PMNs). (I) ChAT+ INs comprise ~10% of total PMN inputs. (J) Quantification of contralateral and ipsilateral ChAT+ INs projecting to PMNs. (K) Quantification of the rostrocaudal distribution of ChAT+ INs projecting to PMNs. (L) ChAT+ INs from the brachial and thoracic spinal cord directly project to PMNs. Scale bars, 200 μm (top) and 50 μm (bottom). White arrowheads indicate mCherry+ cholinergic interneurons. See also Figures S1 and S2 and Video S1.
Figure 2.
Figure 2.. ChAT+ INs that project to PMNs are morphologically and topographically distinct
(A–D) Transsynaptic retrograde labeling of ChAT+ INs projecting to PMNs (ChAT+ INs → PMNs) and limb (biceps)-innervating MNs (ChAT+ INs → LMNs). Representative images of contralateral (B) and ipsilateral (C) ChAT+ INs → PMNs and ChAT+ INs → LMNs (D). Scale bar, 100 μm. White arrowheads indicate mCherry+ cholinergic interneurons. (E) Topographical distribution of ChAT+ INs → PMNs (n = 86 cells from 7 mice) and ChAT+ INs → LMNs (n = 69 cells from 5 mice). Rectangular region is enlarged to the right. (F) Quantification of ChAT+ INs → PMNs and ChAT+ INs → LMNs horizontal distance to the central canal. (G and H) Reconstruction of ChAT+ INs → PMNs (G) and ChAT+ INs → LMNs (H) morphology. Scale bar, 50 μm. (I) Sholl analysis of ChAT+ INs → PMNs (n = 36 cells) and ChAT+ INs → LMNs (n = 35 cells). Solid lines indicate the mean of the group. (J–N) ChAT+ INs → PMNs have higher maximum Sholl intersections (J), greater overall dendritic length (K), cover a larger area (L), and have higher maximum branch level (M) and greater maximum branch depth (N) compared with ChAT+ INs → LMNs. Solid lines indicate the mean and dashed lines indicate the 25th and 75th percentiles. **p < 0.01, ****p < 0.0001. See also Figure S3.
Figure 3.
Figure 3.. Pitx2-derived cholinergic synapses on PMNs
(A) Transverse section of the cervical spinal cord showing retrograde cholera toxin subunit B (CTB) labeling (green) in PMNs (squared region). Scale bar, 100 μm. (B) Enlargement of CTB-labeled PMNs (green) shown in (A). Square region indicates a PMN shown in (C). Scale bar, 20 μm. (C) Enlargement of a single CTB-labeled PMN (CTB, green) shown in (B) from a Pitx2tdTom adult mouse with synapses derived from Pitx2Tdtom+ interneurons (red) and cholinergic synapses (VAChT, blue). Numbers indicate labeled synapses on the PMN soma. Scale bar, 5 μm. (D) Magnification of numbered synapses from (C) showing colocalization of tdTomato and VAChT. Scale bar, 1 μm. (E and F) Representative images of VAChT+ puncta on PMNs in P4 Pitx2tdTom mice. Square region in (E) is enlarged in (F). Scale bars, 100 μm (E) and 20 μm (F). (G) Enlargement of the square region in (F). Numbers indicate examples of synapses on the PMN soma. Scale bar, 5 μm. (H) Magnification of numbered synapses from (G). Scale bar, 1 μm. (I) Percentage of VAChT+ puncta that are Pitx2tdTom+ on PMN somas at P4. (J–N) As in (E–I) but at P60. See also Figures S4 and S5.
Figure 4.
Figure 4.. A subset of cervical Pitx2+ interneurons are integrated within respiratory circuits
(A) Schematic of the experimental setup showing extracellular ventral root recordings and intracellular whole-cell patch-clamp recordings from individual Pitx2tdTom+ interneurons (red) in hemisected brainstem-spinal cord preparations from Pitx2tdTom neonatal mice. (B) Pie charts showing the relative proportion of respiratory-related (red) and non-respiratory-related (gray) Pitx2+ interneurons within and below the C3–4 spinal segments. (C) Example trace of voltage-clamp recording from a respiratory-related Pitx2+ interneuron (top) during ongoing respiratory burst (bottom). Red dotted box showing zoomed-in traces during a respiratory burst. (D) As in (C) but regarding current-clamp recording.
Figure 5.
Figure 5.. Effect of methoctramine on the respiratory motor output
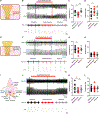
(A) Brainstem-spinal cord preparation from neonatal mice. (B) Raw (top) and integrated/rectified (bottom) traces from the C4 ventral root during baseline, methoctramine (10 μM), and washout. Boxes indicate 40 s of recording at the end of each condition (black, baseline; red, methoctramine; gray, washout), expanded at the bottom. (C) Average respiratory-burst amplitude over the last 10 min during baseline (black), 10 μM methoctramine (red), and washout (gray); black lines show mean and SEM (n = 7). (D) As in (C) but showing respiratory-burst frequency. (E) Experimental design to block M2 receptors at spinal levels only in the brainstem-spinal cord preparation from neonatal mice. (F) As in (B) but showing the effect of methoctramine at spinal level only. (G and H) As in (C) and (D) but showing the effect of methoctramine at spinal level only (n = 10). (I) Working heart-brainstem preparation from adult rats. (J) As (B) and (F) but showing the phrenic neurogram trace from the working heart-brainstem preparation. Square boxes indicate 7 s of recording at the end of each condition (black, baseline; red, methoctramine; gray, washout), expanded at the bottom. (K and L) As in (C) and (D) but showing the effects of methoctramine in the adult preparation. Data analyzed with mixed-effect model and Holm-Šídák’s multiple comparisons test. *p < 0.05, **p < 0.001. See also Figure S6.
Figure 6.
Figure 6.. ChAT+ INs are activated under a hypercapnic gas challenge
(A–C) (A) ChAT+ MNs and INs are labeled by GFP in ChAT::eGFP mice. Regions including PMNs and ChAT+ INs around the central canal are shown in (B) and (C), respectively. (B and C) Both PMNs (B) and ChAT+ INs (C) are activated, as indicated by high c-Fos expression (red), after exposure to 10% CO2. White arrowheads indicate c-Fos+ ChAT+ INs. Scale bar, 40 μm. (D) PMN activation is positively correlated to ChAT+ IN activation. (E, G, and I) Percentage of c-Fos+ PMNs after 10% CO2 for 1 h (E), 10% CO2 for 15 min (G), and 5% CO2 for 15 min (I). (F, H, and J) Number of c-Fos+ ChAT+ INs after 10% CO2 for 1 h (F), 10% CO2 for 15 min (H), and 5% CO2 for 15 min (J). *p < 0.05, **p < 0.01, ***p < 0.001. Data are represented as mean ± SEM. See also Figure S7.
Figure 7.
Figure 7.. Cholinergic interneuron silencing impairs the response to hypercapnia
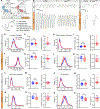
(A) Experimental setup for whole-body plethysmography and schematic of a representative breath. A Pitx2ΔChAT or Dbx1ΔChAT mouse was paired with a sex-matched control littermate and the mice were exposed to normal air conditions (21% O2, 79% N2) for 45 min, followed by 15 min of hypercapnia (5% CO2, 21% O2, 74% N2 or 10% CO2, 21% O2, 69% N2). (B and C) Examples of breath traces under normal air and 10% CO2 in Pitx2ΔChAT mice and their control littermates. A single breath was enlarged in (C). (D, H, L, and P) Breath frequency (D), minute ventilation (H), tidal volume (L), and PIF (P) distribution under normal air in Pitx2ΔChAT and control mice (n = 14–17 per group). (E, I, M, and Q) Mean and normalized frequency (E), minute ventilation (I), tidal volume (M), and PIF (Q) under normal air in Pitx2ΔChAT and control mice. (F, J, N, and R) Breath frequency (F), minute ventilation (J), tidal volume (N), and PIF (R) distribution under 10% CO2 in Pitx2ΔChAT and control mice (n = 14–17 per group). (G, K, O, and S) Mean and normalized frequency (G), minute ventilation (K), tidal volume (O), and PIF (S) under 10% CO2 in Pitx2ΔChAT and control mice. See also Figures S8–S10.

Update of

References

    1. Del Negro CA, Funk GD, and Feldman JL (2018). Breathing matters. Nat. Rev. Neurosci. 19, 351–367. 10.1038/s41583-018-0003-6. - DOI - PMC - PubMed
    1. Cui Y, Kam K, Sherman D, Janczewski WA, Zheng Y, and Feldman JL (2016). Defining preBotzinger Complex Rhythm- and Pattern-Generating Neural Microcircuits In Vivo. Neuron 91, 602–614. 10.1016/j.neuron.2016.07.003. - DOI - PMC - PubMed
    1. Smith JC, Ellenberger HH, Ballanyi K, Richter DW, and Feldman JL (1991). Pre-Botzinger complex: a brainstem region that may generate respiratory rhythm in mammals. Science 254, 726–729. 10.1126/science.1683005. - DOI - PMC - PubMed
    1. Anderson TM, Garcia AJ 3rd, Baertsch NA, Pollak J, Bloom JC, Wei AD, Rai KG, and Ramirez JM (2016). A novel excitatory network for the control of breathing. Nature 536, 76–80. 10.1038/nature18944. - DOI - PMC - PubMed
    1. Guyenet PG, and Bayliss DA (2015). Neural Control of Breathing and CO2 Homeostasis. Neuron 87, 946–961. 10.1016/j.neuron.2015.08.001. - DOI - PMC - PubMed

Substances

LinkOut - more resources