. 2025 Aug 7;21(8):e1011637.
doi: 10.1371/journal.pgen.1011637. eCollection 2025 Aug.

SRS2 is required for MUS81-dependent CO formation in zmm mutants

Affiliations

SRS2 is required for MUS81-dependent CO formation in zmm mutants

Valentine Petiot et al. PLoS Genet. .

Abstract

Helicases are enzymes that use the energy derived from ATP hydrolysis to translocate along and unwind nucleic acids. Accordingly, helicases are instrumental in maintaining genomic integrity and ensuring genetic diversity. Srs2 is a multi-functional DNA helicase that dismantles Rad51 nucleofilaments and regulates DNA strand invasion to prevent excessive or inappropriate homologous recombination in yeast. Consistently, the deletion of Srs2 has significant consequences for the maintenance of genome integrity in mitotic cells. In contrast, its role in meiotic recombination remains less clear. We present here substantial evidence that SRS2 plays an important role in meiotic recombination in the model plant Arabidopsis thaliana. Arabidopsis srs2 mutants exhibit moderate defects in DNA damage-induced RAD51 focus formation, but SRS2 is dispensable for DNA repair and RAD51-dependent recombination in somatic cells. Meiotic progression and fertility appear unaffected in srs2 plants but, strikingly, the absence of SRS2 leads to increased genetic interference accompanied by increased numbers of Class I COs and a reduction in MUS81-dependent Class II COs. We propose that SRS2 plays a role in MUS81-mediated resolution of a subset of recombination intermediates into Class II CO. The absence of SRS2 would thus lead to the alternative channeling of these recombination intermediates into the Class I CO pathway, resulting in an increased proportion of Class I CO.


Conflict of interest statement

The authors have declared that no competing interests exist.

Figures
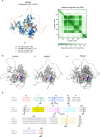
Fig 1
Fig 1. AlphaFold-predicted structures of AtSRS2 and ScSRS2, and amino acid sequence comparison of UvrD, ScSRS2 and AtSRS2.
(A) AlphaFold-predicted structure of AtSRS2 with the associated Predicted Aligned Error (PAE). (B) AlphaFold-predicted structure of ScSrs2. Helicase domains are highlighted using the color scheme corresponding to the domains in Fig 1E. (C) AlphaFold-predicted structure of AtSRS2. Helicase domains are highlighted as in Fig 1E. (D) Superimposed predicted structures of ScSrs2 and AtSRS2 with helicase domains highlighted according to the color scheme in Fig 1E. (E) Amino acid residues shown to be essential for ScSrs2 activities are underlined in bold. Three of these amino acids are not conserved in Arabidopsis (neither identical nor similar) and are marked with an asterisk.
Fig 2
Fig 2. AtSRS2 is dispensable for DNA repair and HR in somatic cells.
(A) Representative pictures of 2-week-old seedlings grown without (left), or with MMC (middle: 30 µM; right: 40 µM). (B) Mean number of true leaves per seedling. Data are shown as mean ± SD from 3 independent experiments, with 15-60 seedlings analyzed per genotype. Statistical analysis was performed using 2-way ANOVA test. * p-value < 0.05; ** p-value < 0.01; **** p-value < 0.0001. rad51 is RAD51-GFP transgenic line described in [72] (C) Mean number of true leaves per seedling of several helicase mutants and double mutant lines. Data are represented as mean ± SD of 3 independent experiments, with 15-60 seedlings analyzed per genotype. Statistical analysis was performed using 2-way ANOVA test. * p-value < 0.05. (D) Schematic representation of the IU.GUS reporter locus and an image showing blue spots (black arrows), indicating the assembly of functional GUS through HR events in an Arabidopsis leaf. The graph shows the quantification of spontaneous HR events (blue sectors) in somatic cells using the IU.GUS assay, with n indicating the number of seedlings analyzed. Each mutant was compared to wild-type (SRS2 + / + , grey boxes) sister plants. Data are represented as Tukey box plots of 114-116 seedlings per genotype, with a “+” indicating the mean. Statistical analysis was performed using nonparametric Kruskal-Wallis test followed by Dunn’s post hoc test for multiple comparisons. ns: non-significant; p-value > 0.05. (E-F) Immunolocalization of RAD51 in root tip nuclei of 5-days-old seedlings, either untreated (E) or treated with 30 µM MMC for 6h (F). Experiments were performed on srs2-1 and srs2-3 mutant lines. DNA is stained with DAPI (blue) and RAD51 foci (detected using an antibody against RAD51) are colored in green. Images are collapsed Z-stack projections of 3D image stacks. Scale bar: 5 µm. (G) Percentage of cells with 0, 1-2, 3-10, 11-20, 21-50, or > 50 RAD51 foci for each genotype, before and after MMC treatment.
Fig 3
Fig 3. AtSRS2 is dispensable for normal fertility and meiotic progression.
(A) Plant fertility was measured by counting the number of seeds per silique, with n indicating the number of siliques analyzed. Data are represented as mean (red line) ± SD, with each dot representing one silique. Statistical analysis was performed using Kruskal-Wallis test followed by Dunn’s post hoc test for multiple comparisons. ns: non-significant. (B) Representative image of pollen viability assessed using Alexander staining in WT and srs2 mutant lines. Viable pollen grains are stained purple, while dead pollen (indicated by a black arrow) appear empty and green. Data are represented as stacked bars showing the percentage of viable (grey) and non-viable (red) pollen grains. n indicates the number of pollen grains counted for each genotype. Statistical analysis was performed using 2-way ANOVA test. ns: non-significant. (C) DAPI-stained male meiotic nuclei showing wild-type like meiotic progression in srs2-1 mutant. Scale bar: 10 µm. (D) Chiasma number per cell at metaphase I stage, with n indicating the number of cells analyzed. Data are represented as mean (red line), with each dot representing one meiocyte. Statistical analysis was performed using unpaired t-test. ns: non-significant; p-value > 0.05. (E) Co-immunolocalization of RAD51 (magenta) and the chromosome axis protein ASY1 (green) on leptotene/zygotene meiotic chromosome spreads. Scale bar: 5 µm. (F) Co-immunolocalization of RAD51 (magenta) and ZYP1 (green) on zygotene/pachytene meiotic chromosome spreads. Scale bar: 5 µm.
Fig 4
Fig 4. Increased genetic interference and Class I CO in srs2 mutants.
(A) Schematic representation of the localization of fluorescent markers for I1bc and I2fg lines. Physical distances of the intervals are indicated. CEN: centromere. (B) FTL crossover frequency in I1bc and I2fg intervals in wild-type (grey) and srs2-1 (blue). CO frequency within I1bc and I2fg intervals is presented as the genetic distance. Each mutant is compared to wild-type (WT) sister plants (SRS2 + / + , in grey). Data are represented as mean (red line), with each dot representing one plant. Statistical analysis was performed using Z-test. ns: non-significant; p-value > 0.05. (C) Crossover Interference within I1bc and I2fg intervals in WT and srs2-1 mutants. Each mutant is compared to wild-type sister plants that are SRS2 + /+ (in grey). Data are represented as mean (red line), with each dot representing one plant. Statistical analysis was performed using Z-test. P-value for I2fg interference: 0.1461. ns: non-significant; p-value > 0.05; *** p-value < 0.001. (D-E) Number of tetrads observed in wild-type and srs2-1 for (D) I1bc and (E) I2fg. A schematic representation of the corresponding CO events is shown above each class of tetrad. (F) Representative images of MLH1/HEI10 co-immunolocalization on diakinesis-staged male meiocytes in WT and srs2-1 mutant. Scale bar: 10 µm. (G) Number of MLH1/HEI10 co-foci per cell, with n indicating the number of cells analyzed. Data are represented as mean (red line), with each dot representing one individual cell. Statistical analysis was performed using Mann-Whitney test. * p-value < 0.05.
Fig 5
Fig 5. Reduced MUS81-dependent Class II COs in srs2 mutants.
(A) Representative images of metaphase I-staged male meiocytes in zip4, zip4 srs2-1, msh5, and msh5 srs2-1 mutants. Scale bar: 10 µm. (B) Number of bivalents per cell in zip4, zip4 srs2-1, msh5, and msh5 srs2-1 mutants. Data are represented as mean ± SD, with n indicating the number of cells analyzed. Statistical analysis was performed using Mann-Whitney test. ** p-value < 0.01. (C) Percentage of cells with 0, 1, 2, 3, or 4 bivalents in zip4, zip4 srs2-1, msh5, and msh5 srs2-1 mutants. Number of cells analyzed is the same as in (B). (D) Representative pictures of metaphase I-staged male meiocytes in zip4, zip4 mus81, zip4 srs2-1, and zip4 srs2-1 mus81 mutants. Scale bar: 10 µm. (E) Number of bivalents per cell meiocytes in zip4, zip4 mus81, zip4 srs2-1, and zip4 srs2-1 mus81 mutants. Data are represented as mean ± SD, with n indicating the number of cells analyzed Statistical analysis was performed using Kruskal-Wallis test followed by Dunn’s post hoc test for multiple comparisons. * p-value < 0.05; ** p-value < 0.01. (F) Percentage of cells with 0, 1, 2, or 3 bivalents in zip4, zip4 mus81, zip4 srs2-1, and zip4 srs2-1 mus81 mutants. Number of cells analyzed is the same as in (E).
Fig 6
Fig 6. Model for the role of SRS2 in meiotic recombination.
In contrast to yeast Srs2, Arabidopsis SRS2 does not appear to play a major role in RAD51 nucleofilament dynamics. Instead, SRS2 might stabilize a subset of recombination intermediates to facilitate their resolution by MUS81 (left panel). In srs2 mutants (right panel), these intermediates would not be resolved by MUS81, and would instead be channeled into ZMM pathway, resulting in both an increase in Class I COs and a decrease in Class II COs.

Similar articles

References

    1. Kowalczykowski SC. An Overview of the Molecular Mechanisms of Recombinational DNA Repair. Cold Spring Harb Perspect Biol. 2015;7(11):a016410. doi: 10.1101/cshperspect.a016410 - DOI - PMC - PubMed
    1. Ranjha L, Howard SM, Cejka P. Main steps in DNA double-strand break repair: an introduction to homologous recombination and related processes. Chromosoma. 2018;127(2):187–214. doi: 10.1007/s00412-017-0658-1 - DOI - PubMed
    1. Wright WD, Shah SS, Heyer W-D. Homologous recombination and the repair of DNA double-strand breaks. J Biol Chem. 2018;293(27):10524–35. doi: 10.1074/jbc.TM118.000372 - DOI - PMC - PubMed
    1. Hunter N. Meiotic Recombination: The Essence of Heredity. Cold Spring Harb Perspect Biol. 2015;7(12):a016618. doi: 10.1101/cshperspect.a016618 - DOI - PMC - PubMed
    1. Mercier R, Mézard C, Jenczewski E, Macaisne N, Grelon M. The molecular biology of meiosis in plants. Annu Rev Plant Biol. 2015;66:297–327. doi: 10.1146/annurev-arplant-050213-035923 - DOI - PubMed

MeSH terms

LinkOut - more resources