. 2025 Aug 7;23(8):e3003041.
doi: 10.1371/journal.pbio.3003041. eCollection 2025 Aug.

Encoding of visual stimuli and behavioral goals in distinct anatomical areas of monkey ventrolateral prefrontal cortex

Affiliations

Encoding of visual stimuli and behavioral goals in distinct anatomical areas of monkey ventrolateral prefrontal cortex

Claudio Basile et al. PLoS Biol. .

Abstract

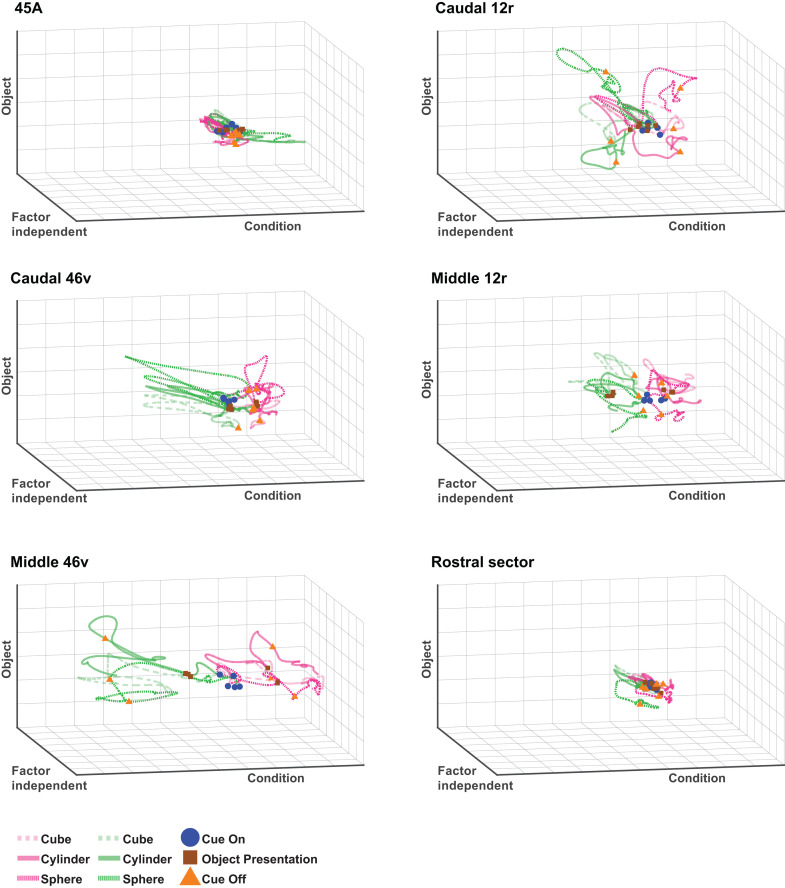
The lateral prefrontal cortex has been classically defined as an associative region involved in the so-called executive functions, such as guiding behavior based on abstract rules and mnemonic information. However, most neurophysiological studies on monkeys did not address the issue of whether distinct anatomical sectors of lateral prefrontal cortex play different functional roles. The main aim of this work is to study functional properties of neurons recorded from a large part of ventrolateral prefrontal cortex (VLPF) of two monkeys performing passive visual tasks and a visuo-motor task, and to map them on the anatomical areas defined on the basis of our recent parcellations. Our results show that some functional features are broadly distributed within VLPF, while others characterize specific areas. In particular, the temporal structuring of events and the general behavioral rule appear to be coded in all recorded areas, while each area differently contributes to the encoding of visual features and to the exploitation of contextual information for guiding behavior. Caudal VLPF areas, and especially caudal 12r, are characterized by a strong coding of visual information, both when passively presented or exploited for guiding behavior, while middle VLPF areas, and especially middle 46v, are rather more involved in the processing of contextual information for action organization. In this latter sector, visual stimuli/instructions appear to be encoded in a pragmatic format, that is, in terms of the associated behavioral outcome. Finally, area 45A and more anterior VLPF areas are characterized by a generally lower responsiveness to the employed tasks. Altogether, our findings indicate that caudal VLPF areas represent the first processing stage of visual input while middle VLPF areas primarily contribute to the selection and planning of contextually appropriate behaviors.


Conflict of interest statement

The authors have declared that no competing interests exist.

Figures

Fig 1
Fig 1. Behavioral paradigms and parcellation of the recorded regions.
(A and B) Temporal sequence of events (above) and stimuli (below) of Picture and Video tasks. For privacy reasons, the image of the human face used in the experiment has been replaced in the figure with a schematic representation (C) Temporal sequence of events of the Visuo-Motor task. In the bottom, the three used objects are shown. (D and E) Localization of the injection sites taken from the literature (see Materials and methods and S1 Table), superimposed on the cytoarchitectonically defined VLPF areas of the recorded monkeys. Each dot, labeled with an index number, represents a different injection site (see S1 Table for details on each labeled site). Each color refers to a specific pattern of connectivity characterizing the injection sites [–22,40]. Orange, light violet, dark violet and dark magenta dots refer to territories showing transitional connectivity. Dashed lines correspond to the borders between connectionally defined areas. (F and G) Recording grids of the two monkeys superimposed on the anatomical parcellation shown in (D) and (E). P: Principal sulcus; IA: Inferior arcuate sulcus; SA superior arcuate sulcus.
Fig 2
Fig 2. Distribution of functional properties in the Picture task.
(A, B) Distribution of task-related neurons in the Picture task. The size of black dots represents the proportion of task-related neurons out of the total number of neurons of that site. (C, D) Distribution of selective neurons in the Picture task. The size of green dots represents, for each site, the proportion of selective neurons out of task-related neurons. (E) Example of neuron showing a similar discharge profile following stimulus presentation in all conditions. (F) Example of neuron responding selectively to the presentation of the sphere. Rasters and histograms are aligned with stimulus presentation (vertical dashed line). Red squares: stimulus offset; Gold squares: reward delivery. Abscissae: time (s); Ordinates: firing rate (spikes/s).
Fig 3
Fig 3. Distribution of functional properties in the Video task.
(A, B) Distribution of task-related neurons in the Video task. (C, D) Distribution of selective neurons in the Video task. (E) Example of neuron showing a similar discharge profile following stimulus presentation in all conditions. (F) Example of neuron responding selectively to presentation of a monkey grasping in first person perspective. Other conventions as in Fig 2.
Fig 4
Fig 4. Distribution of functional properties neurons in the Visuo-Motor task.
(A and B) Distribution of task-related neurons. (C, D, F, G, I, L) Distribution of Condition-dependent and Condition-Independent neurons responding during the Cue, Presentation, and Go/NoGo-Grasping/Fixation epochs. Black dots represent penetration sites in which no epoch-related neurons have been recorded. Blue, green, and magenta dots correspond to the sites in which Condition-independent, Action-selective or Inaction-selective epoch-related neurons, respectively, are represented. The size of colored dots represents the proportion of the respective category of epoch-related neurons on the total number of task-related neurons observed in each site. (E) Example of neuron showing a preferential discharge following cue appearance in the Inaction condition. (H) Example of neuron showing a discharge rate after object presentation, which is higher during the Action compared to the Inaction condition. (M) Example of neuron showing a discharge starting from the offset of the instructing cue, only during the Action condition. Rasters and histograms are aligned (vertical dashed line) with cue onset (E), object presentation (H), and object holding/cue offset (M, for Action and Inaction conditions, respectively). Green/Magenta circles: Action and Inaction cue appearance and offset, Brown squares: object presentation; Blue upward triangles: release of the hand from the starting position; Blue downward triangles: return of the hand on the starting position; Gold squares: reward delivery. Other conventions as in Fig 2.
Fig 5
Fig 5. dPCA trajectories of each VLPF area in the Picture task.
Each panel depicts the time course of the first Factor-Independent (X axis) and of the first Type of Stimulus-related (Y axis) principal components plotted together, relative to the population of task-related neurons recorded in each area. Each colored line corresponds to one of the 12 stimuli presented in the task. Green squares represent the time at which the stimulus presentation occurs. The data matrices (see Materials and methods) underlying this figure can be found in OFS database: https://osf.io/j8fcs/.
Fig 6
Fig 6. dPCA trajectories of each VLPF area in the Video task.
Each panel depicts the time course of the first Factor-Independent (X axis) and of the first Type of Stimulus-related (Y axis) principal components plotted together, relative to the population of task-related neurons recorded in each area. Each colored line corresponds to one of the six videos presented in the task. Green squares represent the time at which the stimulus presentation occurs. The data matrices (see Materials and methods) underlying this figure can be found in OFS database: https://osf.io/j8fcs/.
Fig 7
Fig 7. dPCA trajectories of each VLPF area in the Visuo-Motor task.
Each panel depicts the time course of the first Condition-related (X axis), of the first Object-related (Y axis) and of the first Factor-Independent (Z axis) principal components, relative to the population of task-related neurons recorded in each area. Green and Magenta colored lines represent Action-related and Inaction-related trajectories, respectively. Continuous and dashed lines correspond to the three objects presented, respectively. Blue circles, brown squares, and orange triangles represent, for each trajectory, the time of cue onset, object presentation, and cue offset, respectively. The data matrices (see Materials and methods) underlying this figure can be found in OFS database: https://osf.io/j8fcs/.
Fig 8
Fig 8. Mean population activity of neurons recorded in each area during the Visuo-Motor task.
Temporal profile of mean net activity of the population of task-related neurons recorded in each of the considered VLPF areas. The magenta and green curves indicate the population mean net activity in the Inaction and Action conditions, respectively. The shaded area around each curve represents standard errors. The dashed line indicates baseline-level activity. The neuronal activity is aligned on the main task events indicated below each panel of the figure. The data matrices (see Materials and methods) underlying this figure can be found in OFS database: https://osf.io/j8fcs/.
Fig 9
Fig 9. Cross-temporal decoding of the Condition (A–F) and Object (A′–F′) factors of the Visuo-Motor task in task-related neurons.
For each analysis, the decoding accuracy is computed in bins of 60 ms, sampled at 20 ms intervals. For each plot, the white vertical and horizontal lines delimit the considered time periods (see Materials and methods). Decoding periods of testing and training are indicated on the X and Y axes, respectively. For each plot, red outlines delimit statistically significant time bins (on and off-diagonal, see Materials and methods). The data matrices (see Materials and methods) underlying this figure can be found in OFS database: https://osf.io/j8fcs/.
Fig 10
Fig 10. Overview of the distribution of functional properties in VLPF.
P, Principal sulcus; IA, inferior arcuate sulcus; SA, superior arcuate sulcus.

References

    1. Levy R. The prefrontal cortex: from monkey to man. Brain. 2024;147(3):794–815. doi: 10.1093/brain/awad389 - DOI - PMC - PubMed
    1. Miller EK, Cohen JD. An integrative theory of prefrontal cortex function. Annu Rev Neurosci. 2001;24:167–202. doi: 10.1146/annurev.neuro.24.1.167 - DOI - PubMed
    1. The prefrontal cortex. Elsevier. 2015. doi: 10.1016/c2012-0-06164-9 - DOI
    1. Asaad WF, Rainer G, Miller EK. Neural activity in the primate prefrontal cortex during associative learning. Neuron. 1998;21(6):1399–407. doi: 10.1016/s0896-6273(00)80658-3 - DOI - PubMed
    1. Asaad WF, Rainer G, Miller EK. Task-specific neural activity in the primate prefrontal cortex. J Neurophysiol. 2000;84(1):451–9. doi: 10.1152/jn.2000.84.1.451 - DOI - PubMed

LinkOut - more resources