. 2025 Aug 6;13(8):e012044.
doi: 10.1136/jitc-2025-012044.

PPDPF promotes the progression of esophageal squamous cell carcinoma via c-Myc/CD24 axis

Affiliations

PPDPF promotes the progression of esophageal squamous cell carcinoma via c-Myc/CD24 axis

Bing Zhu et al. J Immunother Cancer. .

Abstract

Background: Despite a series of attempts during the last decades, the prognosis for esophageal squamous cell carcinoma (ESCC) remains poor. Although clinical immunotherapy trials have shown encouraging results, their benefits are limited. This study aims to identify novel targets for immunotherapy in ESCC.

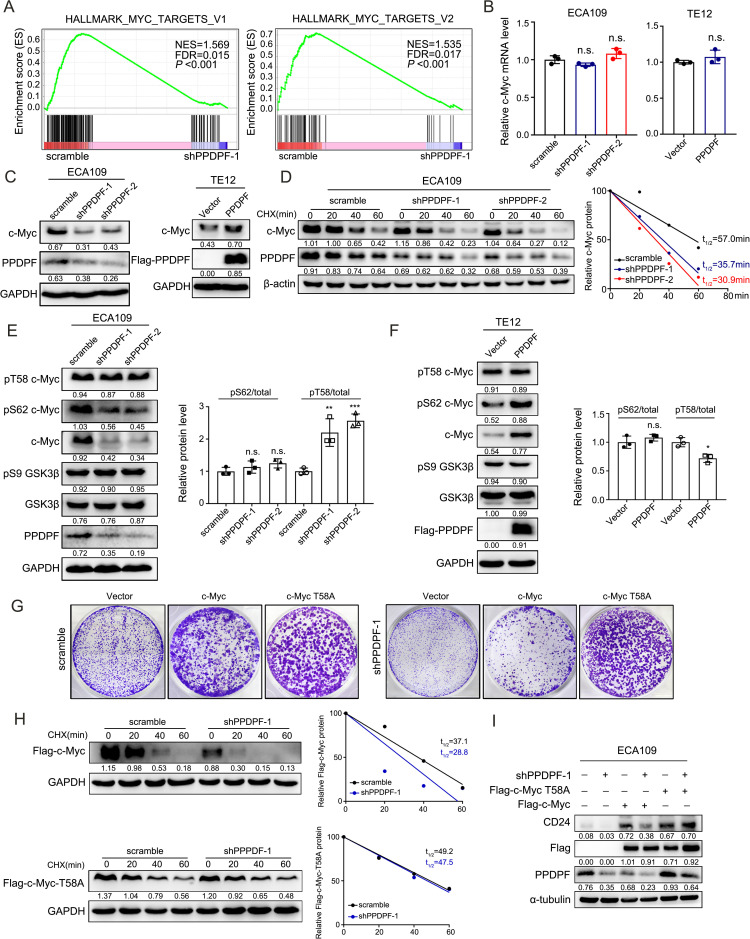
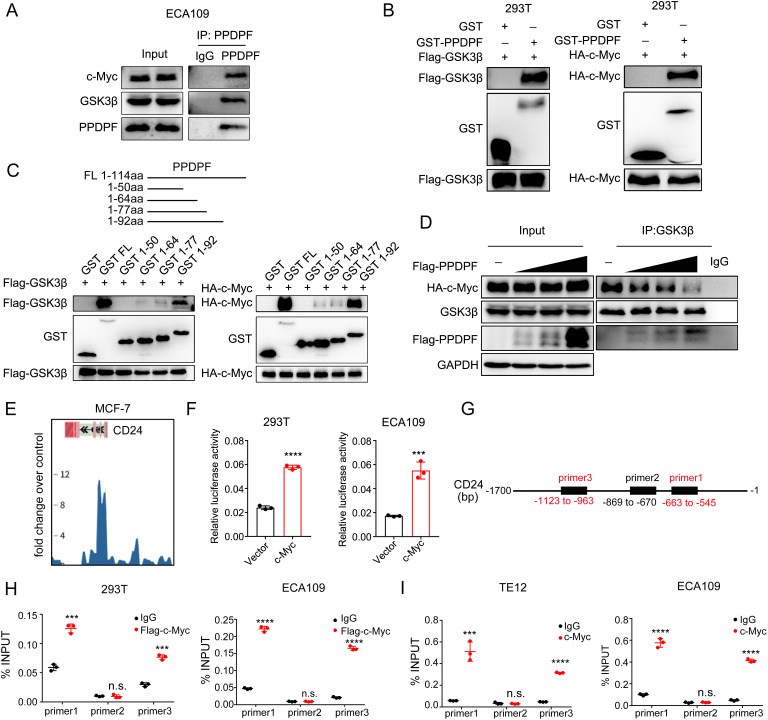
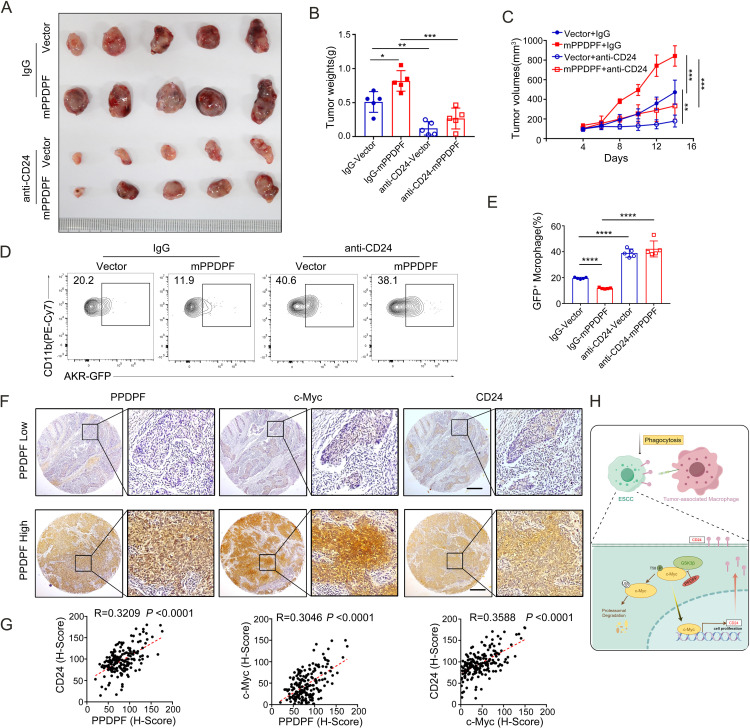
Experimental design: ESCC cell lines and mouse models were used to identify the tumor-promoting function of pancreatic progenitor cell differentiation and proliferation factor (PPDPF) and evaluate the effect of blockade of CD24. RNA sequencing was performed to profile transcriptomic changes upon PPDPF deficiency. Fluorescence microscopy-based phagocytosis assay and flow cytometry were employed to analyze macrophage phagocytosis. Immunoblotting, glutathione S-transferase-pulldown assay and co-immunoprecipitation assay were conducted to investigate the mechanism underlying the tumor-promoting role of PPDPF in ESCC. Clinical samples were analyzed to further validate the findings from preclinical models.

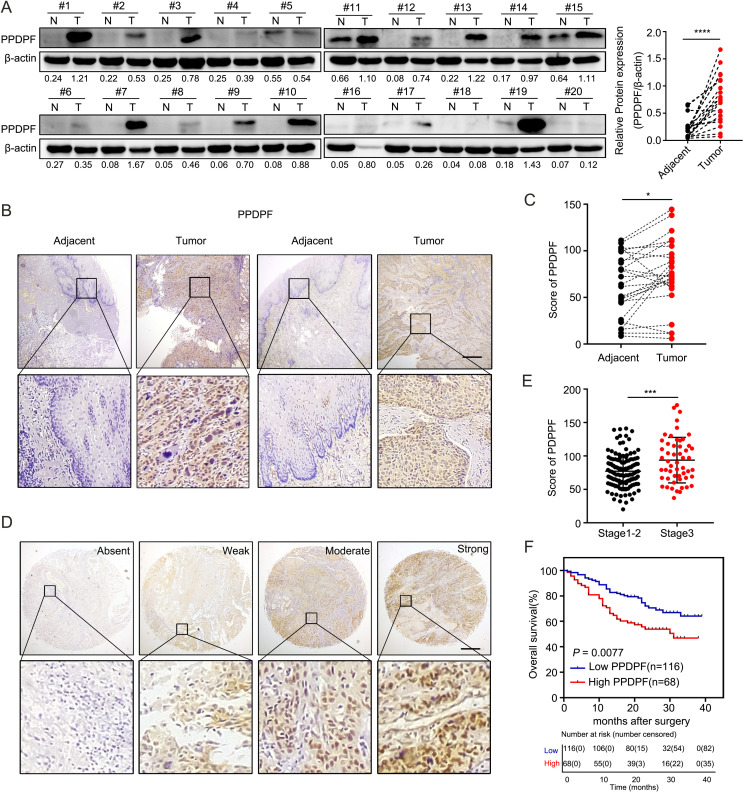
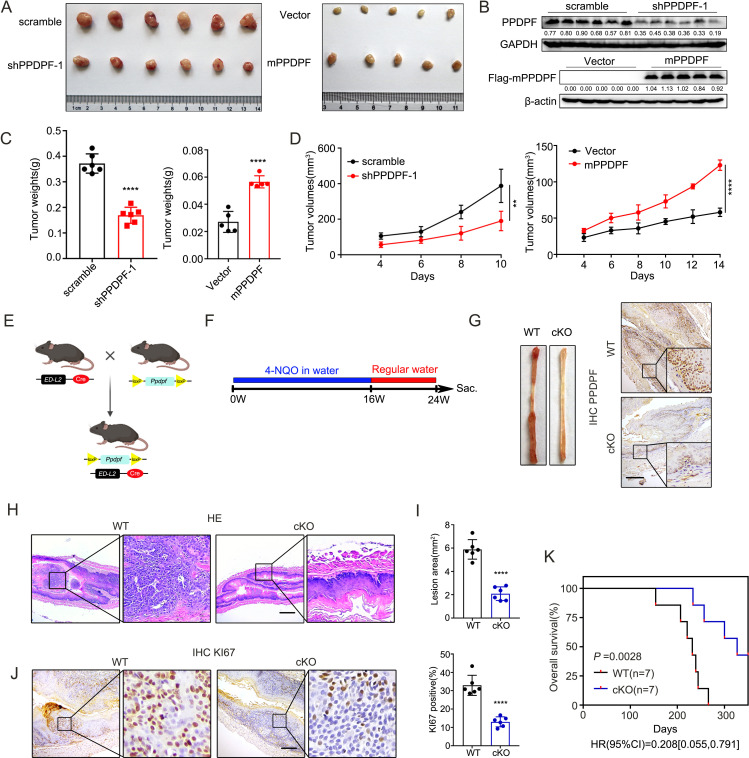
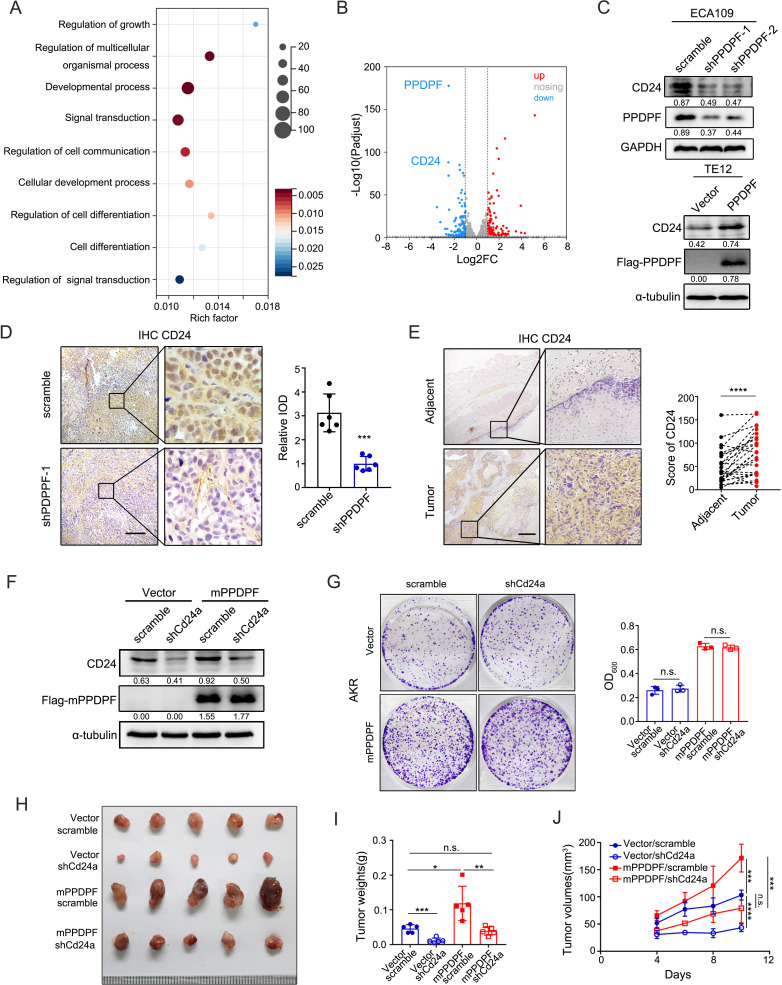
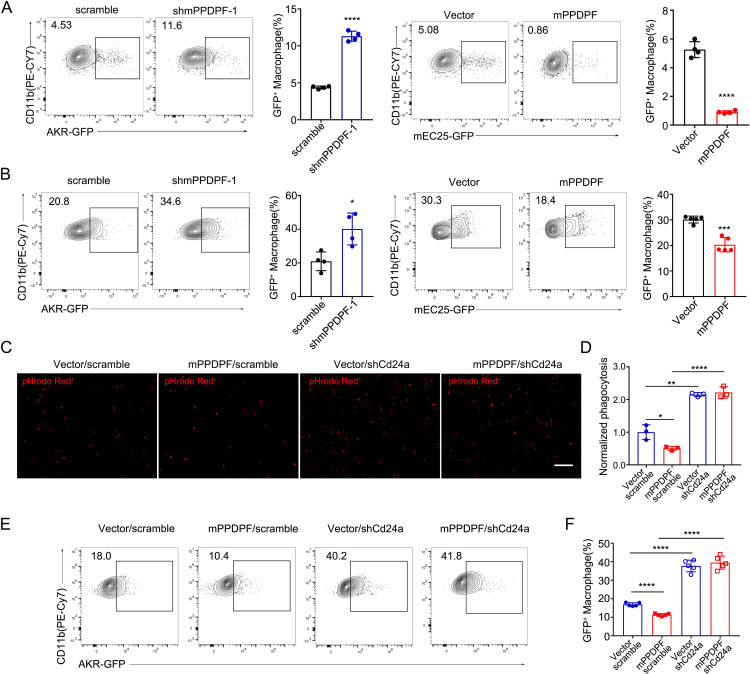
Results: The expression of PPDPF was significantly upregulated in ESCC. Deficiency of PPDPF inhibited the development of ESCC in mice. Mechanistically, PPDPF interfered with the c-Myc-GSK3β interaction and enhanced the protein stability of c-Myc, which increased the expression of CD24 and therefore promoted immune escape from macrophage phagocytosis. Positive correlations between PPDPF, c-Myc, and CD24 were observed in clinical samples. Anti-CD24 monotherapy effectively inhibited the ESCC tumor growth in mice.

Conclusions: PPDPF acts as an oncoprotein in ESCC by positively regulating the c-Myc/CD24 axis. These findings provide a potential effective target for immunotherapy in ESCC.

Keywords: Esophageal Cancer; Immune Checkpoint Inhibitor; Macrophage.


Conflict of interest statement

Competing interests: No, there are no competing interests.

Figures

Figure 1
Figure 1. Expression pattern and clinical significance of PPDPF in ESCC. (A) Protein level of PPDPF in 20 pairs of primary ESCC tissues (T) and the matched adjacent normal tissues (N) was examined by immunoblotting. The intensity of the blots was quantified using ImageJ (right). The quantification of PPDPF expression, expressed as the ratio of PPDPF/β-actin, was shown below the blots. (B) Representative IHC staining of PPDPF in ESCC tumor tissue and the paired adjacent normal tissues from patients with ESCC in Cohort-25. Scale bar, 500 µm. (C) Scatter diagram of PPDPF staining score in TMA Cohort-25. (D) Representative IHC staining of PPDPF in ESCC tumor tissues in TMA Cohort-184. Scale bar, 500 µm. (E) Quantification of PPDPF H-scores in ESCC tumor tissues at different stages in Cohort-184. (F) The overall survival curves of the patients with ESCC with low (H-score ≤87) and high (H-score >87) PPDPF expression. Survival curve was constructed using the Kaplan-Meier method and analyzed by the log-rank test. Data in A and C were analyzed by two-tailed paired Student’s t-test, and data in E were analyzed by two-tailed unpaired Student’s t-test. Data are presented as mean±SD (E). *p<0.05, ***p<0.001, ****p<0.0001. ESCC, esophageal squamous cell carcinoma; IHC, immunohistochemistry; PPDPF, pancreatic progenitor cell differentiation and proliferation factor; TMA, tumor tissue microarray.
Figure 2
Figure 2. PPDPF promotes the development of ESCC in mice. (A) Scramble control and PPDPF knockdown (shPPDPF-1) ECA109 ESCC cells were injected subcutaneously in each dorsal flank of nude mice (left, n=6 per group), vector control and PPDPF (mPPDPF)-overexpressing murine mEC25 ESCC cells were injected subcutaneously in each dorsal flank of C57BL/6 mice (right, n=5 per group). (B) Immunoblotting analysis of PPDPF expression in the subcutaneous tumors in A and the quantification of protein expression was shown below the blots. (C and D) The tumor weights (C) and tumor growth curves (D) of the tumors in A. (E) Schematic diagram of the generation of the esophageal epithelium-specific Ppdpf conditional knockout (cKO) mice. (F) Schematic diagram of the 4NQO-induced ESCC mouse model. (G) Representative images of the esophagi (left) and IHC staining of PPDPF (right) in the esophageal tissues from 4NQO-treated WT and Ppdpf cKO mice. Scale bar, 200 µm. (H) Representative H&E staining of the esophageal tissues from 4NQO-treated WT and Ppdpf cKO mice. Scale bar, 500 µm. (I) Histogram representing the measurement of the tumor areas within the esophagi in 4NQO-treated WT and Ppdpf cKO mice. Scale bar, 200 µm. n=6 per group. (J) Representative images (left) and quantitative analysis (right, n=6 per group) of Ki67 IHC staining in the esophageal tissues from 4NQO-treated WT and Ppdpf cKO mice. (K) The overall survival curve of the 4NQO-treated WT and Ppdpf cKO mice. n=7 per group. Survival curves were constructed using the Kaplan-Meier method and analyzed by the log-rank test. Data in C, D, I, and J were analyzed by two-tailed unpaired Student’s t-test. Data are presented as mean±SD (C, D, I and J).**p<0.01, ****p<0.0001. ESCC, esophageal squamous cell carcinoma; IHC, immunohistochemistry; PPDPF, pancreatic progenitor cell differentiation and proliferation factor; 4NQO, 4-nitroquinoline 1-oxide.
Figure 3
Figure 3. CD24 mediates the tumor-promoting effect of PPDPF on ESCC cells in vivo. (A) Gene Ontology analysis of the RNA sequencing results (shPPDPF-1 vs scramble control ECA109 cells). (B) Volcano plot showing genes altered upon PPDPF knockdown. (C) Protein expression level of CD24 in scramble control and PPDPF knockdown ECA109 cells (upper), and in vector control and PPDPF-overexpressing TE12 cells (lower), and the quantification of protein expression was shown below the blots. (D) Representative images (left) and the relative integral optical density (IOD, right, n=6) of CD24 IHC staining in tumors derived from scramble control and PPDPF knockdown ECA109 cells. Scale bar, 200 µm. (E) Representative images of CD24 IHC staining (left) and the quantitative staining scores (right) in the tumor and the matched adjacent normal tissues in Cohort-25. Scale bar, 500 µm. (F) Efficiency of murine CD24 (Cd24a) knockdown in control (Vector) and mPPDPF-overexpressing AKR cells was examined by immunoblotting, and the quantification of protein expression was shown below the blots. (G) Crystal violet assay evaluating the colony formation capability of vector control and mPPDPF-overexpressing AKR cells with or without Cd24a knockdown (left), and the quantification analysis (right). (H–J) Images of tumors derived from vector control and mPPDPF-overexpressing AKR cells (2×10⁶ cells) with or without Cd24a knockdown (H), the corresponding tumor weights (I) and tumor growth curves (J), n=5 per group. Data in E was analyzed by two-tailed paired Student’s t-test, and data in G, I and J were analyzed by two-tailed unpaired Student’s t-test. Data are presented as mean±SD (G, I and J). *p<0.05, **p<0.01, ***p<0.001, ****p<0.0001, n.s. represents not significant. ESCC, esophageal squamous cell carcinoma; IHC, immunohistochemistry; PPDPF, pancreatic progenitor cell differentiation and proliferation factor.
Figure 4
Figure 4. PPDPF promotes the immune evasion of ESCC cells via CD24. (A) Representative flow cytometry plots and quantitative analysis demonstrating macrophage (BMDMs) phagocytosis of scramble control and mPPDPF (shmPPDPF-1) knockdown AKR cells (left), vector control and mPPDPF-overexpressing mEC25 cells (right) in vitro. (B) Representative flow cytometry plots and quantitative analysis demonstrating macrophage phagocytosis of scramble control and mPPDPF knockdown (shmPPDPF-1) AKR cells (left, n=4 per group), vector control and mPPDPF-overexpressing mEC25 cells (right, n=5 per group) in vivo. (C and D) Representative images (C) and quantitative analysis (D) of fluorescence microscopy-based phagocytosis assays analyzing the macrophage (BMDMs) phagocytosis of pHrodo Red+ vector control and mPPDPF-overexpressing AKR cells with or without Cd24a knockdown. Scale bar, 100 µm. (E) Representative flow cytometry plots demonstrating macrophage phagocytosis of vector control and mPPDPF-overexpressing AKR cells with or without Cd24a knockdown in vivo. n=5 per group. (F) Quantitative analysis of the data in (E). Data in A, B, D and F were analyzed by two-tailed unpaired Student’s t-test. Data are presented as mean±SD. *p<0.05, **p<0.01, ***p<0.001, ****p<0.0001. BMDM, bone marrow-derived macrophage; ESCC, esophageal squamous cell carcinoma; GFP, green fluorescent protein; IHC, immunohistochemistry; PPDPF, pancreatic progenitor cell differentiation and proliferation factor.
Figure 5
Figure 5. PPDPF promotes ESCC cell growth by sustaining the protein stability of c-Myc. (A) Gene Set Enrichment Analysis of MYC target gene sets based on the RNA sequencing data. (B) qRT-PCR analysis of the mRNA level of c-Myc in PPDPF knockdown ECA109 cells (left), TE12 cells with PPDPF ectopic expression (right), and their corresponding control cells. (C) Protein expression of c-Myc in PPDPF knockdown ECA109 cells (left), TE12 cells with PPDPF ectopic expression (right) and their corresponding control cells. The quantification of protein expression was shown below the blots. (D) Time-course analysis of c-Myc protein levels in scramble control and PPDPF knockdown ECA109 cells treated with 50 µM CHX for indicated time and the quantification of protein expression was shown below the blots. c-Myc protein levels were quantified and plotted on the right. (E and F) The protein levels of c-Myc, pT58 c-Myc, pS62 c-Myc, and pS9 GSK3β were examined by immunoblotting (left). The quantification of protein expression was shown below the blots, and the ratios of pT58 or pS62 to total c-Myc in the ECA109 cells (E) and TE12 cells (F) were quantified (right). (G) Crystal violet assay evaluating the colony formation capability of scramble control and PPDPF knockdown (shPPDPF-1) ECA109 cells with ectopic expression of wildtype c-Myc or T58A mutant. (H) Time-course analysis of the protein level of exogenous wildtype c-Myc (upper) or mutant T58A c-Myc (bottom) in scramble control and PPDPF knockdown ECA109 cells treated with 50 µM CHX for the indicated time and the quantification of protein expression was shown below the blots. Exogenous c-Myc protein levels were quantified and plotted on the right. (I) Immunoblotting assay examining the expression of the indicated molecules in scramble control and PPDPF knockdown ECA109 cells with ectopic expression of wildtype c-Myc or T58A mutant, and the quantification of protein expression was shown below the blots. Data in B, E and F were analyzed by two-tailed unpaired Student’s t-test. Data are presented as mean±SD. *p<0.05, **p<0.01, ***p<0.001, n.s. represents not significant. ESCC, esophageal squamous cell carcinoma; mRNA, messenger RNA; PPDPF, pancreatic progenitor cell differentiation and proliferation factor;qRT-PCR, quantitative real-time PCR.
Figure 6
Figure 6. PPDPF interrupts the interaction between c-Myc and GSK3β and regulates the expression of CD24 via c-Myc. (A) Interaction between endogenous PPDPF, c-Myc and GSK3β was detected by co-immunoprecipitation (Co-IP) assay using ECA109 cells. (B) GST pull-down assay examining the interaction between PPDPF and GSK3β (left), and the interaction between PPDPF and c-Myc (right) in vitro, purified GST was used as a control. (C) GST pull-down assay examining the interactions between GSKβ (left)/c-Myc (right) and full-length PPDPF/PPDPF truncated mutants using 293T cells. (D) Protein interaction between GSK3β and c-Myc in the absence or presence of PPDPF. HA-c-Myc plasmid (5 µg) and/or increasing dose of Flag-PPDPF plasmid (1, 2, and 5 µg) were transfected into 293T cells for 48 hours and treated with MG132 (10 µM, 6 hours) before cell lysates were harvested for Co-IP assay. (E) The ChIP-seq data from the ENCODE database indicating the binding of c-Myc to the promoter of CD24 in MCF-7 cells. (F) Luciferase reporter assay examining the effect of c-Myc on the promoter activity of CD24 in 293T (left) and ECA109 (right) cells. (G) The diagram of CD24 promoter and the predicted binding sites of c-Myc. The number in red indicated the sites verified by the subsequent experiments. (H) ChIP-qPCR assay was used to verify the binding sites of exogenous c-Myc within the promoter region of CD24 in 293T (left) and ECA109 cells (right). (I) ChIP-qPCR assay was used to verify the binding sites of endogenous c-Myc within the promoter region of CD24 in TE12 (left) and ECA109 cells (right). Data in F, H and I were analyzed by two-tailed unpaired Student’s t-test. Data are presented as mean±SD. ***p<0.001, ****p<0.0001, n.s. represents not significant. ChIP-qPCR, Chromatin Immunoprecipitation-quantitative PCR. GST, glutathione S-transferase; PPDPF, pancreatic progenitor cell differentiation and proliferation factor.
Figure 7
Figure 7. Treatment with anti-CD24 mAb promotes phagocytic clearance of ESCC cells in vivo. (A) Image of tumors derived from vector control and mPPDPF-overexpressing AKR cells (3×10⁶ cells) treated with anti-CD24 mAb or IgG control. n=5 per group. (B and C) The tumor weights (B) and tumor growth curves (C) of (A) were shown. (D and E) Representative flow cytometry plots (D) and quantitative analysis (E) depicting phagocytosis of AKR cells treated with anti-CD24 mAb versus IgG control. (F) Representative images of IHC staining of PPDPF, c-Myc and CD24 in the similar regions within serial tumor sections from the patients with ESCC in TMA Cohort-184. Scale bars, 500 µm. (G) Person correlation analysis assessing the relationship between the expression of PPDPF and CD24, PPDPF and c-Myc, c-Myc and CD24 in the tumor tissues in TMA Cohort-184. (H) Schematic representation of the molecular mechanism underlying the tumor-promoting effect of PPDPF in ESCC (drawn by Figdraw). Data in B, C and E were analyzed by two-tailed unpaired Student’s t-test. Data are presented as mean±SD. *p<0.05, **p<0.01, ***p<0.001, ****p<0.001. ESCC, esophageal squamous cell carcinoma; IHC, immunohistochemistry; mAb, monoclonal antibody; PPDPF, pancreatic progenitor cell differentiation and proliferation factor; TMA, tumor tissue microarrays.

Similar articles

References

    1. Sung H, Ferlay J, Siegel RL, et al. Global Cancer Statistics 2020: GLOBOCAN Estimates of Incidence and Mortality Worldwide for 36 Cancers in 185 Countries. CA Cancer J Clin . 2021;71:209–49. doi: 10.3322/caac.21660. - DOI - PubMed
    1. Abnet CC, Arnold M, Wei WQ. Epidemiology of Esophageal Squamous Cell Carcinoma. Gastroenterology. 2018;154:360–73. doi: 10.1053/j.gastro.2017.08.023. - DOI - PMC - PubMed
    1. Liu J, Xie X, Zhou C, et al. Which factors are associated with actual 5-year survival of oesophageal squamous cell carcinoma? Eur J Cardiothorac Surg. 2012;41:e7–11. doi: 10.1093/ejcts/ezr240. - DOI - PubMed
    1. Zeng H, Chen W, Zheng R, et al. Changing cancer survival in China during 2003-15: a pooled analysis of 17 population-based cancer registries. Lancet Glob Health. 2018;6:e555–67. doi: 10.1016/S2214-109X(18)30127-X. - DOI - PubMed
    1. Sun J-M, Shen L, Shah MA, et al. Pembrolizumab plus chemotherapy versus chemotherapy alone for first-line treatment of advanced oesophageal cancer (KEYNOTE-590): a randomised, placebo-controlled, phase 3 study. Lancet. 2021;398:759–71. doi: 10.1016/S0140-6736(21)01234-4. - DOI - PubMed

LinkOut - more resources