. 2025 Aug 7;16(1):7289.
doi: 10.1038/s41467-025-62151-9.

Artificial transneurons emulate neuronal activity in different areas of brain cortex

Affiliations

Artificial transneurons emulate neuronal activity in different areas of brain cortex

Rivu Midya et al. Nat Commun. .

Abstract

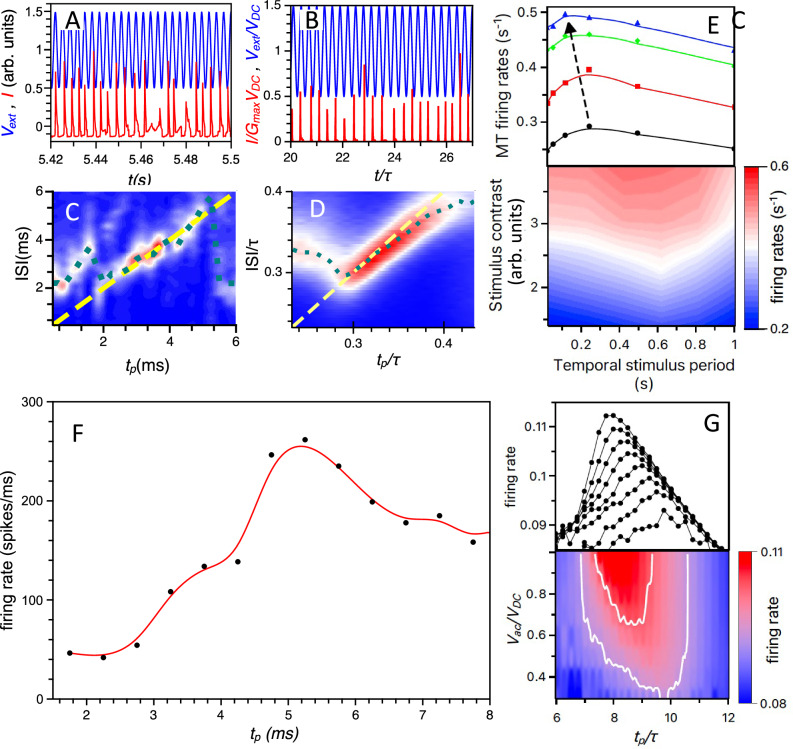
Rapid development of memristive elements emulating biological neurons creates new opportunities for brain-like computation at low energy consumption. A first step toward mimicking complex neural computations is the analysis of single neurons and their characteristics. Here we measure and model spiking activity in artificial neurons built using diffusive memristors. We compare activity of these artificial neurons with the spiking activity of biological neurons measured in sensory, pre-motor, and motor cortical areas of the monkey (male) brain. We find that artificial neurons can operate in diverse self-sustained and noise-induced spiking regimes that correspond to the activity of different types of cortical neurons with distinct functions. We demonstrate that artificial neurons can function as trans-functional devices (transneurons) that reconfigure their behaviour to attain instantaneous computational needs, each capable of emulating several biological neurons.


Conflict of interest statement

Competing interests: The authors declare no competing interests. Inclusion & Ethics: The authors have carefully considered researcher contributions and authorship criteria of multi-region collaboration to promote greater equity in this collaborative project. Experimental protocols for measurement of brain activity in macaque monkeys were approved by the Animal Care and Use Committee of the Salk Institute (MT data) and Institutional Animal Care and Use Committee of the Washington University (PRR data); these protocols conform to U.S. Department of Agriculture regulations and to the National Institutes of Health guidelines for the humane care and use of laboratory animals.

Figures

Fig. 1
Fig. 1. Neuronal selectivity in monkey brain cortex.
A sketch of the monkey brain, in which three colours mark middle temporal (MT) area, parietal reach region (PRR), and premotor (PM) cortical area. (The same three colours are used in Figs. 2 and 5 to represent three populations of cortical neurons for comparison with the artificial neuron.) These cortical areas are responsible for different functions: visual perception in area MT (yellow), planning of movement in area PRR (green), and preparation of movement in area PM (orange). Neuronal selectivity in areas MT and PRR is illustrated in the insets. In both cases, the response of a single neuron (measured in the cortex of an alert animal) depends on the relations between properties of the neuron and properties of the stimulus (in sensory neurons) or the planned action (in pre-motor and motor neurons). Thus, in the bottom inset, the neuron is most excited when the animal views a luminance grating presented in the neuron’s receptive field at an intermediate spatial frequency, and it is less responsive to high and low spatial frequencies. In the top inset, the neuron is most excited when the animal plans movement in a certain direction within the neuron’s response field. The top panel of Fig. 1 is adapted from Mooshagian, E., Holmes, C.D. & Snyder, L.H. Local field potentials in the parietal reach region reveal mechanisms of bimanual coordination. Nat. Commun. 12, 2514 (2021). 10.1038/s41467-021-22701-3 under a CC BY license: https://creativecommons.org/licenses/by/4.0/. The left part of the bottom panel of Fig. 1 (the graph) is modified from Gepshtein, S., Pawar, A.S., Kwon, S., Savel’ev, S., Albright, T.D. Spatially distributed computation in cortical circuits. Science Advances 8, eabl5865 (2022). 10.1126/sciadv.abl5865, AAAS under a CC BY license: https://creativecommons.org/licenses/by/4.0/. The illustration of the monkey observing the monitor in the bottom panel of Fig. 1 was created by Irina Savelieva.
Fig. 2
Fig. 2. Artificial transneuron.
A A conceptual representation of the transneuron moving in the parameter space defined by external voltage Vext and load resistance Rext, reaching distinct regimes of stochasticity. In these regimes, the transneuron emulates the spiking behaviour of biological neurons in the cortical areas shown in Fig. 1, with matching colours. The three pairs of measured spikes at right illustrate distinct neural response patterns: irregular spiking in middle temporal (MT) area, more regular in parietal reach region (PRR), and bursting in premotor (PM) area. In each pair of plots of the same colour, the left plot represents the measured activity of a biological neuron, while the right plot represents the measured activity of the artificial transneuron in a distinct activity regime. B A sketch of the artificial transneuron, with the diffusive memristor represented by the cylindrical element at left. Ag clusters (black dots) diffuse between two Pt electrodes in an SiOx matrix (reddish medium), forming a filament that connects the memristor terminals. When the memristor, with an internal or external capacitance C, is connected in series with an external resistance Rext and loaded by the external voltage Vext, the system generates electric current spikes, Im (schematically shown in red as Im(t)). The system can be dynamically controlled over time (t) by varying the external voltage Vext and the bath temperature T0 of the SiOx matrix. This elementary circuit is referred to as an ‘artificial transneuron’ to reflect its ability to emulate the behaviour of biological neurons in different brain areas. C Cross-section TEM image of a diffusive memristor. Two platinum electrodes (Pt) can be seen as capacitor plates with the intervening SiOx matrix having droplet-like Ag clusters in it. Additional resistance can be either attached to Pt electrodes or realised by depositing a resistive material directly on the Pt electrodes. Twenty micrographs taken from different areas of the sample consistently display similar structural characteristics of Ag cluster distributions.
Fig. 3
Fig. 3. Measured spiking activities of transneurons in different regimes under varying external voltage and temperature.
Left column AE: Measured response of the transneuron in a PRR-like regime; the plots present measurements of current, I, in milliamperes (mA) versus time in seconds (s) at applied voltages, V, measured in volts (V) from 0.6 to 1.3 V. Within this voltage interval, we observe evolution of regular isolated spikes. Spiking appears at the voltages above 0.6 V, grows more intensive for 0.7 V and 1 V, then decreases for 1.1 V and stops for 1.3 V. (In these measurements, the external resistance was 68 kΩ and the capacitance was 10 nF. The memristor was fabricated using Method 1; see ‘Methods’.) Middle column FJ: Bursting behaviour of voltage spikes is shown at intermediate voltages (1–1.9 V). Bursting appears at the voltage of about 1 V, develops with the increasing voltage (1.3 and 1.4 V), followed by depletion of spiking in bursts at 1.5 V, and disappears at about 1.9 V. (In this transneuron, the external resistance was Rext = 65 KΩ and the external capacitance was C = 50 nF. The sample was fabricated using Method 2.) Right column (top three panels, KM): MT-like spiking of a transneuron (Rext=65Kohm and C = 50 nF, fabricated using Method 2). Here, spiking starts at a relatively high voltage threshold of about 2.2 V. Then spiking frequency grows as external voltage increases to 2.2 V and 3 V. The bottom two panels (N, O) at right show the influence of temperature on spiking (for temperatures, T0, measured in degrees of Celsius, °C, from 20 to 40 °C), resulting in a further rise of spiking intensity in this transneuron (with Rext = 60 kΩ, C = 20 nF, fabricated by Method 2).
Fig. 4
Fig. 4. Three spiking modes of the artificial diffusive neuron.
Experimentally measured spiking (AC, pink curves) of electrical current, I (in milliamperes, mA), in response to the external DC voltage Vext, in volts (V), applied to the artificial neuron. Simulated spiking (DF, pink curves) of current, normalised by Vext/Rext, with external resistance Rext, using stochastic Eqs. (1a–c). Regular spiking is observed at low voltages in A, D, sparse irregular spiking is observed at intermediate voltages in B, E, and intermittent bursting is observed at higher voltages in C, F. The measured (G) and simulated (H) power spectra of system responses are represented by red, green, and black curves that correspond to spiking time series shown, respectively, in (B, E), (A, D), and (C, F). The plots reveal a clear spectral peak (green), indicating regular repetitive spiking in (A, D) at low voltages, a broad spectral maximum (black) for noisier bursting spiking in (C, F) at higher voltages, and a weak frequency dependence (red) of the spectra for sparse spiking in (B, E) at intermediate voltages, consistent with the spiking modes shown in (AF). The measured (I) and simulated (J) stochastic spiking (blue traces) of current in the diffusive memristor changes gradually as the voltage Vextt varies slowly in time t across the device. The bursting activity at high voltages is separated from regular spiking at low voltages by a regime of sparse spiking. These results demonstrate that voltage can be used to tune the activity of artificial transneurons. (Parameters of simulation are displayed in Supplementary Table 1 in SI).
Fig. 5
Fig. 5. Comparison of biological and artificial neurons.
A Scatter plots of the coefficients of variation CV1 and CV2 obtained (i) by simulating the one Ag-cluster model in Eqs. (1a–c) (grey hexagons), (ii) by measuring of transneurons (black circles), and (iii) by spiking analysis of biological neurons sampled from cortical middle temporal area (MT, yellow diamonds), parietal reach region (PRR, green squares), and premotor area (PM, orange triangles) in macaque monkeys. Panel A1 shows an overlap between the (CV1, CV2) points measured in both MT neurons and the transneuron for Rext = 65 kΩ and C = 1 nF within a voltage interval of 0.6–0.8 V. This plot shows that nearly all transneuron measurements occur within the MT cloud and are well distributed within it. Panel A2 shows that a voltage sweep from 1.06 to 1.22 V for a transneuron with Rext = 70 kΩ and C = 100 nF shifts the measured (CV1, CV2) points of the same transneuron between the PRR and PM clouds. This plot demonstrates the transneuron’s ability to transition between the stochastic regimes inherent to biological neurons in different regions of the monkey cortex. B The coefficient of variation CV1 is presented as a colour map in a space of external resistance Rext (in units of 1/Gmax, with the maximum memristor conductance Gmax) and external voltage Vext (in units Vth2 obtained at GmaxRext = 500). The map was obtained by simulations of the artificial neuron [Eqs. (1a–c)] with varying load resistance and applied voltage. The regions where the CV1 of the simulated transneuron corresponds to the CV1 of biological neurons in cortical areas MT, PRR, and PM are shown respectively in yellow, green, and orange, matching the colours used to label these cortical areas in Figs. 1A and 5A. CE Examples of simulated spiking of transneuron conductance for (CV1, CV2) = (0.64. 077) (green curves), (1.9, 0.94) (orange curves), and (1.01, 1.05) (yellow curves), which correspond to the (CV1, CV2) points emulating MT, PRR, and PM neurons respectively, displayed in (A). (Simulation parameters are listed in Supplementary Table 1).
Fig. 6
Fig. 6. Neuron selectivity.
A The input voltage signal, Vext=1+0.5cos2πt/tp, is shown in blue for tp=7 ms, with voltage in volts (V) and time in milliseconds (ms) [DC voltageVDC=1V,ACvoltageVAC=0.5VDC,externalresistanceRext=70kOhm,externalcapacitanceC=100nF]. The measured current response is shown in red, in microamperes (μA). B Similar to (A), but showing the simulated current I(t) (in red) in response to external voltage Vext (in blue), with VDC equal to the applied voltage corresponding to the self-sustained, no-bursting spiking regime (shown in Fig. 2D) and for tp corresponding to the most probable ISI time. Here, the simulated time and ISI are displayed in units of τ=RextC. Heat-Map contour plots of two-dimensional ISI histograms illustrating neuronal selectivity for the measured (C) and simulated (D) artificial diffusive neurons in the plane of stimulus period tp (oscillation period) and inter-spike interval (ISI) values. The yellow dashed lines represent the ‘perfect selectivity conditions’ (ISI=tp) while the dotted green curves show the relationship between the most probable ISI and the stimulus period tp. C, D can be interpreted as temporal receptive fields of artificial neurons. E The measured spiking rate of MT neurons as heat-map contour plot (bottom) or a function of the stimulus time-oscillation frequency at different luminance contrasts (from black-red-green-blue corresponding growing contrast) (top). The maximum rate shifts towards higher frequency (lower oscillation periods) as stimulus contrast increases (black arrow). F The measured spiking rate of the transneuron plotted against the AC-voltage period (black dots connected by B-spline line). The rate exhibits a clear maximum at a specific time (tp = t*p) analogous to the spike rate maximum of MT neurons in (E). G The simulated transneuron spiking rate as a function of the AC-voltage period and amplitude. The bottom panel shows a heat-map contour plot, while the upper panel shows individual traces of the functional relationship r(tp) at different VAC. The period t*p, corresponding to the maximum spiking rate, shifts to lower values, consistent with the shift of the maximum spiking rate of MT neurons shown in (E). (Simulation parameters are provided in Supplementary Table 1 in SI).
Fig. 7
Fig. 7. Transneuron signal phase comparator.
A Phase diagram Vextt,xt for the one-Ag-cluster model of a diffusive neuron is obtained by slowly ramping the external voltage Vext and simulating trajectory x(t) using stochastic Eq. 1 (grey curves) and deterministic Eq. 2 (orange curve). Both curves exhibit hysteresis. Two self-sustained spiking modes (regions I and III) occur at low and high voltages, separated by regions II and IV, corresponding to noise-induced sparse spiking. From the bifurcation analysis of Eq. 2, we obtained stable (red) and unstable (black) fixed points, where nearby trajectories converge or diverge exponentially. This analysis predicts two stable limit cycles, attracting nearby trajectories. The cluster position, x(t), on the cycles oscillates between maxima and minima, represented by the green points. The bifurcation analysis of Eqs. 2 predicts an unstable limit cycle (with its maxima and minima shown by blue points), which repels nearby trajectories. For low-voltage spiking (regime I), there exists a range of voltages (Vext, indicated by a blue arrow), where spiking coexists with fixed points (Region IV). B A heat-map contour plot of simulated average spiking rates generated by an artificial neuron (Eq. 1) excited by two low-frequency periodic signals: oscillating voltage [Vext=VDC+VACsinωt] and oscillating bath temperature [T0=T*(1+aTsinωt+ϕ)]. The contour plot demonstrates a dependence of the spiking rate on the relative phase ϕ between these two signals. CF Two examples of realisations of simulated spiking of conductance G(t) normalised by its maximum value Gmax (corresponding to points 1 and 2 in (B)) are shown in pink in C, D for in-phase (E) and antiphase (F) signals, with T0(t) rendered in green and Vext(t) rendered in red. Minimal spiking is observed for the in-phase signal, and significant spiking for the antiphase signal. Measured spiking (pink curve) of voltage V is shown in (G, H) for external voltage and temperature, varied in phase (I) and anti-phase (J); curves T0(t) and Vextt are shown in green and red, respectively. Consistent with simulations in (C, D), measured spiking is significantly suppressed for in-phase voltage-temperature oscillations (G) compared to the intense spiking for anti-phase oscillations (H). Simulation parameters are provided in Supplementary Table 1 in SI.

Similar articles

References

    1. Yu, Q., Tang, H., Hu, J. & Chen, K. T. Neuromorphic Cognitive Systems (Springer, 2017).
    1. Aimone, J. B. A roadmap for reaching the potential of brain-derived computing. Adv. Intell. Syst.3, 2000191 (2021).
    1. Ham, D., Park, H., Hwang, S. & Kim, K. Neuromorphic electronics based on copying and pasting the brain. Nat. Electron.4, 635 (2021).
    1. Barlow, H. B. Single units and sensation: a neuron doctrine for perceptual psychology? Perception1, 371–394 (1972). - PubMed
    1. Hubel, D. H & Wiesel, T. N. Brain and Visual perception: The story of a 25-year collaboration (Oxford University Press, 2005). .

LinkOut - more resources