

Metabolic profile changes in patients with rheumatoid arthritis detected using mass spectrometry
- PMID: 40774977
- PMCID: PMC12332061
- DOI: 10.1038/s41598-025-12994-5
Metabolic profile changes in patients with rheumatoid arthritis detected using mass spectrometry
Abstract
Background: Rheumatoid arthritis (RA) presents as pain, swelling and leads to irreversible damage in joint, and adversely affects the quality of life of patients with RA. However, the etiology of RA is still unclear, and novel biomarkers are demanded for the early prediction and diagnosis of RA and dissecting disease mechanisms.
Objective: This study aimed at profiling the disordered metabolic pathways in RA and selecting potential biomarkers to distinguish RA patients from healthy individuals, and systematically investigated the associations between metabolites and the risk of RA.
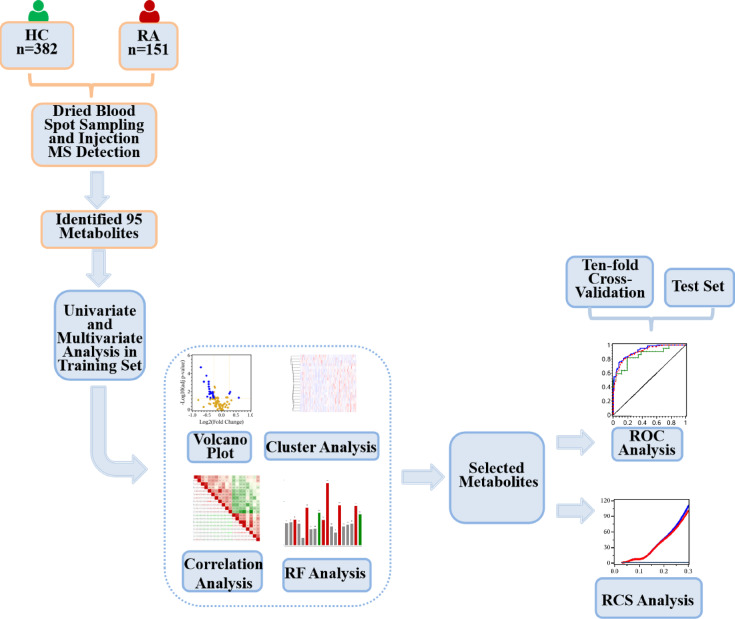
Methods: A total of 533 participants, including 382 healthy individuals and 151 RA patients, were recruited to explore altered metabolic profiles through the analysis of dried blood spot samples by mass spectrometry. Multiple algorithms were applied to identify potential biomarkers. Dose-response relationships were investigated by binary logistic regression and restricted cubic spline (RCS) analysis.
Results: There were different metabolic profiles between RA and healthy individuals. After systematic selection, a metabolic panel consisting of C20, C5, Leu, C14:1/C16, Arg/(Orn + Cit), and C2/C0 was used to differentiate the two groups. Ten-fold cross-validation and test set were employed to evaluate prediction models. The receiver operating characteristic analysis demonstrated an area under the curve of 0.920(95%CI: 0.851-0.990) in test set to distinguish the two groups. The strong correlations between the 6 metabolites and RA were observed in RCS regression model.
Conclusions: The selected biomarkers have the potential to improve the detection of RA, and may offer insights into the intervention strategies to susceptible at-risk populations of developing RA.
Keywords: Biomarker; Dried blood spot; Mass spectrometry; Metabolomics; Rheumatoid arthritis.
© 2025. The Author(s).
Conflict of interest statement
Declarations. Competing interests: The authors declare no competing interests. Ethical statement: The present study was approved by the Ethics Committee of the First Affiliated Hospital of Jinzhou Medical University. Written informed consent from all participants was obtained.
Figures


Similar articles
-
Disease activity and treatment response in early rheumatoid arthritis: an exploratory metabolomic profiling in the NORD-STAR cohort.Arthritis Res Ther. 2025 Jul 26;27(1):156. doi: 10.1186/s13075-025-03616-6. Arthritis Res Ther. 2025. PMID: 40713837 Free PMC article. Clinical Trial.
-
The C-reactive protein-to-albumin ratio as a diagnostic biomarker for rheumatoid arthritis: a cross-sectional NHANES analysis.Front Med (Lausanne). 2025 Jul 18;12:1624527. doi: 10.3389/fmed.2025.1624527. eCollection 2025. Front Med (Lausanne). 2025. PMID: 40757204 Free PMC article.
-
Serum tryptophan-kynurenine metabolites served as biomarkers of disease activity in rheumatoid arthritis and linked to immune imbalance.Arthritis Res Ther. 2025 Jul 5;27(1):136. doi: 10.1186/s13075-025-03596-7. Arthritis Res Ther. 2025. PMID: 40618074 Free PMC article.
-
A systematic review of the effectiveness of adalimumab, etanercept and infliximab for the treatment of rheumatoid arthritis in adults and an economic evaluation of their cost-effectiveness.Health Technol Assess. 2006 Nov;10(42):iii-iv, xi-xiii, 1-229. doi: 10.3310/hta10420. Health Technol Assess. 2006. PMID: 17049139
-
Methotrexate for treating rheumatoid arthritis.Cochrane Database Syst Rev. 2014 Jun 10;2014(6):CD000957. doi: 10.1002/14651858.CD000957.pub2. Cochrane Database Syst Rev. 2014. PMID: 24916606 Free PMC article.
References
-
- Almutairi, K., Nossent, J., Preen, D., Keen, H. & Inderjeeth, C. The global prevalence of rheumatoid arthritis: A meta-analysis based on a systematic review. Rheumatol. Int.41 (5), 863–877 (2021). - PubMed
-
- Goldring, M. B. Update on the biology of the chondrocyte and new approaches to treating cartilage diseases. Best Pract. Res. Clin. Rheumatol.20 (5), 1003–1025 (2006). - PubMed
MeSH terms
Substances
Grants and funding
LinkOut - more resources
Full Text Sources
Medical
Miscellaneous
