. 2025 Aug 7;16(1):7287.
doi: 10.1038/s41467-025-62320-w.

Galectin-3-integrin α5β1 phase separation disrupted by advanced glycation end-products impairs diabetic wound healing in rodents

Affiliations

Galectin-3-integrin α5β1 phase separation disrupted by advanced glycation end-products impairs diabetic wound healing in rodents

Zhongyu Zhang et al. Nat Commun. .

Abstract

Diabetic foot ulcers are severe diabetic complications, and promoting impaired angiogenesis is essential for wound healing. Pro-angiogenic galectin-3 is elevated in diabetic serum and promotes systemic insulin resistance that may impair wound healing. However, the exact role of galectin-3 in the regulation of diabetic wound healing remains unclear. Here, we demonstrate that galectin-3 promotes skin wound healing and angiogenesis via binding to its receptor integrin α5β1, and enhances downstream focal adhesion kinase phosphorylation by forming a liquid-liquid phase separation with integrin α5β1. Under diabetic conditions, aberrant accumulated advanced glycation end-products bind to galectin-3, blocking its interaction with integrin α5β1 and impairing angiogenesis. Topical treatment of recombinant galectin-3 in hydrogels promotes diabetic wound healing in rodents without causing systemic insulin resistance and synergizes with insulin. This study clarifies the binding of galectin-3 to integrin α5β1, instead of advanced glycation end-products, forming phase separation to promote angiogenesis and diabetic wound healing, laying the foundation for local galectin-3 therapy to treat diabetic foot ulcers.


Conflict of interest statement

Competing interests: The authors declare no competing interests.

Figures

Fig. 1
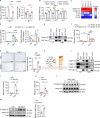
Fig. 1. Gal-3 promotes diabetic wound healing and angiogenesis in vivo.
A Immunohistochemical staining and quantifications of Gal-3, Gal-1, and Gal-7 in human diabetic (DM) and non-diabetic (Non-DM) skin sections (n = 6). Scale bar, 100 µm. B Immunohistochemical staining of Gal-3 (upper) and CD31 (lower) in skin samples from diabetic (DM) and non-diabetic (Non-DM) patients, and arrows indicate CD31-positive vasculature (red) and Gal-3 expression (black). Quantifications of Gal-3 expression in CD31-positive area were shown (n = 6, two sections per individual). Scale bar, 100 µm. C Immunohistochemical staining of Gal-3 and CD31 in skin samples from STZ-induced diabetic rats (STZ) and normal rats (Veh), arrows indicate CD31-positive vasculature (red) and Gal-3 expression (black). Quantifications of Gal-3 expression in CD31-positive area were shown (Veh, n = 6; STZ, n = 5). Scale bar, 100 µm. DG Six-to-eight weeks male SD rats were intraperitoneally (i.p.) injected with STZ to establish diabetic rat model. Full-thickness skin wounds were created and intracutaneously (i.c.) injected with recombinant Lgals3 adenovirus (OE-Gal-3) or control adenovirus (Veh). D Representative wound (left) and percentage of wound closure (right) (Veh, n = 4; OE-Gal-3, n = 5). E Picrosirius red staining showing type I collagen (COL1, yellow, orange or red) and type III collagen (COL3, green) in healed wound under polarized light. Quantifications of COL1 area percentage and total COL1 and COL3 area were shown (n = 5). Scale bar, 50 µm. F Immunohistochemical staining of CD31 that marked microvessels (black arrows) in healed wounds. Quantifications of microvessel count were shown (n = 5). Scale bar, 50 µm. G Immunoblot analysis and quantifications of CD31 in healed wounds (n = 4). HJ Eight-week-old male C57BL/6 J mice were fed with a high-fat diet for 6 weeks followed by i.p. STZ injection to establish a type 2 diabetic model. Full-thickness skin wounds were created and i.c. injected with Veh or OE-Gal-3 adenovirus. H Picrosirius red staining and I CD31 staining in healed wound and quantifications were shown (n = 5). Scale bar, 50 µm. J Immunoblot analysis and quantifications of CD31 in healed wounds (n = 3). K, L Eight-week-old female C57BL/6 J mice were fed with a chow diet. Full-thickness skin wounds were created and i.c. injected with Gal-3 inhibitor (GB1107, 133 μM, 100 µl/mouse) or solvent control (Veh). K Picrosirius red staining and (L) CD31 staining in healed wound (Veh, n = 9; GB1107, n = 12). Scale bar, 50 µm. All statistical data are presented as means ± SEM. Two-sided unpaired t test was used for all comparisons. Error bars, the mean ± SEM. ns, not significance; *P < 0.05; **P < 0.01; ***P < 0.001. Source data are provided as a Source Data file. Exact p values are provided in the Source Data file.
Fig. 2
Fig. 2. Gal-3 promotes angiogenesis by binding to integrin α5β1 and potentiating its activation.
A Quantifications of HMEC-1 cell migration (left) and tube formation (right) induced by recombinant Gal-3 under an insulin-resistant state (treated with serum-free medium containing 100 nM insulin for 24 h) were shown (n = 4 biological replicates each group). -, normal state; +, insulin-resistant state. B RT-qPCR analysis of VEGFA, FGF2, and HGF in HMEC-1 cells treated with the indicated concentration of recombinant Gal-3 for 12 h. Relative expression levels were normalized to ACTB (n = 3 biological replicates each group). C Heatmap of proteomic abundance (normalized using Z-score) of the top 5 Gal-3-interacting proteins in skin endothelial cells from healthy donors (dataset PXD019909, ProteomeXchange). D HMEC-1 cell migration (left) (n = 4 biological replicates) and tube formation (right) (n = 3 biological replicates) induced by recombinant Gal-3 with knockdown of Catenin α-1 or integrin β1. E GST pull-down assays. HMEC-1 cell lysate was incubated with GST or GST-Gal-3 and pulled down with GS beads (left panel); cells were treated with GST or GST-Gal-3 at 4 °C for 1 h, cross-linked, lysed and pulled down with GS beads (right panel). GST served as a negative control. Immunoblot analysis of integrin β1 was shown. F Recombinant Gal-3-induced migration of HMEC-1 cells with integrin β1-targeting shRNAs or non-targeting shRNA (shscr) (n = 3 biological replicates each group). G Recombinant Gal-3-induced migration of HMEC-1 cells incubated with integrin β1 functional blocking antibody (TDM29, 10 µg/mL) or IgG control (left). Quantifications were shown (n = 3 biological replicates each group). Scale bar, 500 μm. H Schematic diagram of the α subunit partnering with the integrin β1 subunit created in BioRender. Chen, S. (2025) https://BioRender.com/p10vue6. Among the 12 α subunits, α3, α5, and α6 subunits were detected by the mass spectrometry analysis in the His-Gal-3 immunoprecipitation assay performed in HMEC-1 cells (see Supplementary Fig. 2J). I GST pull-down assays. HMEC-1 cell lysate was incubated with GST or GST-Gal-3 and pulled down with GS beads (left panel); cells were treated with GST or GST-Gal-3 at 4 °C for 1 h, cross-linked, lysed and pulled down with GS beads (right panel). GST served as a negative control. Immunoblot analysis of integrin α5, integrin α6 and integrin α3 was shown. J Recombinant Gal-3 induced migration of HMEC-1 cells incubated with integrin α5 functional blocking antibody P1D6 (10 µg/mL) (n = 3 biological replicates each group). K Recombinant Gal-3-induced migration of HMEC-1 cells that were pre-incubated with integrin α5β1 antagonist ATN-161 (100 nM) for 48 h (n = 5 biological replicates each group). L, Immunoblot analysis of the phosphorylation of integrin β1 (p-integrin β1, Ser783) in HMEC-1 cells that were incubated with recombinant Gal-3 (10 μg/mL). Relative expression levels were normalized to integrin β1, and quantifications were shown below the blots. M Immunoblot analysis and quantifications of p-integrin β1 in wounds of diabetic mice that i.c. injected with OE-Gal-3 adenovirus or Veh. Relative expression levels were normalized to integrin β1 (n = 3 biological replicates each group). All statistical data points are represented as means ± SEM. P values were determined by unpaired two-tailed Student’s t-test (A, B, D, F, G, J, K, M) or one-way ANOVA with Fisher’s LSD post hoc test (B, D, F). Error bars mean ± SEM. *P < 0.05; **P < 0.01; ***P < 0.001. Source data are provided as a Source Data file. Exact p values are provided in the Source Data file.
Fig. 3
Fig. 3. Blockage of integrin α5β1-FAK pathway inhibits the beneficial effect of Gal-3 on diabetic wound healing.
AE STZ-induced diabetic rats were i.c. injected with lgals3 adenovirus or control virus (Veh) after wounding, followed by treatment with integrin β1 functional blocking antibody (Anti-β1) or IgG control (IgG). A Representative images of the wounds (left) and percentage of wound closure (right) (n = 5). B H&E staining of healed wounds. The distance between the first and second yellow dotted lines represents epidermis thickness (red arrows), and the distance between the second and third yellow dotted lines represents granulation thickness (black arrows). Quantifications of the epidermis and granulation thickness were shown on the lower (n = 5). Scale bar, 500 µm. C Picrosirius red staining showing COL1 and COL3 in healed wound under polarized light. Quantifications of COL1 area percentage and total COL1 and COL3 area were shown on the right (n = 5). Scale bar, 50 µm. D Immunohistochemical staining of CD31 that marked microvessels (black arrows) in healed wounds. Quantifications of microvessel count per field were shown on the right (n = 5). Scale bar, 50 µm. E Immunoblot analysis and quantifications of CD31 in healed wounds (n = 5). F,G STZ-induced diabetic rats were i.c. injected with shRNA targeting integrin α5 (shα5) or non-targeting shRNA (shscr) 2 weeks before wounding, following i.c. injected with recombinant lgals3 adenovirus (OE-Gal-3) or control virus (Veh). Normal rats (Normal) were set as negative control. F COL1 and COL3 in picrosirius red staining in healed wounds. Quantifications of COL1 area percentage and total COL1 and COL3 area were shown (n = 5). Scale bar, 50 µm. G Immunohistochemical staining of CD31 (black arrows) in healed wounds. Quantifications of microvessel count per field were shown on the right (n = 5). Scale bar, 50 µm. H Recombinant Gal-3-induced migration of HMEC-1 cells treated with FAK inhibitor (25 μM), Src-inhibitor (1 μM) or IKK inhibitor (0.5 μM) for 48 h. (Veh, n = 5 biological replicates; FAK inhibitor, n = 3 biological replicates; Src-inhibitor, n = 5 biological replicates; IKK inhibitor, n = 5 biological replicates). I Immunoblot analysis of the phosphorylation of FAK (p-FAK, Y397) in HMEC-1 cells treated with recombinant Gal-3 (10 µg/mL). p-FAK levels were normalized to FAK. Quantifications were shown below the blots. J Recombinant Gal-3-induced tube formation of HMEC-1 cells treated with FAK inhibitor (FAKi, 25 μM), (n = 4 biological replicates). K Immunoblot analysis (upper) and quantifications (lower) of p-FAK in HMEC-1 cells treated with si-integrin β1 (si-β1) or negative control. p-FAK levels were normalized to FAK (n = 3 biological replicates). L, M HFD/STZ mice were i.c. injected with recombinant lgals3 adenovirus (OE-Gal-3) or control virus (Veh) after wounding, followed by treatment with FAKi (OE-Gal-3+ FAKi, 15 µM, 100 µL/mouse) or vehicle once every two days. L COL1 and COL3 in picrosirius red staining in healed wounds (left). Quantifications of COL1 area percentage and total COL1 and COL3 area (right). Scale bar, 50 µm. M Immunohistochemical staining and quantifications of CD31 (black arrows) in healed wounds. (n = 3, two sections per mouse). Scale bar, 50 µm. All statistical data are presented as means ± SEM. P values were determined by unpaired two-tailed Student’s t-test (AH, JM) or one-way ANOVA with Fisher’s LSD post hoc test (H). Error bars mean ± SEM of each group. *P < 0.05; **P < 0.01; ***P < 0.001. Source data are provided as a Source Data file. Exact p values are provided in the Source Data file.
Fig. 4
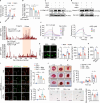
Fig. 4. Gal-3 binds to integrin α5β1 to induce liquid-liquid phase separation that promotes in vitro angiogenesis.
A Confocal microscopy of integrin α5 segregation in HMEC-1 cells treated with recombinant Gal-3 (1.65 µM) plus lactose (10 mM). An enlarged view of the boxed region shows clusters on the cell membrane (red arrows). Quantifications of cluster number per cell (left to right, n = 5, 6, 5 fields; total number of cells were 50-90 in each group). Scale bar, 20 µm. B, C Condensates formed with the GFP-Gal-3 (80 µM), GFP-Gal-3 (80 µM) + integrin β1 (400 nM) mixture, GFP-Gal-3 (80 µM) + integrin β1 (400 nM) mixture plus lactose (20 mM), and GFP-Gal-3 (80 µM) + CD146 (400 nM) mixture in PBS (pH 7.4), respectively. B Fluorescence microscopy images of the condensates (red arrows) and quantifications of condensates’ number and diameter in each microscope field (n = 5 biological replicates). Scale bar, 10 µm. C Solution turbidity for the indicated mixtures measurements by UV-vis spectrophotometry (n = 3 biological replicates each group). D, E Condensates formed with the GFP-Gal-3 (80 µM), GFP-Gal-3 (80 µM) + integrin α5β1 (400 nM) mixture, GFP-Gal-3 (80 µM) + integrin α5β1 (400 nM) mixture plus lactose (20 mM), and GFP-Gal-3 (80 µM) + CD146 (400 nM) mixture in PBS (pH 7.4). D Fluorescence microscopy images of the condensates and quantifications of condensates’ number, and diameter of each microscope field were shown (n = 5 biological replicates). Scale bar, 10 µm. E Solution turbidity for the mixtures (left to right, n = 3, 4, 3, 3 biological replicates). F Solution turbidity for the mixtures formed with Gal-3 (0 µM, 10 µM, 20 μM, 40 µM, 80 µM and 100 µM) and integrin α5β1 (400 nM) (n = 3 biological replicates). G Fluorescence Recovery After Photobleaching (FRAP) analysis of droplets formed with GFP-Gal-3 (80 µM) and integrin β1 (400 nM), integrin α5β1 (400 nM) or CD146 (400 nM), respectively. Representative confocal microscopy images (left) and normalized fluorescence intensity (right) after bleaching were shown (n = 5, 4, 5 independent measurements, respectively). H Condensates formed with the GFP-Gal-3 (80 µM) and integrin α5β1 (400 nM) in PBS (pH 7.4) had their N-glycans removed by PNGase. Fluorescence microscopy images of the condensates and quantifications of condensates’ number, and diameter of each microscope field (n = 4 biological replicates). Scale bar, 10 µm. I Confocal microscopy of Gal-3 (3.3 µM, containing 0.8 µM GFP-Gal-3 and 2.5 µM Gal-3) induced condensates in CHO-K1 cells expressing the mCherry-integrin α5, with or without 1, 6-hexanediol (1, 6-HD) (1.5%, 2 min). An enlarged view of the boxed region was shown on the right, with cross-sectional fluorescence intensity profiles along the white dotted line in histograms demonstrating the correlation between the two signals. Quantifications of the size and the number of the condensates per cell were shown (upper, n = 5, 5, 5 fields; lower, n = 5, 5, 4 fields, total number of cells were 60-70 in each group). Scale bar, 20 μm. J FRAP measurements. The co-localized Gal-3/integrin α5 condensates in living cells were randomly selected for bleaching (upper panel). Enlarged views of the boxed region were shown. Representative confocal microscopy images (middle panel) and normalized fluorescence intensity (lower panel) after bleaching (n = 5 independent measurements). Scale bar, 10 μm. K Immunoblot analysis and quantifications of the phosphorylation of FAK (p-FAK, Y397) in HMEC-1 cells treated with Gal-3 (0.33 µM, 15 min) together with PBS, lactose (4 mM), or 1, 6-HD (1.5%, 2 min) in the indicated group (n = 6, 5, 6, 6 biological replicates). L Confocal microscopy of Gal-3 (3.3 µM, containing 0.8 µM GFP-Gal-3 and 2.5 µM Gal-3) induced condensates in CHO-K1 cells co-expressing mCherry-integrin α5 and mTagBFP2-CD146 treated with lactose (10 mM), sucrose (10 mM) or 1, 6-HD (1.5%, 2 min). Enlarged views of the boxed region were shown with corresponding cross-sectional fluorescence intensity profiles along the white dotted line in histograms demonstrating the correlation between the three signals. Quantifications of the size and number of the condensates per cell were shown (n = 5 fields, total number of cells was 40–80 in each group). Scale bar, 20 μm. M Recombinant Gal-3-induced tube formation in HMEC-1 cells treated with siRNA targeting integrin β1 or CD146 (n = 3 biological replicates). All statistical data are presented as means ± SEM. P values were determined by unpaired two-tailed Student’s t test (A, H, M), one-way ANOVA with Fisher’s LSD post hoc test (C, E, F, K), two-sided Mann-Whitney U test (I, L) or Kruskal–Wallis test with Dunn’s post hoc test (B, D). Error bars mean ± SEM of each group. *P < 0.05; **P < 0.01; ***P < 0.001. Source data are provided as a Source Data file. Exact p values are provided in the Source Data file.
Fig. 5
Fig. 5. AGEs suppress Gal-3-mediated angiogenesis by inhibiting Gal-3-integrin α5β1 interaction.
A Tube formation induced by recombinant Gal-3 in HUVECs with diabetic or non-diabetic patient serum (7.5%, v/v) (Non-DM, n = 5; DM, n = 6 biological replicates). B Recombinant Gal-3-induced tube formation in HUVECs treated with different concentrations of BSA-conjugated AGEs (0, 1, 10, 100 µg/mL) was normalized to the group treated with the corresponding concentration of BSA alone (n = 3 biological replicates). C Immunoblot analysis of phosphorylated-integrin β1 (p-integrin β1) in HMEC-1 cells with Gal-3 (0.33 µM) in the presence or absence of BSA (1.98 µM) or AGEs (1.98 µM). Quantifications were shown below the blots. D Pull-down assays. HMEC-1 cell lysates (100 μg) were pulled down with His-Gal-3 in the presence or absence of BSA or AGEs, the molar ratio of Gal-3 with BSA or AGEs was 1:6. Immunoblot analysis and quantifications of integrin β1 were shown. E Chemical shift changes (Δδ) from these HSQC spectra of Gal-3 and integrin β1. 1H-15N HSQC spectral expansions for 15N-enriched Gal-3 (20 μM) in the presence of integrin β1 (0.4 μM), plus AGEs (0.4 μM, lower panel). F Bio-Layer interferometry (BLI) analysis of Gal-3-integrin β1 affinity. His-integrin β1 interacted with Gal-3 (200, 400, 600, 800, 1000, 1200, 1400 nM) (left) or Gal-3 (1.4 µM), respectively, plus different concentrations of AGEs (0, 11.2, 22.4, 44.8 µM) (right) at 25 °C. G Representative fluorescence images of condensates formed with GFP-Gal-3 (40 µM) plus BSA or AGEs (240 µM), GFP-Gal-3 (40 µM) + integrin β1 (400 nM) mixture plus BSA or AGEs (240 µM) in PBS (pH 7.4). Quantifications of condensates’ number and diameter in each microscope field were shown (n = 4 biological replicates). Scale bar, 10 µm. H Particle size of condensates formed by Gal-3 (40 µM) and integrin β1 (400 nM) plus BSA (240 µM) or AGEs (240 µM) in PBS (pH 7.4) (n = 3 biological replicates). I Confocal microscopy of GFP-Gal-3 (3.3 µM) induced condensates in CHO-K1 cells expressing mCherry-integrin α5 with treatment of BSA (19.8 µM) or AGEs (19.8 µM). The cell indicated by the white arrow was enlarged. Quantifications of the size and the number of the condensates per cell were shown (upper, left to right, n = 5, 6, 6, 5 fields; lower, n = 5 fields; total number of cells were 50–80 in each group). Scale bar, 20 μm. J, K STZ-induced diabetic rats were treated with hydrogels embedded AGEs inhibitor (DM + AGEi) or vehicle (DM + Veh) after wounding. Normal rats treated with blank hydrogels (Normal + Veh) served as the negative control. J Representative images of wounds and percentage of wound closure (n = 6). K Immunohistochemical staining of CD31(black arrows) in healed wounds. Quantifications of microvessel count per field were shown on the right (left to right, n  =  6, 7, 5). Scale bar, 50 µm. All statistical data are presented as means ± SEM. P values were determined by unpaired two-tailed Student’s t test (A, G, H, J, K), one-way ANOVA with two-sided Fisher’s LSD post hoc test (B) or two-sided Mann–Whitney U test (I). Error bars represent the mean ± SEM of each group. *P < 0.05; **P < 0.01; ***P < 0.001. Source data are provided as a Source Data file. Exact p values are provided in the Source Data file.
Fig. 6
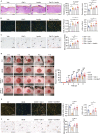
Fig. 6. Hydrogels loaded with Gal-3 promote diabetic skin wound healing in vivo.
AC STZ-induced diabetic rats received saline (Veh), recombinant Gal-3 (2 μg/rat), insulin (0.1 U/rat) or recombinant Gal-3 (2 μg/rat) + insulin (0.1 U/rat) after wounding. A H&E staining of healed wounds. The distance between the first and second yellow dotted lines represents epidermis thickness (red arrow), and the distance between the second and third yellow dotted lines represents granulation thickness (black arrow). Quantifications of the epidermis and granulation thickness were shown on the right (n = 6). Scale bar, 500 µm. B Picrosirius red staining showing COL1 and COL3 in healed wound under polarized light. Quantifications of COL1 area percentage and total COL1 and COL3 area were shown on the right (n = 6). Scale bar, 50 µm. C Immunohistochemical staining of CD31 that marked microvessels (black arrows) in healed wounds. Quantifications of microvessel count per field were shown on the right (n = 6). Scale bar, 50 µm. DF STZ-induced db/db diabetic mice treated with hydrogels embedded with saline (db/db), Gal-3 (db/db + Gal-3) and Comfeel® (db/db + Comfeel®) after wounding. Normal mice treated with blank hydrogels (WT) served as the negative control. D Representative images of the wound and percentage of wound closure (WT, n = 7; db/db, n = 7; db/db + Gal-3, n = 8; db/db + Comfeel®, n = 8). E Picrosirius red staining showing COL1 and COL3 in the healed wound. Quantifications of COL1 area percentage and total COL1 and COL3 area were shown on the right (WT, n = 6; db/db, n = 6; db/db + Gal-3, n = 8; db/db + Comfeel®, n = 7). Scale bar, 50 µm. F Immunohistochemical staining of CD31 (black arrows) in healed wounds. Quantifications of microvessel count per field were shown (WT, n = 7; db/db, n = 6; db/db + Gal-3, n = 8; db/db + Comfeel®, n = 8). Scale bar, 50 µm. All statistical data are presented as means ± SEM. P values were determined by one-way ANOVA with Fisher’s LSD post hoc test (AC, E, F) and two-way ANOVA with Dunnett’s multiple comparisons test (D). Error bars mean ± SEM of each group. *P < 0.05; **P < 0.01; ***P < 0.001; ****P < 0.0001. Source data are provided as a Source Data file. Exact p values are provided in the Source Data file.
Fig. 7
Fig. 7. Working model illustrating the effects and mechanisms of Gal-3 in the regulation of angiogenesis and diabetic wound healing.
In circulation, Gal-3 directly interacts with integrin α5β1 via glycans in vascular endothelial cells, forming a liquid-liquid phase separation, activating downstream FAK, ultimately promoting angiogenesis and skin wound healing. In diabetic states, accumulated AGEs bind to Gal-3, blocking the activation of the integrin α5β1-FAK axis, resulting in reduced angiogenesis and delayed skin wound healing. This figure was created in BioRender. Chen, S. (2025) https://BioRender.com/4tkiilw.

References

    1. McDermott, K., Fang, M., Boulton, A. J. M., Selvin, E. & Hicks, C. W. Etiology, epidemiology, and disparities in the burden of diabetic foot ulcers. Diab Care46, 209–221 (2023). - PMC - PubMed
    1. Walsh, J. W., Hoffstad, O. J., Sullivan, M. O. & Margolis, D. J. Association of diabetic foot ulcer and death in a population-based cohort from the United Kingdom. Diabet. Med33, 1493–1498 (2016). - PubMed
    1. Dixon, D. & Edmonds, M. Managing diabetic foot ulcers: pharmacotherapy for wound Healing. Drugs81, 29–56 (2021). - PubMed
    1. Shaabani, E. et al. Gene therapy to enhance angiogenesis in chronic wounds. Mol. Ther. Nucleic Acids29, 871–899 (2022). - PMC - PubMed
    1. Sharma, A., Sharma, D. & Zhao, F. Updates on recent clinical assessment of commercial chronic wound care products. Adv. Health Mater.12, e2300556 (2023). - PMC - PubMed

MeSH terms

LinkOut - more resources