. 2025 Aug 7;16(1):7271.
doi: 10.1038/s41467-025-61822-x.

Integrative multi-omics reveals a regulatory and exhausted T-cell landscape in CLL and identifies galectin-9 as an immunotherapy target

Affiliations

Integrative multi-omics reveals a regulatory and exhausted T-cell landscape in CLL and identifies galectin-9 as an immunotherapy target

L Llaó-Cid et al. Nat Commun. .

Abstract

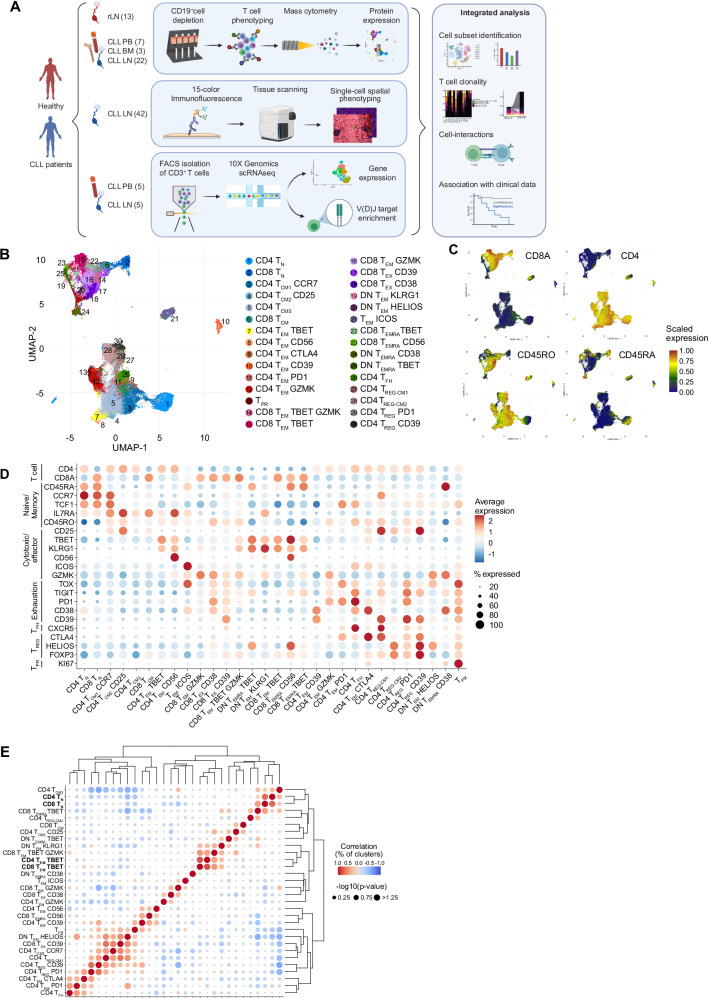
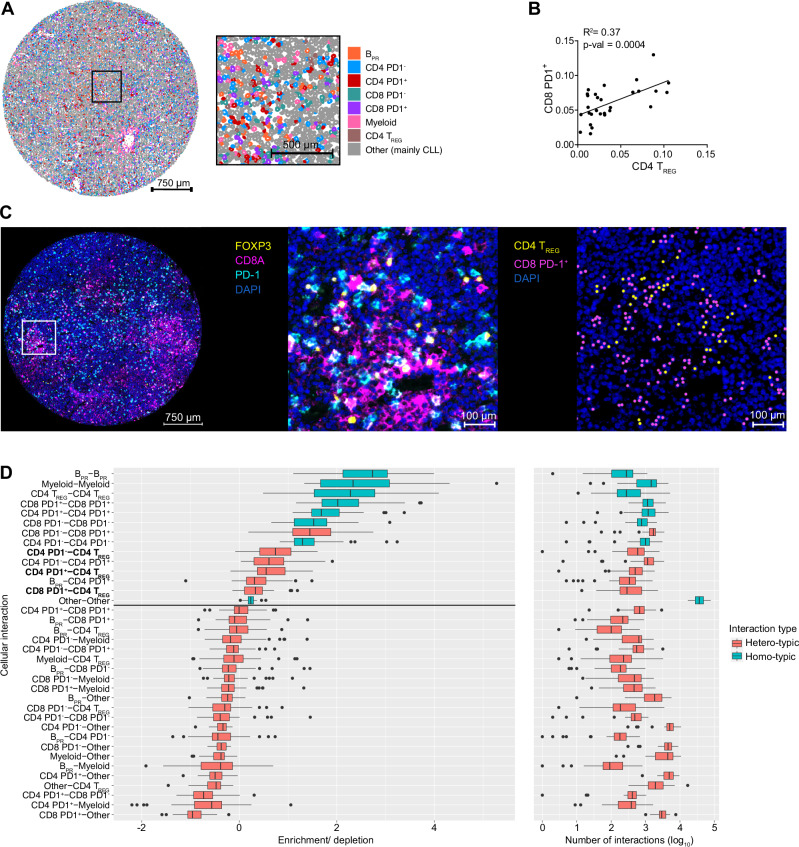
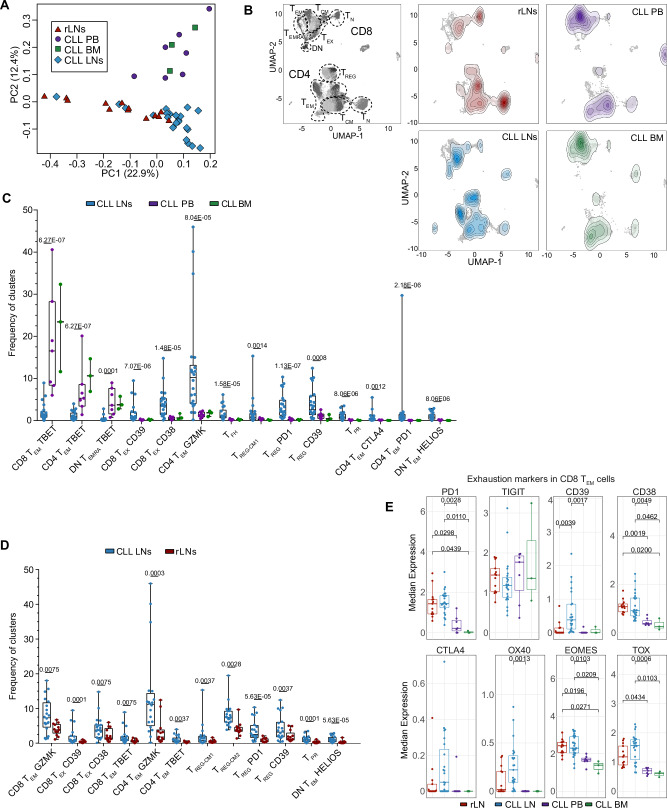
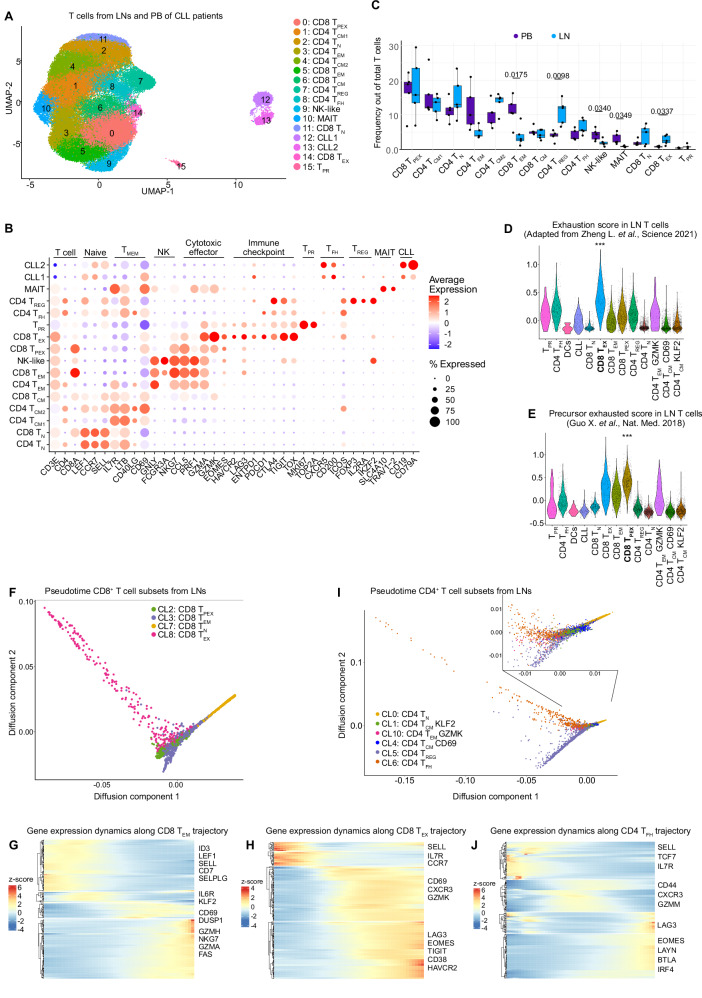
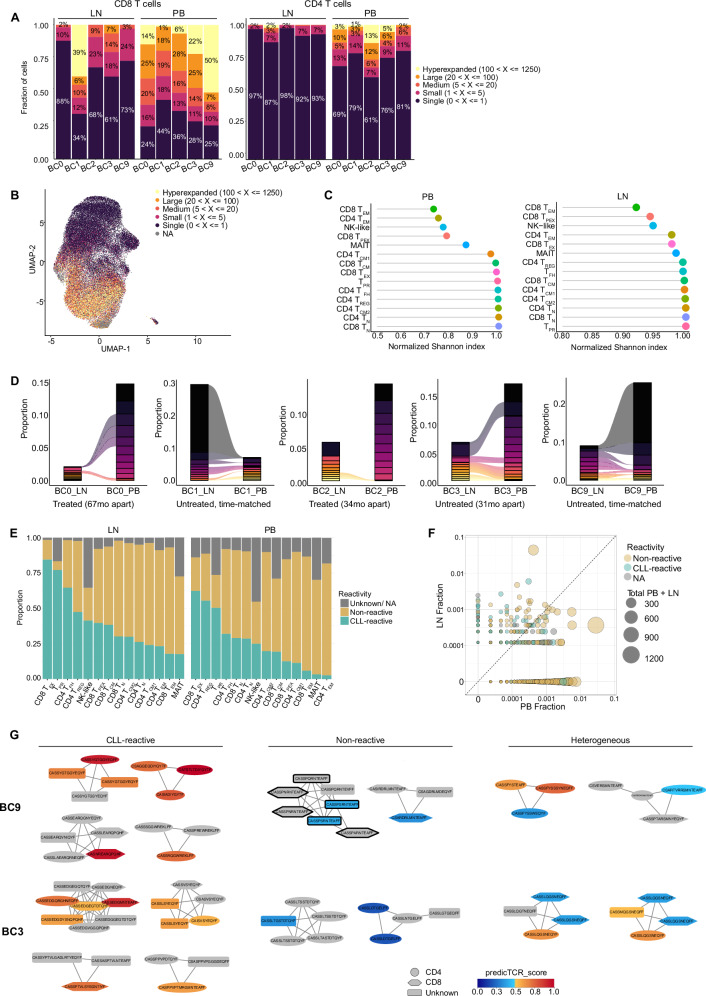
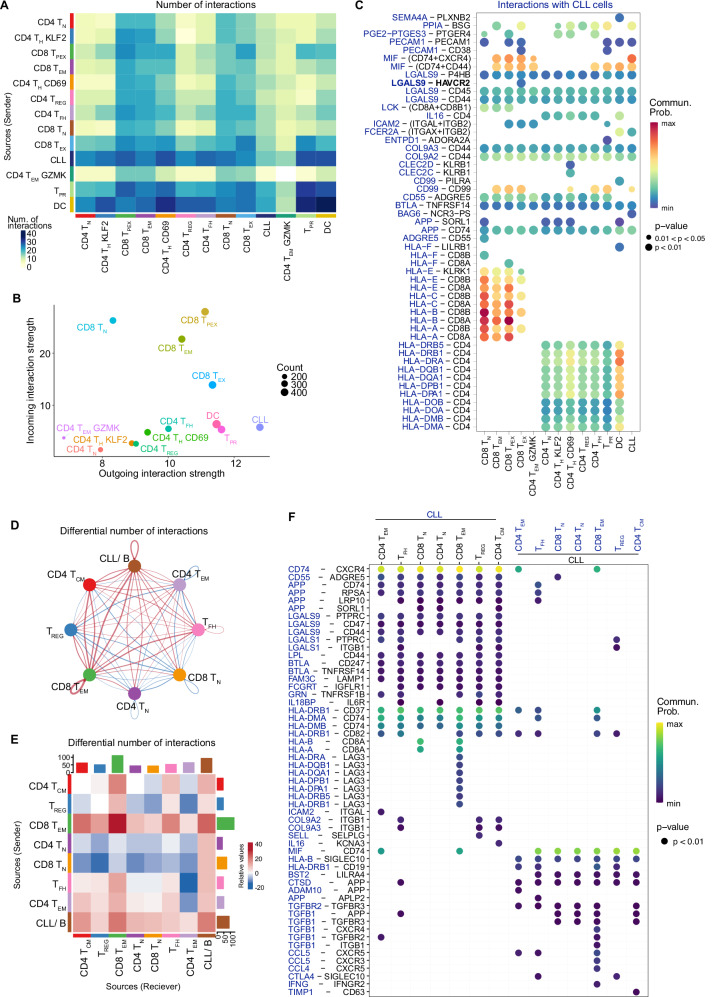
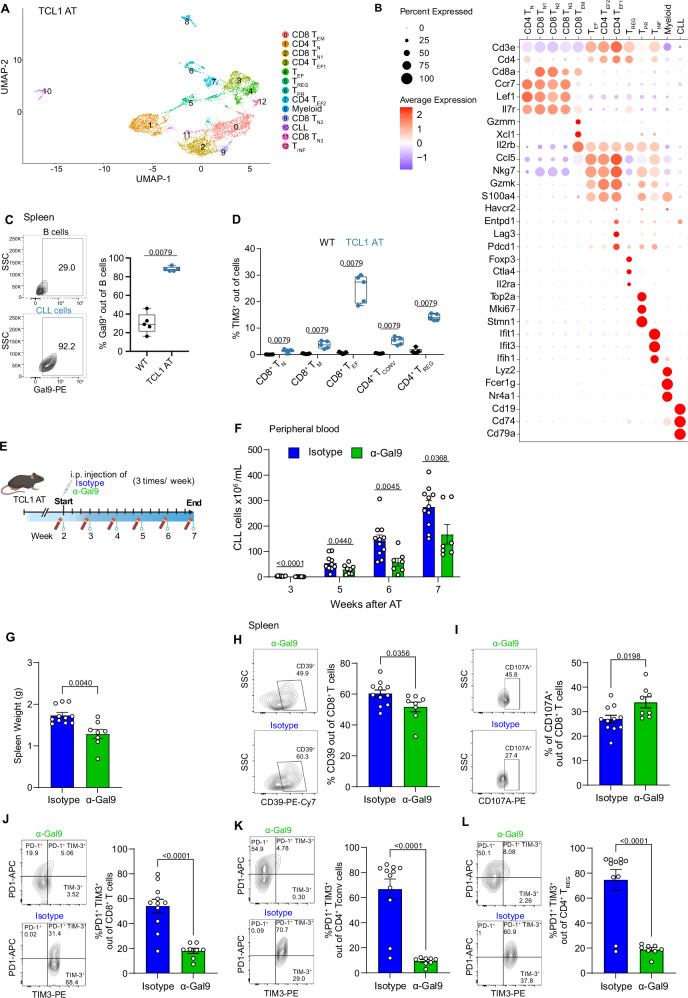
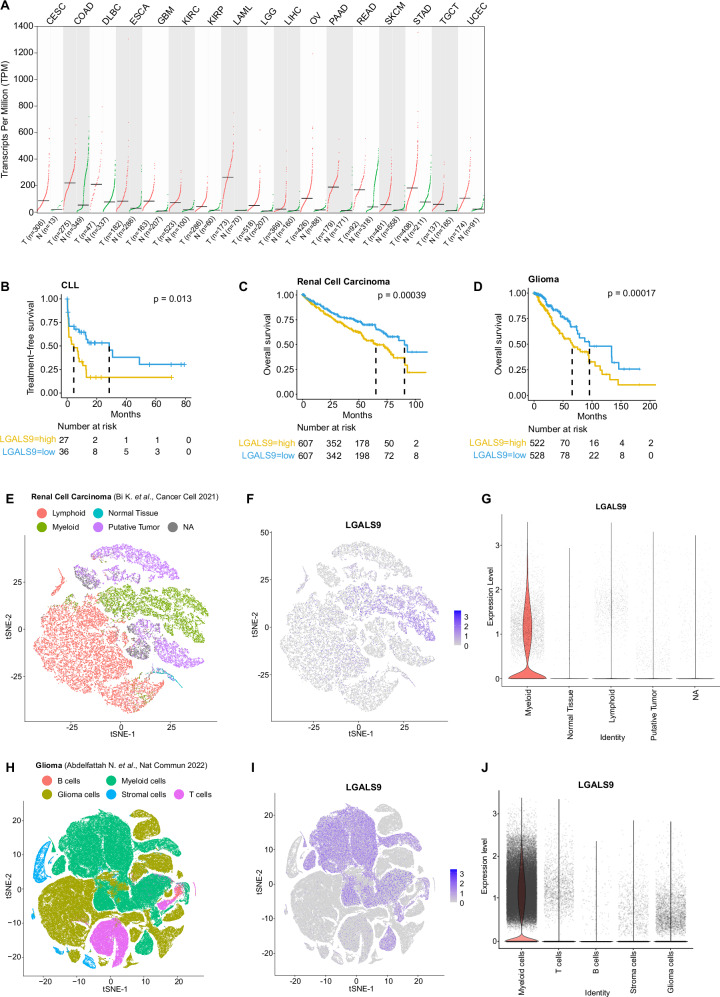
T-cell exhaustion contributes to immunotherapy failure in chronic lymphocytic leukemia (CLL). Here, we analyze T cells from CLL patients' blood, bone marrow, and lymph nodes, as well as from a CLL mouse model, using single-cell RNA sequencing, mass cytometry, and tissue imaging. T cells in CLL lymph nodes show the most distinct profiles, with accumulation of regulatory T cells and CD8+ T cells in various exhaustion states, including precursor (TPEX) and terminally exhausted (TEX) cells. Integration of T-cell receptor sequencing data and use of the predicTCR classifier suggest an enrichment of CLL-reactive T cells in lymph nodes. Interactome studies reveal potential immunotherapy targets, notably galectin-9, a TIM3 ligand. Inhibiting galectin-9 in mice reduces disease progression and TIM3+ T cells. Galectin-9 expression also correlates with worse survival in CLL and other cancers, suggesting its role in immune evasion and potential as a therapeutic target.


Conflict of interest statement

Competing interests: D.S. reports funding from GSK and received fees/honoraria from Immunai, Noetik, Alpenglow and Lunaphore. K.B. reports fees from Lunaphore. C.L.T. and E.W.G. hold patents and PCT applications describing methods to identify tumor-reactive T cells, and are founders or employees of Tcelltech GmbH. All other authors declare no competing interests.

Figures

Fig. 1
Fig. 1. Profiling of the T-cell landscape in CLL tissues at the single-cell resolution.
A Graphical overview of the study design. Mass cytometry analyses were performed on 13 reactive lymph node (rLN), 7 CLL peripheral blood (PB), 3 CLL bone marrow (BM), and 22 CLL LN samples, 15-color multiplex immunostaining was applied in an additional data set of 42 CLL LNs, and 5 paired CLL LN and PB samples were analyzed using scRNA-seq and TCR-seq. Created in BioRender. Zapatka, M. (2025) https://BioRender.com/deezga2. B UMAP plot of 5.2 ×10⁶ CD3+ T cells from 13 rLN, 7 CLL PB, 3 CLL BM and 22 CLL LN samples analyzed by mass cytometry identifying 30 clusters, including 15 for CD4+ T cells, 9 for CD8+ T cells, 2 clusters containing both CD4+ and CD8+ T cells, and 4 CD4 and CD8-double-negative (DN) T cells. C Projection of a selection of protein markers identifying T-cell states. Cells are colored based on the normalized protein expression. D Dot plot of the expression of marker genes in the 30 cell clusters. E Heatmap showing the Pearson correlation coefficient and its associated p-value of cell subset proportions from the 20 CLL LN samples (excl. 2 duplicates), corresponding to the worst performing subset (for which the p-value was the highest) of all leave-one-out patient sample sets. Source data are provided as a Source Data file Fig1.
Fig. 2
Fig. 2. PD1+ T cells reside in close proximity to CD4 TREG cells in CLL LNs.
A Representative CLL LN-derived tissue core stained with 15-color Orion multiplex with cells colored according to subset identification indicated in the legend (a total of 42 LN cores from 29 CLL patients were stained). CLL cells are displayed as BPR: Ki-67+ proliferating B cells, and Other: mainly non-proliferating B cells. B Pearson correlations of PD1+ CD8+ T cells and CD4+ TREG frequencies determined by multiplex staining of 42 CLL LN cores. Each dot represents an individual patient. C Representative CLL LN-derived tissue core (left image) and field of view (middle image) displaying FOXP3 (yellow), CD8A (pink), PD-1 (light blue), and DAPI (blue) staining (a total of 42 LN cores from 29 CLL patients were stained). The right image displays cells identified as CD4 TREG and CD8 PD-1+ T cells in yellow and purple dots, respectively. D Boxplots (left) depicting the range of enrichment of pairwise interacting cell types for all cores (n = 42). Boxplots (right) showing the absolute number of interactions in log10 scale between pairwise interacting cell types across all cores. Boxplots depict the median, the first and third quartile and whiskers extend until 1.5*IQR. Any points beyond the whiskers are outliers and plotted individually. Boxplots are colored by type of interaction, between the same cell type (homotypic, blue) or different cell types (heterotypic, red). Enriched heterotypic interactions with CD4 TREG are marked in bold. Source data are provided as a Source Data file Fig2.
Fig. 3
Fig. 3. The T-cell composition of CLL LNs is distinct and enriched in regulatory and exhausted subsets.
A Principal component analysis of all samples analyzed by mass cytometry based on cell subset frequencies. B UMAP plots of T cells from rLNs, CLL PB, CLL LNs, and CLL BM overlaid with a contour plot indicating the cell density. A UMAP plot indicating the main T-cell clusters is provided on the left. C Boxplot showing cell subset abundances out of total T cells in LNs (n = 20), PB (n = 7), and BM (n = 3) of CLL patients. D Boxplot showing cell subset abundances out of total T cells in CLL LNs (n = 20) and rLNs (n = 13). E Median expression of PD1, TIGIT, CD39, CD38, CTLA4, OX40, EOMES, and TOX markers in CD8 TEM cells per sample in LNs (n = 20), PB (n = 7), BM (n = 3) samples of CLL patients and rLN samples (n = 13) of healthy individuals. Boxplots represent the 25th to 75th percentiles with the median as the central line, whiskers indicate minimal and maximal value. Each symbol represents an individual patient sample. Statistical significance was tested using limma on normalized cell counts, with p-values adjusted for multiple comparisons using the Benjamini–Hochberg method (C, D), or the Kruskal–Wallis test with Bonferroni correction (E). Only significant p-values (p < 0.05) are shown. Source data are provided as a Source Data file Fig3.
Fig. 4
Fig. 4. Single-cell RNA-seq defines T-cell states in CLL LNs.
A UMAP plot of 61,040 cells from paired LNs and PB samples of 5 CLL patients analyzed by scRNA-seq identifying 16 clusters, 6 CD4+ T-cell clusters, 5 CD8+ T-cell clusters, 1 cluster of proliferating CD4+ and CD8+ T cells, 1 cluster of MAIT cells, 1 cluster of NK-like cells, and 2 clusters of CLL cells which were spiked in. B Dot plot of the expression of marker genes in the 16 cell clusters. C Frequency of cell subset out of total T cells, from PB (n = 5) and LN (n = 5) samples of CLL patients. A box plot represents the 25th to 75th percentiles and the mean, with dots corresponding to samples. D-I) LN samples were clustered and analyzed separately, identifying 13 clusters of T cells and CLL cells (see Supplementary Fig. 6A, B). D, E Violin plot of average expression levels in LN T-cell subsets of the slightly adapted exhaustion gene signature derived from Zheng et al. (D), and the precursor exhaustion gene signature derived from Guo et al. (E). Stars indicate that the CD8 TEX (D) and CD8 TPEX (E) subsets have statistically significantly higher signature scores compared to all other subsets (see Supplementary Data 5). F Pseudotime trajectory across the 4 CD8+ T-cell subsets identified in LNs. G, H Heatmap showing genes with significant expression changes along the trajectory from CD8 TN to CD8 TEM (G), and from CD8 TN to CD8 TEX (H). Color represents z-scores. I Pseudotime trajectory across the 6 CD4+ T-cell subsets identified in LNs. J Heatmap showing genes with significant expression changes along the trajectory from CD4 TN to CD4 TFH. Color represents z-scores. Statistical significance was tested by two-sided unpaired t test (C) and two-sided Wilcoxon rank sum test (D, E). Only significant p-values (p < 0.05) are shown. Source data are provided as a Source Data file Fig4.
Fig. 5
Fig. 5. TCR analyses reveal increased tumor-reactive T cells in the LNs.
A Bar plot indicating the percentage (rounded values are indicated) of single, small, medium, large and hyperexpanded-sized clones in CD8+ (left) and CD4+ (right) T cells in LN and PB for each patient analyzed (n = 10). B UMAP plot colored according to the T-cell clone size based on the TCR-seq data. NA: no TCR information available. C Graph showing the TCR Shannon diversity index for each T-cell subset identified by scRNA-seq in PB and LN samples. The dot color corresponds to the UMAP cluster plot from Fig. 4A. D Alluvial plot displaying the top 10 most frequent clones for LN and PB. E Proportion of predicted CLL-reactive, non-reactive and unknown/ NA T-cell clonotypes out of total T cells in LN and PB. F Scatter plot shows LN and PB clone sizes from all 5 CLL patients. Color represents reactivity status and dot size the total number of cells per clonotype. G Left: Examples of large clusters of convergently recombined TCRs identified by GLIPH2 containing multiple CLL T-cell-derived TCRs predicted to be CLL-reactive (orange-red), as well as TCRs found in the LN or PB for which no scSEQ data and predicTCR scores were available (grey). Middle: Examples of TCR clusters called as non-CLL reactive (blue); in patient BC9 7 TCRs within the SP%RNTE_ANQS cluster are known to bind the HLA-B*07 restricted epitope of the CMV pp65 protein (bold black node border). Right: Examples of heterogeneous clusters. TCRs for which CD4/CD8 status could not be determined due to lack of scSEQ data are illustrated as rectangular nodes. Source data are provided as a Source Data file Fig5.
Fig. 6
Fig. 6. Interactome analyses predict a robust and disease-specific cross-talk of CLL and T cells in LNs including galectin-9 circuits.
A–C Cell-cell communication network was analyzed on scRNA-seq data from 5 CLL LNs using CellChat. A Heatmap depicting the number of interactions between cell subsets in CLL LNs. B Scatter plot showing the dominant sender (X-axis) and receiver (Y-axis) cell subsets. C Heatmap plot depicting the list of significant ligand–receptor pairs between CLL cells (molecule in blue) and all the other cell subsets (molecule in black). The dot color and size represent the calculated communication probability and p-values, which are computed from one-sided permutation test. D–F Differential cell-cell communication networks between CLL LNs and rLNs were analyzed using CellChat. D Circle plot depicting the differential number of interactions between cell subsets in CLL LNs compared to rLNs. Thickness of bands represents the number of differential interactions between the two data sets, and increased interactions are depicted in red, decreased interactions in blue. E Heatmap plot showing the differential number of interactions of CLL LNs versus rLNs. Rows and columns represent cell subsets acting as sender and receiver, respectively. Bar plots represent the total outgoing (right) and incoming (top) interaction scores, respectively, for each cell subset. F Heatmap plot depicting a curated list of ligand–receptor pairs differentially upregulated in CLL LNs compared to rLNs as identified via CellChat. The dot color and size represent the calculated communication probability and p-values of differential communication, respectively. Significantly differentially upregulated ligand–receptor pairs were calculated via the Wilcoxon rank-sum test. The first 7 columns show interactions sent by CLL cells (molecule on CLL cells in blue), while the last 7 columns show interactions received by CLL cells (molecule on CLL cells in black). Source data are provided as a Source Data file Fig6.
Fig. 7
Fig. 7. Blocking of galectin-9 controls tumor growth in the TCL1 mouse model.
A UMAP plot of 6,201 cells from the spleens of 2 mice after adoptive transfer of TCL1 leukemia (TCL1 AT) analyzed by scRNA-seq identifying 13 clusters, including 11 T-cell clusters, CLL cells and myeloid cells. B Dot plot of the expression of marker genes in the 13 cell clusters. C Representative contour plot and percentage of galectin-9+ (Gal9+) B cells and CLL cells from spleen of wild-type control (WT; n = 5) and TCL1 AT (n = 5) mice, respectively. D Percentage of TIM3+ cells out of CD8 TN, CD8 TM (memory cells), CD8 TEF (effector cells), CD4 TCONV (conventional), and TREG T cells in spleen of WT (n = 5) and TCL1 AT (n = 5) mice measured by flow cytometry. E Schematic diagram of treatment of TCL1 AT mice with galectin-9-blocking antibody (α-Gal9). Analyses of T, myeloid and CLL cells were performed 7 weeks after treatment start in isotype antibody- (n = 11) and α-Gal9-treated (n = 8) mice. Created in BioRender. Floerchinger, A. (2025) https://BioRender.com/x4or7yz. F Absolute number of CD19+ CD5+ CLL cells in blood of isotype antibody- (n = 11) and α-Gal9-treated (n = 8) mice. G Spleen weight of isotype antibody- (n = 11) and α-Gal9-treated (n = 8) mice. H Representative contour plot and percentage of CD39+ cells out of CD8+ T cells from spleen of isotype antibody- (n = 11) and α-Gal9-treated (n = 8) mice. I Representative contour plot and percentage of CD107A+ out of CD8+ T cells from spleen of isotype antibody- (n = 11) and α-Gal9-treated (n = 8) mice. J–L Representative contour plot and percentage of PD1+ TIM3+ cells out of CD8+ T cells (J), CD4+ TCONV (K), and TREG (L) cells from spleen of isotype antibody- (n = 11) and α-Gal9-treated (n = 8) mice. Each symbol represents an individual mouse, and statistical significance was tested by two-sided unpaired t test with Welch approximation. Boxplots represent the 25th to 75th percentiles with the median as the central line, whiskers indicate minimal and maximal value (C, D), bars plots indicate mean ± SEM (FL). Source data are provided as a Source Data file Fig7.
Fig. 8
Fig. 8. Elevated galectin-9 expression correlates with poor survival in cancer patients.
A Differential expression of LGALS9 in tumor versus healthy tissue in CESC (Cervical squamous cell carcinoma and endocervical adenocarcinoma), COAD (Colon adenocarcinoma), DLCL (Diffuse large B cell lymphoma), ESCA (Esophageal carcinoma), GBM (Glioblastoma multiforme), KIRC (Kidney renal clear cell carcinoma), KIRP (Kidney renal papillary cell carcinoma), LAML (Acute Myeloid Leukemia), LGG (Brain Lower Grade Glioma), LIHC (Liver hepatocellular carcinoma), OV (Ovarian serous cystadenocarcinoma), PAAD (Pancreatic adenocarcinoma), READ (Rectum adenocarcinoma), SKCM (Skin Cutaneous Melanoma), STAD (Stomach adenocarcinoma), TGCT (Testicular Germ Cell Tumors), and UCEC (Uterine Corpus Endometrial Carcinoma) analyzed by the standard processing pipeline GEPIA2 with default cut-off settings. Statistical differences were assessed by limma model with adjusted p-values (Benjamini-Hochberg FDR). B Time-to-treatment in CLL patients with high or low galectin-9 protein levels (n = 63). Differences were assessed using Cox proportional hazard model. C, D Overall survival in renal cell carcinoma (C) and glioma (D) patients with high or low LGALS9 transcript levels. Differences in survival were assessed using Cox proportional hazard model with Benjamini-Hochberg correction. EJ Single-cell RNA-seq analysis of tumor samples in renal cell carcinoma (EG) and glioma (HJ). E, H UMAP plots identifying tumor, infiltrating immune cells and normal tissue cells from (E) 8 renal cell carcinoma patients, and (H) 9 glioma patients. F, I UMAP plot displaying LGALS9 expression. G, J Violin plots of LGALS9 expression in the different cell types. Source data are provided as a Source Data file Fig8.

Similar articles

References

    1. Ding, W. et al. Pembrolizumab in patients with CLL and Richter transformation or with relapsed CLL. Blood129, 3419–3427 (2017). - PMC - PubMed
    1. Xu-Monette, Z. Y., Zhou, J. & Young, K. H. PD-1 expression and clinical PD-1 blockade in B-cell lymphomas. Blood131, 68–83 (2018). - PMC - PubMed
    1. Cappell, K. M. et al. Long-term follow-up of anti-CD19 chimeric antigen receptor T-cell therapy. J. Clin. Oncol.38, 3805–3815 (2020). - PMC - PubMed
    1. Fraietta, J. A. et al. Determinants of response and resistance to CD19 chimeric antigen receptor (CAR) T cell therapy of chronic lymphocytic leukemia. Nat. Med.24, 563–571 (2018). - PMC - PubMed
    1. van Bruggen, J. A. C. et al. Chronic lymphocytic leukemia cells impair mitochondrial fitness in CD8(+) T cells and impede CAR T-cell efficacy. Blood134, 44–58 (2019). - PMC - PubMed

MeSH terms

LinkOut - more resources