. 2025 Aug 7;16(1):7291.
doi: 10.1038/s41467-025-62101-5.

Urinary Complement proteome strongly linked to diabetic kidney disease progression

Affiliations

Urinary Complement proteome strongly linked to diabetic kidney disease progression

Zaipul I Md Dom et al. Nat Commun. .

Abstract

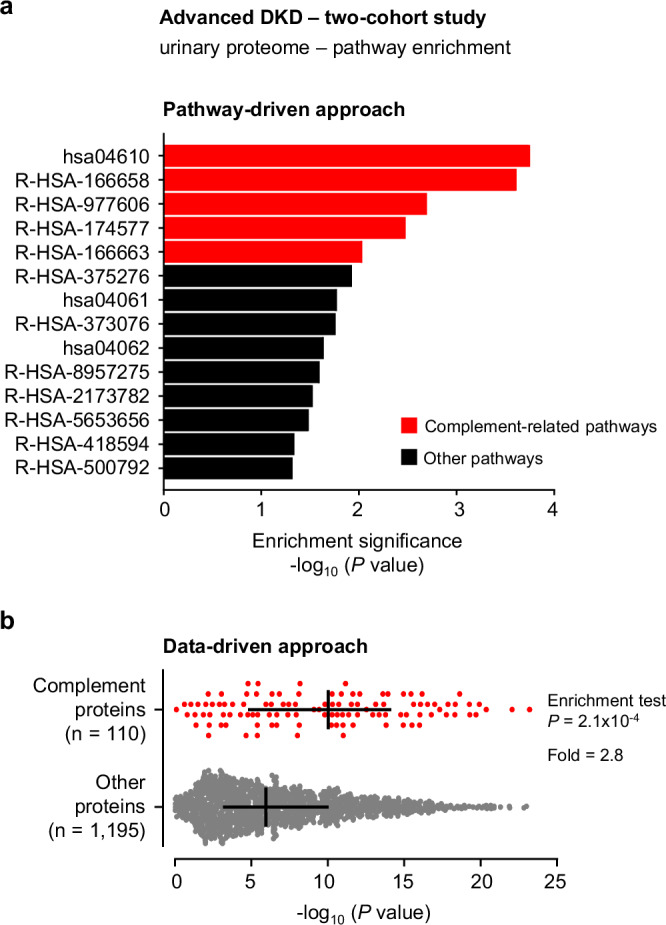
Diabetic kidney disease (DKD) progression is not well understood. Using high-throughput proteomics, biostatistical, pathway and machine learning tools, we examine the urinary Complement proteome in two prospective cohorts with type 1 or 2 diabetes and advanced DKD followed for 1,804 person-years. The top 5% urinary proteins representing multiple components of the Complement system (C2, C5a, CL-K1, C6, CFH and C7) are robustly associated with 10-year kidney failure risk, independent of clinical covariates. We confirm the top proteins in three early-to-moderate DKD cohorts (2,982 person-years). Associations are especially pronounced in advanced kidney disease stages, similar between the two diabetes types and far stronger for urinary than circulating proteins. We also observe increased Complement protein and single cell/spatial RNA expressions in diabetic kidney tissue. Here, our study shows Complement engagement in DKD progression and lays the groundwork for developing biomarker-guided treatments.


Conflict of interest statement

Competing interests: L.H.F. is an employee of and has an ownership interest in Fresenius Medical Care. M.A.N. has provided consulting to Otsuka, a member of the Educational Committee of the American Society of Nephrology and the Steering Committee of the Diabetic Foot Consortium. The remaining authors declare no competing interests.

Figures

Fig. 1
Fig. 1. Schematic representation of the study framework.
Our comprehensive study of the urinary Complement proteome comprised a two-cohort study of subjects with type 1 (n = 189) or type 2 diabetes (n = 115), and advanced DKD followed for kidney failure in 10 years. We employed advanced molecular phenotyping technologies to establish proteomics associations with prospective kidney outcomes, detailed biological relationships of our high-throughput proteomics data with the clinical and molecular phenotypes of diabetic kidney disease progression; we evaluated whether the associations extend to earlier DKD stages in a three-cohort study (n = 652) followed for up to 5 years. We investigated potential sources of increased Complement proteins in the urine by proteomics studies across three biofluid/tissue matrices and single-cell or spatial transcriptomics. DKD, diabetic kidney disease; T1D, type 1 diabetes; T2D, type 2 diabetes; GFR, estimated creatinine-based glomerular filtration rate; AA, African American; sc/snRNAseq, single-cell/single-nucleus RNA sequencing.
Fig. 2
Fig. 2. Urinary proteome associated with prospective kidney outcome is enriched in the Complement system. Analysis is performed in the advanced DKD two-cohort study.
a Pathway enrichment analysis performed using the DAVID Gene Functional Classification Tool shows the statistically significant pathways (P < 0.05). b Over-representation analysis using Fisher’s exact test detected enrichment in Complement proteins. The cross within each plot represents the median, 75th, and 25th percentile values. All P-values are two-sided. Source data are provided as a Source Data file.
Fig. 3
Fig. 3. Urinary Complement proteome and kidney failure risk by pathway in the advanced DKD two-cohort study.
a A comprehensive view of all proteins of the most enriched pathway (Complement system, 110 proteins) from among 1305 proteins measured by high-throughput proteomics. The needle plot depicts the strengths of associations representing P-values from the Cox proportional hazards models for developing kidney failure within 10 years in the two-cohort advanced DKD. One vertical needle represents P-value transformed to its base 10 logarithm from the diabetes type-adjusted model (base model), evaluating one creatinine-adjusted Complement protein at a time. Proteins are ordered on the x-axis by the pathway, the UniProt identifier (ID), and the protein name (to account for the fact that some proteins share the same UniProt ID; e.g., C5 and C5a). The top 5% Complement proteins are labeled. The gray line marks the threshold of significance at Bonferroni corrected α = 4.5 × 10−4. b A map of the Complement system pathways and vertical bar graphs of association strengths (as described in a) for pathways that include the top 5% Complement proteins. The top Complement proteins are indicated with red font on the bar graphs and on the pathway scheme. For a full list of the Complement system proteins and data-driven associations, please refer to the Supplementary Data 5. All P-values are two-sided. Figure 3b is created in BioRender, Md Dom, ZI. (2024) https://BioRender.com/l33k779. DKD, diabetic kidney disease. Source data are provided as a Source Data file.
Fig. 4
Fig. 4. Complement proteome associations with kidney failure development, their prognostic measures and biological insights into diabetic kidney disease progression in the advanced DKD two-cohort study.
a Forest plots and tabular form data showing the top 5% Complement proteins associated with 10-year kidney failure development in the two cohorts (n = 304) for base and clinically adjusted Cox proportional hazards models. The Base Model is controlled for diabetes type. Effect sizes (closed diamond symbols) with corresponding 95% confidence intervals (horizontal bars) are shown per one tertile change in the urinary creatinine-adjusted Complement protein distribution. b Correlations of urinary Complement proteome with clinical legacy measures (needle plot). The order and colors of the needles follow the pathway annotation of the Fig. 3a. The Height of one needle represents a correlation coefficient between one Complement protein and one clinical legacy measure in a needle title. P-values are two-sided. c Spaghetti plot displaying P-values for all 110 Complement protein associations with 10-year kidney failure risk in 5 different partially adjusted models. The black and gray dashed lines denote the Bonferroni-corrected and nominal significance thresholds, respectively. P-values are two-sided. d Correlations of urinary Complement proteome with molecular kidney injury indices (needle plot). The order and colors of the needles follow the pathway annotation of the Fig. 3a. e A chord diagram of relationships between urinary Complement proteome and circulating KRIS. Upper sectors representing TNFRSF members of KRIS (green) and non-TNFRSF members of KRIS (purple) arranged clockwise in order of decreasing strength of associations with the kidney outcome. Lower sectors are arranged counterclockwise by the strengths of the Complement associations with the kidney outcome. The top 5% Complement proteins are marked with asterisks. The length of the circular sectors indicates the cumulative strengths of the associations for a given protein. Links corresponding to the 75th percentile of the distribution of correlation coefficients are shown. HR, hazard ratio; CI, confidence intervals. Source data are provided as a Source Data file.
Fig. 5
Fig. 5. Urinary top 5% Complement proteins and cumulative incidence of kidney failure in the advanced DKD two-cohort study.
The proportions of subjects with type 1 (n = 189) or type 2 (n = 115) diabetes and advanced DKD (two-cohort study), who developed kidney failure within 10 years of follow-up, as per tertiles of distribution of baseline values of urinary creatinine-adjusted Complement proteins measured with high-throughput aptamer proteomics. a Complement C2. b Complement C5a. c Collectin kidney 1 (CL-K1). d Complement C6. e Complement factor H (CFH). f Complement C7. Solid lines represent Kaplan-Meier curves, whereas the surrounding shaded areas represent the corresponding 95% confidence intervals. Log-rank test reflects the comparison among tertiles treated as a three-level categorical variable. All P-values are two-sided. T1 (bottom), tertile 1; T2, tertile 2; T3 (top), tertile 3. Source data are provided as a Source Data file.
Fig. 6
Fig. 6. Urinary Complement proteins and kidney disease progression across five cohorts - by kidney disease stage and by diabetes type.
a The plot of strengths of associations (P-values transformed to base 10 logarithms) and effect sizes per one tertile change of each of the 110 Complement proteins on 10-year risk of developing kidney failure in the two advanced DKD cohorts, with type 1 (n = 189) or type 2 diabetes (n = 115). The top Complement proteins are marked with red dots. A weighted Cohen’s kappa coefficient (kw) and corresponding P-values reflect the test of agreement for the strength of Complement associations between type 1 and type 2 diabetes. Measurements in advanced DKD were performed with aptamer proteomics and in early-to-moderate DKD with targeted assays. All P-values are two-sided. b Associations of the top 5% Complement proteins with the prospective continuous kidney outcome in all 956 subjects and 4629 person-years by cohort. Color-annotated and cohort-specific effect estimates (diamond symbols) and 95% confidence intervals (horizontal bars) represent changes in kidney function over time per one tertile increase in the distribution of a urinary creatinine-adjusted Complement protein. Please see Supplementary Data S6 for all results on GFR-based outcomes. c Associations of the top 5% Complement proteins with the prospective, continuous kidney outcome and (d), binary composite kidney outcome in study cohorts combined by DKD stages. Color-annotated and model-specific effect estimates (crude model: closed circle symbols; adjusted model: open circle) and 95% confidence intervals (horizontal bars) represent changes in kidney function over time per one tertile increase in the distribution of a urinary creatinine-adjusted Complement protein. Please see Supplementary Data S6 for all results on GFR-based outcomes. DKD, diabetic kidney disease; CI, confidence intervals; GFR, estimated creatinine-based glomerular filtration rate; OR, odds ratio; AA, African American. Source data are provided as a Source Data file.
Fig. 7
Fig. 7. Complement proteomes and diabetic kidney disease progression across three matrices.
a The two-needle plot of the correlation strengths for subject- and timepoint-level pairs of urinary and circulating Complement proteins with a prospective GFR slope in the advanced DKD cohort with Type 1 diabetes subset (n = 97). Proteins are ordered on the x-axis by the matrix, the UniProt identifier (ID), and the protein name. b The volcano plot, where ratios of mean values of Complement proteins in the kidney tissue in DKD cases to controls (n = 31, independent cross-sectional study group, see Supplementary Data 8 for clinical characteristics) are plotted against the strengths of the associations (P-values transformed to their base 10 logarithm). The gray dashed lines indicate the false discovery rate (top) and the nominal (bottom) significance thresholds. c The box plots show in parallel the relative concentrations of top 5% Complement proteins in urine and plasma at baseline between subjects who developed kidney failure compared to those who did not within 10 years of follow-up in the advanced DKD subset (n = 97). d The box plots show kidney tissue protein expressions of tthe op 5% Complement proteins in controls (n = 9) and in subjects with advanced diabetic kidney disease (n = 22). For all boxplots, the horizontal center line within each box represents the median, the top and bottom of each box limit indicate the 75th and 25th percentile, and the whisker bars indicate the range. Data presented as dots beyond whiskers are outliers. Association strengths that did not reach significance (α = 0.05) are not shown. All P-values are two-sided. GFR, estimated creatinine-based glomerular filtration rate; DKD, diabetic kidney disease; RFU, relative fluorescence units. Source data are provided as a Source Data file.
Fig. 8
Fig. 8. Sc/snRNA-seq expression of genes corresponding to the top 5% Complement proteins in the kidney tissue.
a Overall expression and proportions on the uniform scale across the genes. b Gene-specific expression for controls (n = 17) and DKD cases (n = 8). Gene expressions corresponding to the top 5% Complement proteins from our study are shown as bubble plots in all kidney tissue examined overall (a) and by caseness, comparing diabetic kidney tissue (red) vs control tissue (purple) (b). Of note, CL-K1 protein is a product of the COLEC11 gene. Dot size in both panels represents the percent of cells expressing the gene of interest, whereas the color intensity corresponds to the expression. c Spatial transcriptomics of genes corresponding to Complement C2 and C7 proteins. This figure illustrates the spatial distribution of 2 genes (C2 and C7) in human kidney tissues from a control sample and a DKD sample. The data were obtained using the Visium spatial transcriptomics platform. Each panel represents the log-transformed expression counts for one gene, visualized across the tissue sample. Color gradients indicate varying levels of gene expression, with blue representing lower expression and red indicating higher expression. Scale bar = 250 μm. Source data are provided as a Source Data file. DKD, diabetic kidney disease; RBC, red blood cells; Baso/Mast, basophils or mast cells; Mac, macrophages; CD16_Mono, CD16 + monocytes; CD14_Mono, CD14 + monocytes; pDC, plasmacytoid dendritic cells; cDC, classical dendritic cells; NK, natural killer cells; CD8T, CD8 + T lymphocytes; CD4T, CD4 + T lymphocytes; B_memory, memory B lymphocytes; B_Naiive, naïve B lymphocytes; IC_B, type beta intercalated cells; IC_A, type alpha intercalated cells; PC, principal cells of collecting duct; CNT, connecting tubule cells; DCT, distal convoluted tubule cells; M_TAL, medullary thick ascending loop of Henle; C_TAL, cortical thick ascending loop of Henle; DLOH, thin descending loop of Henle; Injured_PT, injured proximal tubule cells; PT_S3, proximal tubule segment 3; PT_S2, proximal tubule segment 2; PT_S1, proximal tubule segment 1; Podo, podocytes; PEC, parietal epithelial cells; Mes, mesangial cells; GS_Stromal, glomerulosclerosis-specific stromal cells; Myofib, myofibroblasts; Fibroblast_2, fibroblasts expressing insulin-like growth factor-binding protein 7, vimentin, and beta-2-microglobulin; Fibroblast_1, fibroblasts expressing collagen type I alpha 1 and 2 chain; Endo_lymphatic, endothelial cells of lymphatic vessels; Endo_peritubular, endothelial cells of peritubular vessels; Endo_GC, endothelial cells of glomerular capillary tuft.
Fig. 9
Fig. 9. Complement proteins-informed clustering and prospective kidney failure in the advanced DKD cohort with type 1 and type 2 diabetes.
a Kaplan-Meier curve of 189 subjects with type 1 diabetes and advanced diabetic kidney disease who developed kidney failure within 5 years of follow-up. b An unsupervised approach performed in the form of hierarchical clustering built upon the top urinary Complement proteins. Subjects with type 1 diabetes were clustered based on Complement protein levels, disregarding the outcome. Vertical colored bars show cluster groups and prospective subject caseness. c Proportions of subjects with type 1 diabetes who developed kidney failure within 5 years by cluster. Solid lines represent Kaplan-Meier curves. Log-rank test reflects the comparison over time of the cumulative incidence of kidney failure by cluster. d Kaplan-Meier curve of 115 subjects with type 2 diabetes and advanced diabetic kidney disease who developed kidney failure within 5 years of follow-up. e An unsupervised approach performed in the form of hierarchical clustering built upon the top urinary Complement proteins. Subjects with type 2 diabetes were clustered based on Complement protein levels, disregarding the outcome. Vertical colored bars show cluster groups and prospective subject caseness. f Proportions of subjects with type 2 diabetes who developed kidney failure within 5 years by cluster. Solid lines represent Kaplan-Meier curves. Log-rank test reflects the comparison over time of the cumulative incidence of kidney failure by cluster. P-values are two-sided. Source data are provided as a Source Data file.
Fig. 10
Fig. 10. Biostatistical and machine learning models to evaluate the prognostic role of the Complement proteome for kidney failure in the advanced DKD cohorts (n = 304).
Penalized, penalized regression; Dec tree, decision tree; Deep, deep learning; LR, logistic regression; PCA, principal component; EN, elastic net; RD, ridge; LS, lasso; RF, random forest; GBM, generalized boosting method; NNET, neural network. Source data are provided as a Source Data file.

References

    1. Rios Burrows, N., Koyama, A. & Pavkov, M. E. Reported cases of end-stage kidney disease-United States, 2000-2019. Am. J. Transpl.22, 1483–1486 (2022). - PubMed
    1. Skupien, J. et al. Variations in risk of end-stage renal disease and risk of mortality in an international study of patients with type 1 diabetes and advanced nephropathy. Diabetes Care42, 93–101 (2019). - PMC - PubMed
    1. Perkovic, V. et al. Canagliflozin and renal outcomes in type 2 diabetes and nephropathy. N. Engl. J. Med.380, 2295–2306 (2019). - PubMed
    1. Heerspink, H. J. L. et al. Dapagliflozin in patients with chronic kidney disease. N. Engl. J. Med.383, 1436–1446 (2020). - PubMed
    1. Coca, S. G. et al. Plasma biomarkers and kidney function decline in early and established diabetic kidney disease. J. Am. Soc. Nephrol.28, 2786–2793 (2017). - PMC - PubMed

MeSH terms

Grants and funding