. 2025 Aug 7;16(1):7301.
doi: 10.1038/s41467-025-62652-7.

Ribosome biogenesis in plants requires the nuclear envelope and mitochondria localized OPENER complex

Affiliations

Ribosome biogenesis in plants requires the nuclear envelope and mitochondria localized OPENER complex

Wei Wang et al. Nat Commun. .

Abstract

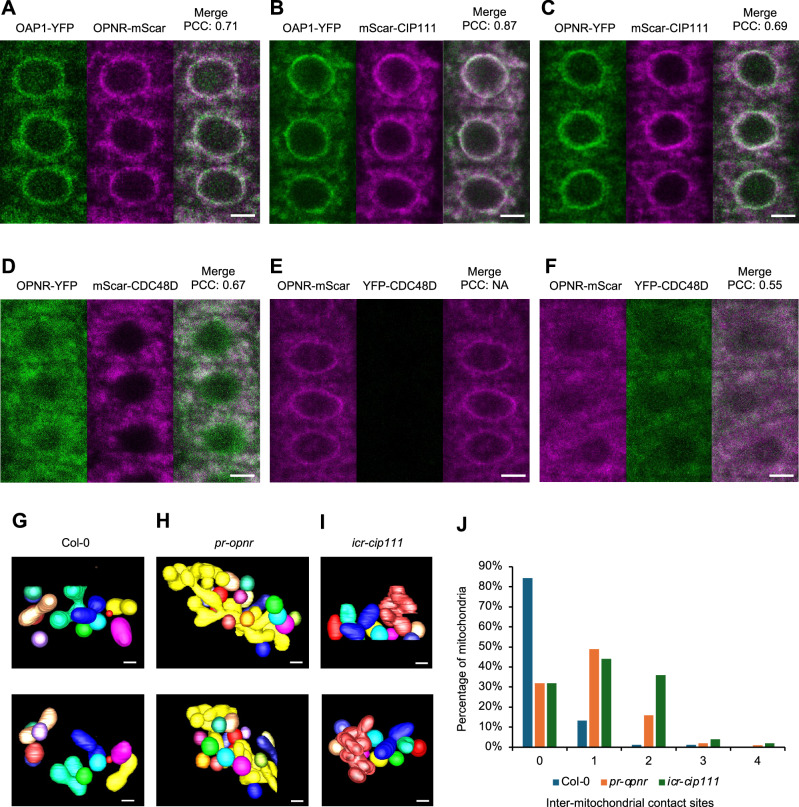
Eukaryotic ribosome biogenesis proceeds from nucleolus to cytosol assisted by various assembly factors. The process is evolutionarily conserved across eukaryotes but differences between the kingdoms are emerging. Here, we describe how the OPENER (OPNR) protein complex is required for 60S ribosome assembly in the model plant Arabidopsis thaliana. The complex is observed on both nuclear envelope and mitochondria, and contains OPNR, OPENER ASSOCIATED PROTEIN 1 (OAP1), OAP2, Cell Division Cycle 48 D (CDC48D) and Calmodulin-interacting protein 111 (CIP111). Depletion of the OPNR complex components results in reproductive lethality and cytoplasmic retention of assembly factors on 60S ribosomes. Subsequent biochemical analyses and structural modelling suggest that OPNR, OAP1 and OAP2 form a claw-like trimer which grabs the ribosome assembly factor RIBOSOMAL PROTEIN L24C (RPL24C) on the pre-60S ribosome. Our results reveal previously unrecognised subcellular complexity of ribosome biogenesis in plants, and point to mitochondria association as a feature to ensure sufficient translational capacity.


Conflict of interest statement

Competing interests: The authors declare no competing interests.

Figures

Fig. 1
Fig. 1. Phenotypes of OAP1, OAP2, CDC48D and CIP111 mutants.
A Developing seeds in siliques collected from Col-0 control plants, oap1, oap2, cdc48D and cip111 mutants, along with the complemented mutants and mutants crossed with Col-0 plants. White arrows indicate aborted ovules or seeds. ap1; OAP1-mNG is oap1 mutant complemented with pOAP1:OAP1-mNeonGreen. oap2; pOAP2:OAP2 is oap2 mutant complemented with pOAP2:OAP2. cip111; mScar-CIP111m is cip111 mutant complemented with pCIP111:mScarlet-CIP111m. cdc48D; mScar-CDC48D is cdc48D mutant complemented with pCDC48D:mScarlet-CDC48D. B Ovules from Col-0 control plants, oap1, oap2, cdc48D, and cip111 mutant plants. White arrows indicate the nucleolus. ccn: central cell nucleolus, ecn: egg cell nucleolus, scn: synergid cell nucleolus. C Zygotes from Col-0 control plants, opnr, oap1 and oap2 mutant plants. Red arrows indicate the vacuole, while white arrows indicate the nucleolus. Scale bars: A 0.5 mm; B, C 10 μm.
Fig. 2
Fig. 2. OAP1, CDC48D and CIP111 are predominantly expressed in the meristems and are important for meristem maintenance.
A Expression of pOAP1::OAP1-YFP, pCDC48D:YFP-CDC48D and pCIP111:YFP-CIP111 in root tips and lateral root primordia. B The inducible CRISPR/Cas9 lines of opnr (icr-opnr), icr-oap1, icr-cdc48D, icr-cip111 before (upper panels) and after (lower panels) Cas9 induction. The vertical lines in the Figs denote the root meristems. C Root growth of Col-0, icr-opnr, icr-oap1, icr-oap2, icr-cdc48D and icr-cip111 lines. The growth was measured every two days at 2, 4 and 6 days after Cas9 induction. Data represent means ± SD. The P values indicate the significance of differences between mutants and Col-0 control based on a two-tailed Student’s t-test. The number of replicates are shown at the bottom of each column. Scale bars: 50 µm.
Fig. 3
Fig. 3. Subcellular localization of OAP1, CDC48D and CIP111.
AD Confocal laser scanning microscope (CLSM) images of root tip cells from seedlings stably expressing pOPNR:OPNR-mScarlet and pOAP1:OAP1-YFP (A), pOAP1:OAP1-YFP and pCIP111:mScarlet-CIP111m (B), pOPNR:OPNR-YFP and pCIP111:mScarlet-CIP111m (C), and pOPNR:OPNR-YFP and pCDC48D:mScarlet-CDC48D (D). The degree of colocalization was determined by the Pearson correlation coefficient (PCC). E, F CLSM images of root tip cells from seedlings harboring pRPS5A:XVE:YFP-CDC48D and pOPNR:OPNR-mScarlet before (E) and after (F) induction of the CRISPR/Cas9 system. The same settings of YFP and mScarlet channels were used for (E) and (F). There are almost no YFP-CDC48D signals before inducing in (E). PCC was also shown for (E). NA, not applicable. GI Three-dimensional reconstructions of mitochondria, based on focused ion beam scanning electron microscopy (FIB-SEM) of Col-0 (G), pr-opnr (H) and icr-cip111 (I) root meristem cells. Sequential SEM images were captured at 30 nm intervals, with each mitochondria contour labeled and reconstructed into a 3D shape. Mitochondria were classified based on their matrix connectivity, with each distinct mitochondria marked in different colors. J The number of inter-mitochondrial contact sites between neighboring mitochondria. n = 83 for Col-0, n = 100 for both pr-opnr and icr-cip111. Scale bars: (AF): 5 µm; (GI): 0.5 µm.
Fig. 4
Fig. 4. Structural modeling of the OPNR complex formed by OPNR, OAP1, OAP2, CDC48D, and CIP111.
A The purified recombinant proteins His-OAP1, OAP2 and OPNR before (lane 1) and after (lane 2) His-tag removal. The molar ratio measured for OAP1: OAP2: OPNR was 1.2: 1: 1.1. BF: AlphaFold predicted structures of the OPNR-OAP1-OAP2 trimer (B), the interaction between OPNR-OAP1-OAP2 trimer and CIP111 (C), the interaction between OPNR-OAP1-OAP2 trimer and CDC48D (D), the interaction between OPNR-OAP1-OAP2 trimer and the N-terminus of CIP111 (E), and the interaction between OPNR-OAP1-OAP2 trimer, CIP111 and CDC48D (F). In each Fig., the three-dimensional structure is shown from two different angles. The predicted template modelling (pTM) score and the interface predicted template modelling (ipTM) score is shown for each prediction. The predicted aligned error (PAE) plots provided for each predicted structure demonstrate the high confidence (dark green) and low confidence (pale green) regions for the predicted structure. The colour coding indicates the protein identity as shown in the PAE plots. The N-terminus domain of CIP111 (N) and the two ATPase domains (D1 and D2) of CIP111 and CDC48D were labelled.
Fig. 5
Fig. 5. RPL24C serves as the substrate for the OPNR complex.
A, B: AlphaFold predicted structures and the interaction between the Arabidopsis OPNR-OAP1-OAP2 trimer and RPL24C (A), and the human C1ORF109-CINP dimer and RSL24D1 (B). The contact sites and conserved sequences are also shown. C Recombinant protein pull-down assay results for GST-RPL24C and the His-OAP1-OPNR-OAP2 trimer. Free GST proteins served as the control. 5% input used for the His-OAP1-OPNR-OAP2 trimer and 100% input used for the GST-RPL24C and GST. D CSLM images show the localization of RPL24C-YFP before (upper panel) and after (lower panel) inducible CRISPR/Cas9-facilitated mutation of OPNR (icr-opnr). The same settings of YFP and mScarlet channels were used for upper and lower panels. The OPNR-mScarlet signals almost disappeared after 3 days of inducing in the lower panel. E, G Bar charts show measurements of the RPL24C-YFP (E) and YFP-NOG1-1 (G) signals in the cytosol before and after CRISPR/Cas9 induced mutation of OPNR, CDC48D and CIP111. Data represent mean of five measured cells ± SD. The P values were generated from a two-tailed Student’s t-tests. F, H Localization of YFP-NOG1-1 (F) and BUD20-YFP (H) before (upper panel) and after (lower panel) CRISPR/Cas9-induced mutation of OPNR (icr-opnr), respectively. I, J Proteomic analyses of the 60S fractions from mutant and wild-type plants. Volcano plot results for icr-oap1 vs CK (I) and icr-cdc48D vs CK (J) with -log10 P-value on the y-axis and log2 intensity differences on the x-axis. P-values were calculated using two-tailed Student’s t-test, moderated by Benjamini–Hochberg’s method. FDR = 0.05, s0 = 0.5. The intensity of each protein was normalized to the total signal of each sample. Each dot represents a protein with the green dots representing proteins that are part of large ribosome subunits and blue dots representing small ribosome subunits. RPL24C, NOG1-1 and BUD20 are shown in red. The full lists are shown in Supplementary Data 6. K Sucrose density gradient centrifugation obtained ribosome profiles for wild-type, icr-oap2, icr-cip111 and icr-cdc48D calli after CRISPR/Cas9-induced mutation. Scar bars: 5 µm.
Fig. 6
Fig. 6
Schema showing the function of the OPNR complex in 60S ribosome assembly.

References

    1. Saez-Vasquez, J. & Delseny, M. Ribosome biogenesis in plants: from functional 45S ribosomal DNA organization to ribosome assembly factors. Plant Cell31, 1945–1967 (2019). - PMC - PubMed
    1. Warner, J. R. The economics of ribosome biosynthesis in yeast. Trends Biochem. Sci.24, 437–440 (1999). - PubMed
    1. Moraleva, A. A., Deryabin, A. S., Rubtsov, Y. P., Rubtsova, M. P. & Dontsova, O. A. Eukaryotic ribosome biogenesis: the 60S Subunit. Acta Nat.14, 39–49 (2022). - PMC - PubMed
    1. Bassler, J. & Hurt, E. Eukaryotic ribosome assembly. Annu. Rev. Biochem.88, 281–306 (2019). - PubMed
    1. Espinar-Marchena, F. J., Babiano, R. & Cruz, J. Placeholder factors in ribosome biogenesis: please, pave my way. Microb. Cell4, 144–168 (2017). - PMC - PubMed

MeSH terms

LinkOut - more resources