

ITGAV as a promising diagnostic, immunological, and prognostic biomarker in pan-cancer
- PMID: 40775249
- PMCID: PMC12332088
- DOI: 10.1038/s41598-025-11836-8
ITGAV as a promising diagnostic, immunological, and prognostic biomarker in pan-cancer
Abstract
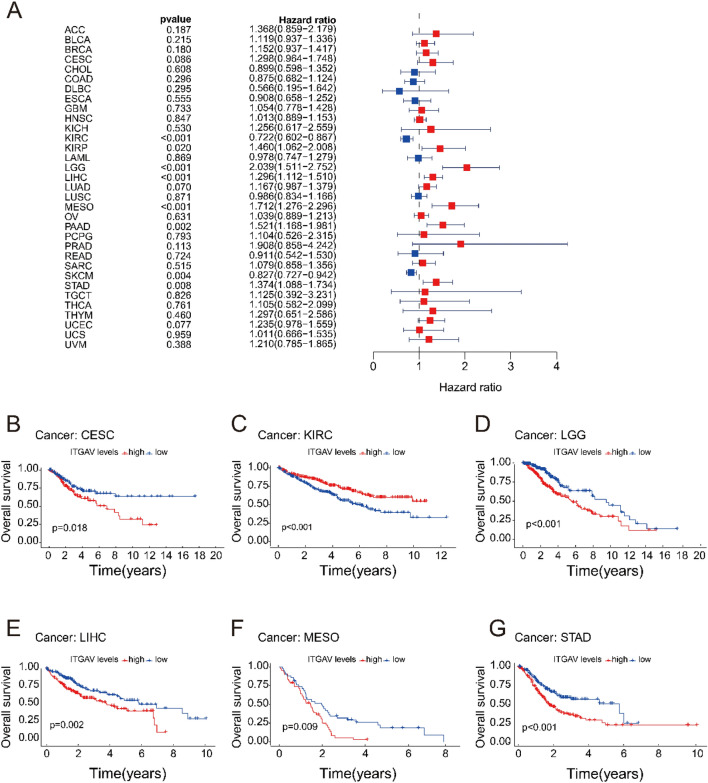
Integrin αV (ITGAV) plays a key role in cell adhesion, migration, and immune regulation, and is implicated in tumor progression. However, its comprehensive expression profile and functional relevance across different cancers remain poorly understood. We conducted an integrative pan-cancer analysis of ITGAV using data from TCGA, GTEx, CCLE, and other public databases. Expression, diagnostic value (via ROC analysis), and prognostic significance (via Cox and Kaplan-Meier analyses of OS, DSS, PFS, and DFS) were assessed. We further explored ITGAV's correlation with immune cell infiltration and immune-related genes, its predictive role in immunotherapy response based on immunophenoscore (IPS), and its drug-binding potential through molecular docking. (1) ITGAV was significantly overexpressed in multiple cancer types including LIHC, COAD, and STAD. (2) ROC analysis confirmed its strong diagnostic value, particularly in HNSC, UCEC, and ESCA. (3) High ITGAV expression was associated with poorer survival outcomes in most cancers, while a protective role was observed in KIRC. (4) ITGAV expression was positively correlated with immune cell infiltration and co-expressed with immune-activating and immunosuppressive genes. (5) The expression level of ITGAV correlates with the IPS score, suggesting its predictive value for the benefit of immunotherapy. (6) Molecular docking identified strong binding affinities between ITGAV and six candidate compounds, including gemcitabine and pioglitazone. Our findings demonstrate that ITGAV is a promising biomarker for diagnosis, prognosis, and immunotherapy prediction across cancers. Its immunological associations and druggability highlight its potential as a candidate therapeutic target.
Keywords: Biomarker; ITGAV; Immune infiltration; Immunotherapy; Pan-cancer; Prognosis.
© 2025. The Author(s).
Conflict of interest statement
Declarations. Competing interests: The authors declare no competing interests.
Figures


Similar articles
-
Integrated pan-cancer analysis of ADM's role in prognosis, immune modulation and resistance.Front Immunol. 2025 Jun 3;16:1573250. doi: 10.3389/fimmu.2025.1573250. eCollection 2025. Front Immunol. 2025. PMID: 40529377 Free PMC article.
-
Interplay between tumor mutation burden and the tumor microenvironment predicts the prognosis of pan-cancer anti-PD-1/PD-L1 therapy.Front Immunol. 2025 Jul 24;16:1557461. doi: 10.3389/fimmu.2025.1557461. eCollection 2025. Front Immunol. 2025. PMID: 40777041 Free PMC article.
-
Comprehensive pan-cancer analysis reveals NTN1 as an immune infiltrate risk factor and its potential prognostic value in SKCM.Sci Rep. 2025 Jan 25;15(1):3223. doi: 10.1038/s41598-025-85444-x. Sci Rep. 2025. PMID: 39863609 Free PMC article.
-
Systematic pan-cancer analysis identifies PKNOX1 as a potential prognostic and immunological biomarker and its functional validation.Front Immunol. 2025 Jun 23;16:1533690. doi: 10.3389/fimmu.2025.1533690. eCollection 2025. Front Immunol. 2025. PMID: 40625743 Free PMC article.
-
The Prognostic Significance of NEDD9 Expression in Human Cancers: A Systematic Review, Meta-Analysis, and Omics Exploration.Technol Cancer Res Treat. 2024 Jan-Dec;23:15330338241297597. doi: 10.1177/15330338241297597. Technol Cancer Res Treat. 2024. PMID: 39540210 Free PMC article.
References
-
- Emens, L. A. et al. Cancer immunotherapy: Opportunities and challenges in the rapidly evolving clinical landscape. Eur. J. Cancer.81, 116–129 (2017). - PubMed
-
- Syn, N. L., Teng, M. W. L., Mok, T. S. K. & Soo, R. A. De-novo and acquired resistance to immune checkpoint targeting. Lancet. Oncol.18(12), e731–e741 (2017). - PubMed
-
- Pitt, J. M. et al. Targeting the tumor microenvironment: Removing obstruction to anticancer immune responses and immunotherapy. Ann. Oncol.27(8), 1482–1492 (2016). - PubMed
MeSH terms
Substances
Grants and funding
LinkOut - more resources
Full Text Sources
Medical
