. 2025 Aug 7;23(1):882.
doi: 10.1186/s12967-025-06925-1.

Multi-omics data reveal that SAA1 + fibroblasts exacerbate periodontitis by regulating macrophage inflammation and chemotaxis

Affiliations

Multi-omics data reveal that SAA1 + fibroblasts exacerbate periodontitis by regulating macrophage inflammation and chemotaxis

Li Li et al. J Transl Med. .

Abstract

Background: Traditional techniques are limited in their ability to analyze the complex interaction mechanisms among multiple cell types within the periodontal microenvironment, thereby restricting the development of targeted therapies for periodontitis (PD). Utilizing multiomics technologies to investigate the interaction networks of key cell clusters can systematically uncover regulatory mechanisms and identify critical therapeutic targets.

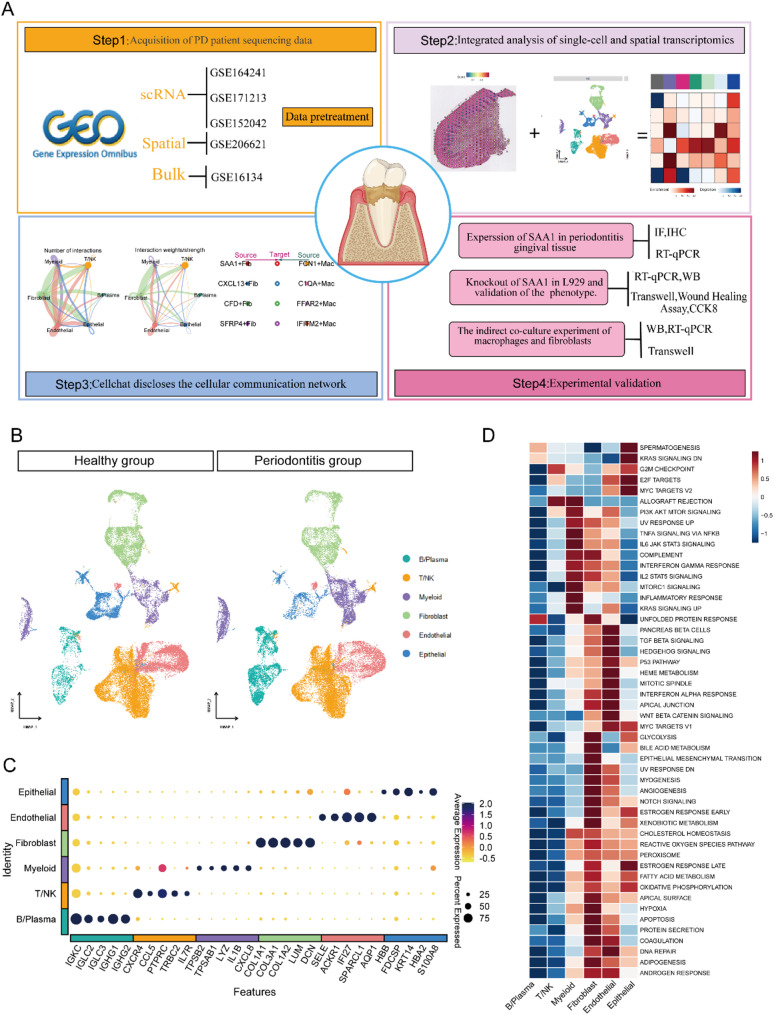
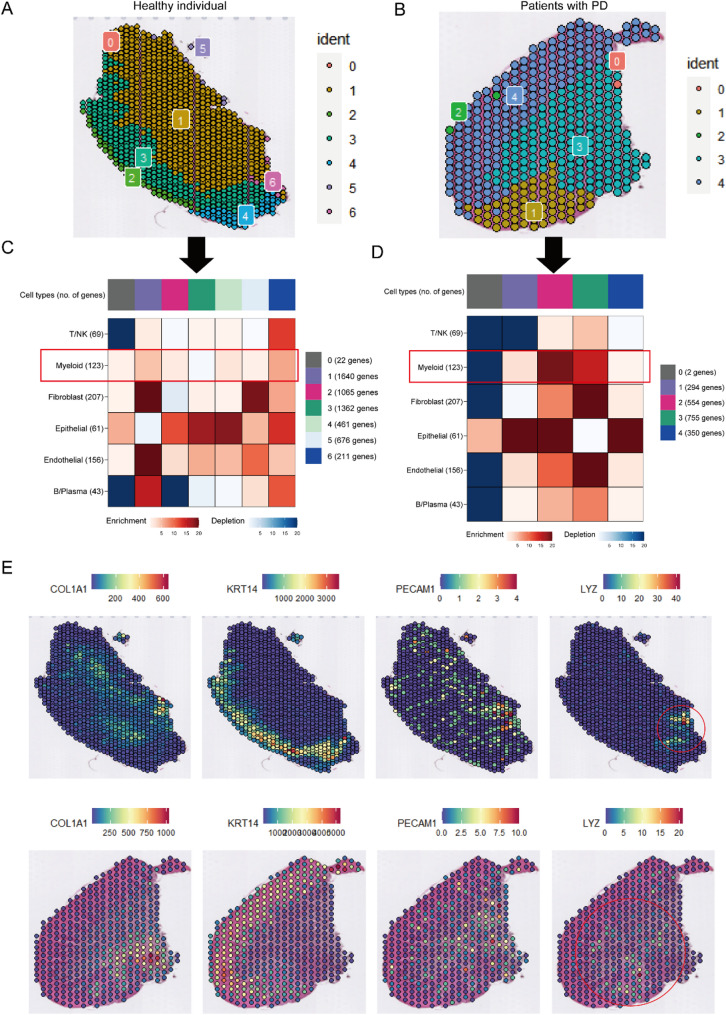
Methods: Through integrative analysis of single-cell RNA sequencing (scRNA-seq), spatial transcriptomics, and bulk transcriptome datasets from periodontal tissues, we systematically characterized the spatial architecture and intercellular communication networks within the inflammatory periodontal microenvironment, identifying a functionally serum amyloid A1 + fibroblasts (SAA1 + Fib) that critically drives disease progression. Combined bioinformatics and functional validations (in vitro and in vivo) revealed the proinflammatory role of SAA1 + Fib, demonstrating their unique transcriptional profile and mechanistic contributions to periodontal inflammation.

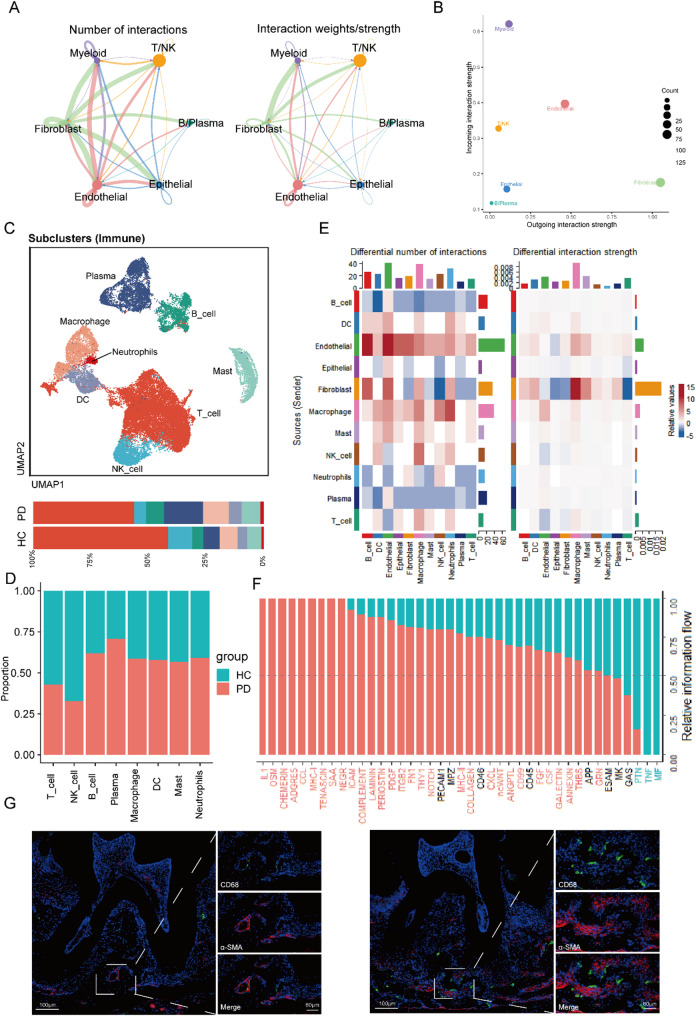
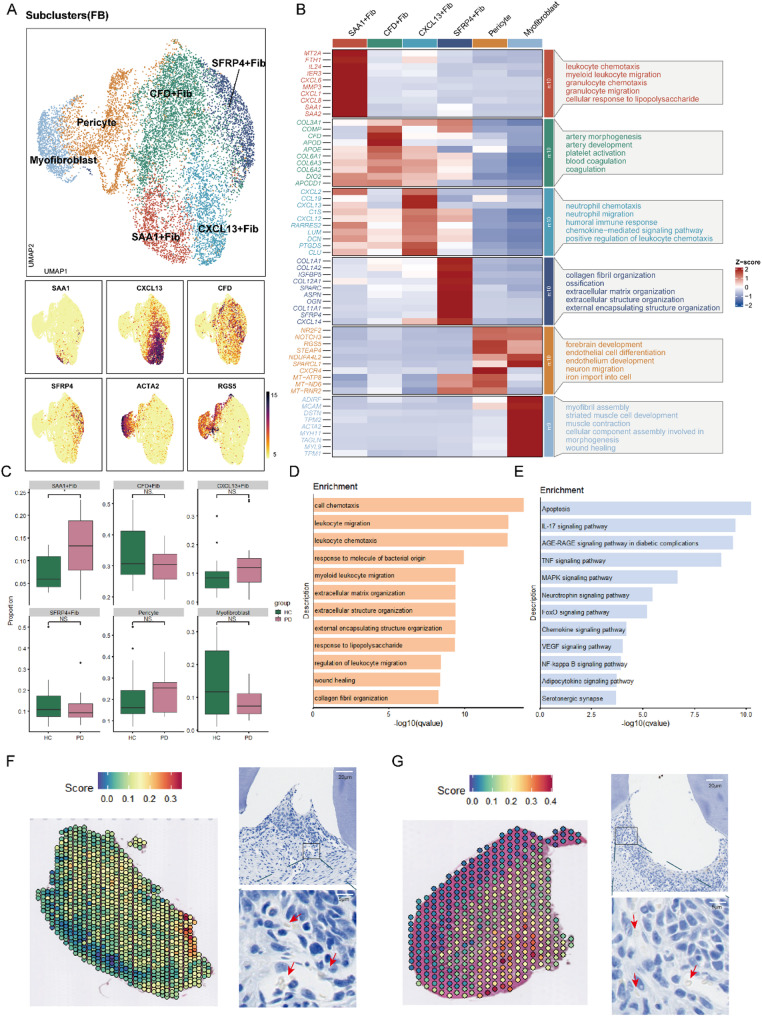
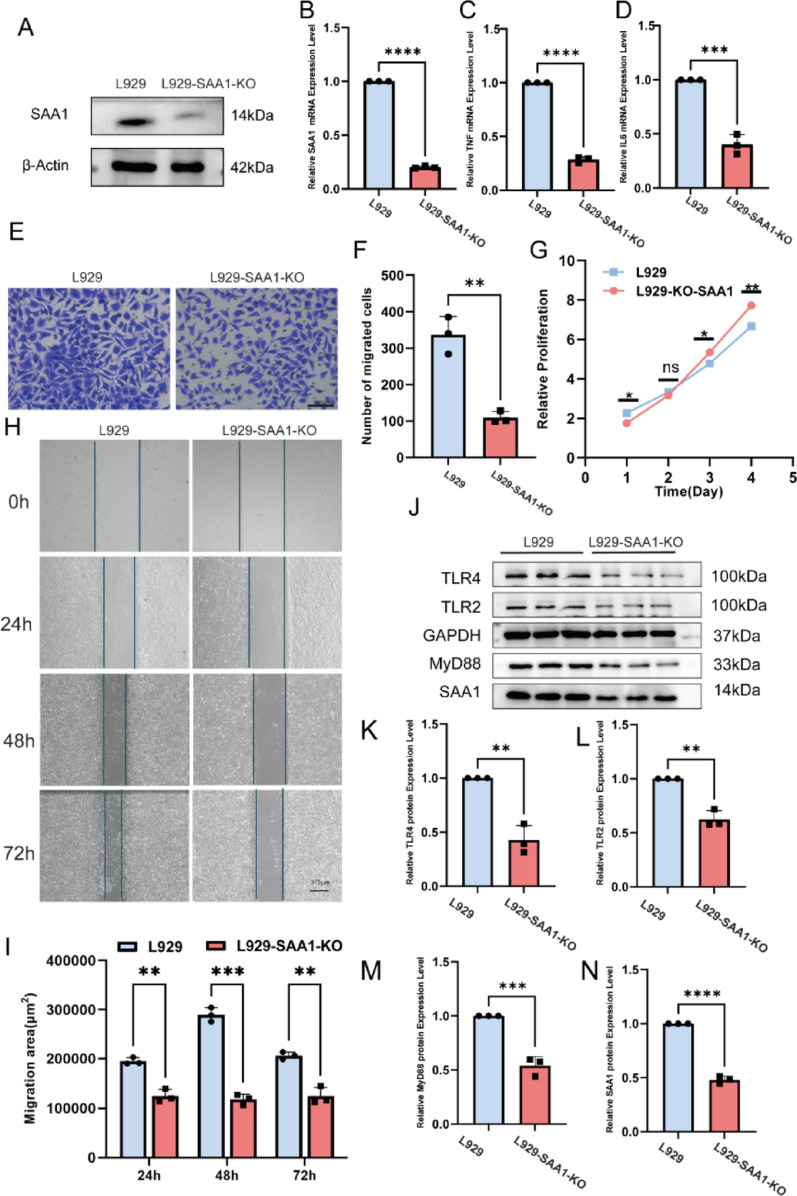
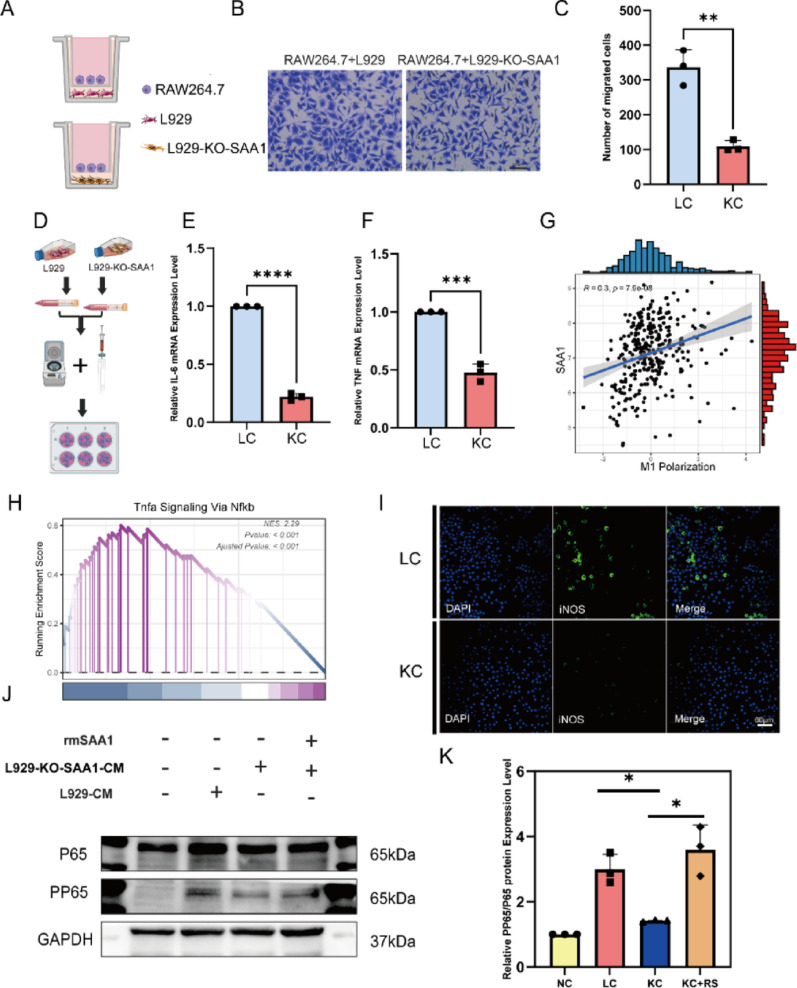
Results: This study successfully constructed a single-cell transcriptome atlas comprising 65,979 periodontal tissue cells and identified an SAA1 + fibroblast subpopulation with key functions. Cell communication analysis revealed that this subpopulation mediates the infiltration of myeloid cells, such as macrophages, to the lesion site by secreting chemokine-related signaling molecules, including members of the SAA, CXCL, and CSF families. Animal experiments confirmed a significant increase in SAA1 expression levels in both the gingival tissue and peripheral blood of periodontitis model mice. Gene function studies indicated that SAA1 knockout resulted in reduced migration ability and enhanced proliferation activity of L929 cells, while significantly decreasing the secretion of inflammatory factors such as IL-6 and TNF-α. In a co-culture system of L929 cells and RAW264.7 cells, SAA1 knockout not only diminished the chemotactic effect of fibroblasts on macrophages but also suppressed the secretion of inflammatory factors and inhibited M1 polarization of macrophages. Mechanistic studies indicated that these effects were likely mediated by the suppression of NF-κB signaling pathway activity in RAW264.7 cells.

Conclusion: We elucidated the pro-inflammatory properties of SAA1 + Fib and their role in promoting macrophage infiltration, targeting SAA1 offers a new approach for the treatment of PD.

Keywords: CellChat; Fibroblast; Macrophage infiltration; Periodontitis; SAA1; Single-cell RNA sequencing.


Conflict of interest statement

Declarations. Conflict of interest: The authors declare that the research was conducted in the absence of any commercial or financial relationships that could be construed as a potential conflict of interest.

Figures

Fig. 1
Fig. 1
Single-cell atlas of periodontal tissues. A Workflow of the current study. B UMAP plot of scRNA-seq data stratified by tissue type, including healthy tissues (n = 14) and tissues affected by periodontitis (n = 14). C Dot plot showing the top 5 DEGs in each cell cluster. D Heatmap of functional enrichment scores of each cell type calculated with the GSVA algorithm, where darker red indicates higher levels of enrichment
Fig. 2
Fig. 2
Multiomics analysis revealed changes in cell spatial positioning during PD. A-B Spatial images of periodontal tissue sections inferred by unsupervised clustering methods showing the structural organization of the cells. Panel A: HC sample; Panel B: PD sample. The “ident” label represents the cell clusters identified by clustering. C-D The MIA algorithm was used to assess the degree of infiltration of each cell type within each spatial cluster, where a redder color indicates a greater degree of infiltration. E Spatial images illustrating the spatial distribution and expression levels of cell-specific markers
Fig. 3
Fig. 3
CellChat analysis revealed the cell interaction network. A Circle plots showing an overview of intercellular interactions in periodontal tissues, with wider lines indicating more frequent or stronger interactions. B Scatter plot showing the strengths of the relationships between outgoing and incoming interactions for different cell types. C Upper panel: UMAP plot of immune cells; lower panel: proportion of various immune cell types in the total population. D Comparison of immune cell counts between the PD and HC groups. E Heatmap showing changes in the number and intensity of interactions among various cell types in different groups, based on signal reception and emission. F Bar chart showing specific signaling pathways inferred by CellChat analysis under HC and PD conditions, with blue bars indicating increased signals in HC tissues and red bars indicating increased interactions in PD tissues. G Immunofluorescence staining of mouse periodontal tissues, demonstrating spatial aggregation of macrophages and fibroblasts. Left panel: HC sample; right panel: PD sample
Fig. 4
Fig. 4
Fibroblast subtype analysis. A Upper panel: UMAP plot of fibroblasts after unsupervised clustering; Lower panel: Expression levels of marker genes in the UMAP plot. B Heatmap showing the top 10 DEGs in each subtype. The right side shows the top 5 GO terms enriched by the upregulated DEGs in each cell cluster. C Boxplots showing the percentage of cells in each fibroblast cluster in HC group and PD group. D Bar chart of the top 12 GO enriched terms for the DEGs that are highly expressed in SAA1 + Fib. E Bar chart of the top 12 KEGG pathways enriched by the DEGs that are highly expressed in SAA1 + Fib. F-G Left: Spatial images of periodontal tissue, with color intensity representing the enrichment of SAA1 + Fib. Right: Immunohistochemical staining of SAA1 in mouse periodontal tissue (indicated by the red arrow). Panel F shows the HC sample, and Panel G shows the PD sample. An unpaired two-tailed t test was used. * p < 0.05
Fig. 5
Fig. 5
Construction of an interaction network between macrophages and fibroblasts. A UMAP plot of macrophage after unsupervised clustering. B The expression levels of macrophage marker genes in the UMAP plot. C Interaction network between macrophage subtypes and fibroblast subtypes, with the left panel showing the number of interactions and the right panel showing the interaction intensity. D Heatmap showing significantly received signals and their intensities in each cell type under HC and PD conditions. EG Modes of action of CXCL, CSF, and SAA1 signals in macrophages and fibroblasts. H The bar chart shows the contributions of all ligand‒receptor pairs in the CSF pathway across both HC and PD tissues. I Dot plot of the top predicted fibroblast ligands that drive inflammatory responses, indicating which fibroblast subpopulations express these ligands. J Ligand‒receptor heatmap of potential receptors that are expressed by macrophages and associated with each fibroblast ligand
Fig. 6
Fig. 6
In vivo experiments to verify SAA1 expression in PD. A Schematic diagram showing the workflow for establishing the PD model. B Confirmation of successful model establishment: Top panel: Two-dimensional micro-CT images of alveolar bone from mice across three planes: sagittal, transverse, and coronal; Middle panel: Three-dimensional reconstructed image of a mouse alveolar bone; Bottom panel: H&E staining of mouse alveolar bone sections. C Assessment of the vertical distance between the CEJ-ABC in mice (indicated by the red arrow in Fig. 6B). D Immunofluorescence staining of periodontal tissues from mice with periodontitis, with SAA1 labeled in red and α-SMA in green. EG mRNA expression levels of MMP9, TNF-α, and SAA1 in mouse gingiva from left to right. H Quantification of SAA1 content in mouse serum. An unpaired two-tailed t test was used. ** p < 0.01; ***p < 0.001; ****p < 0.0001
Fig. 7
Fig. 7
Phenotypic characterization and validation of SAA1 knockout (L929-KO-SAA1) cells. A Protein expression levels of SAA1 in L929 cells and L929-KO-SAA1 cells. BD mRNA expression levels of SAA1, TNF-α, and IL-6 in L929 cells and L929-KO-SAA1 cells from left to right. E Assessment of the migration of L929 cells and L929-KO-SAA1 cells. F Quantitative analysis of the Transwell migration assay results. G Quantitative analysis of the CCK8 cell proliferation assay results. H Wound healing assay to evaluate cell migration. I Quantitative analysis of the wound healing assay results. J Western blotting images showing the expression levels of TLR2, TLR4, MyD88, SAA1, and GAPDH. KN Quantitative analysis of the protein expression levels of TLR4, TLR2, MyD88, and SAA1 relative to GAPDH. An unpaired two-tailed t test was used. ** p < 0.01; ***p < 0.001; ****p < 0.0001
Fig. 8
Fig. 8
Coculture experiments confirmed the effects of L929-KO-SAA1 on macrophage function. A Schematic diagram showing the use of L929 cells and L929-KO-SAA1 cells to induce RAW264.7 cell migration. B RAW264.7 cell migration induced by L929 cells and L929-KO-SAA1 cells. C Quantitative analysis of RAW264.7 cell migration induced by L929 cells and L929-KO-SAA1 cells. D Schematic diagram of the indirect coculture experimental setup. EF RT‒qPCR results showing TNF-α and IL-6 mRNA expression in RAW264.7 cells after coculture. G Correlations between M1 polarization scores and SAA1 expression levels in 310 samples from the PD transcriptome dataset GSE16134. H GSEA of the most significantly enriched terms for SAA1 + Fib characteristic genes. I Macrophage polarization status after coculture with L929 (LC) and L929-KO-SAA1 (KC) cells, with iNOS as the M1 polarization marker. J Western blotting results confirming the enrichment analysis results. K Quantitative analysis PP65/P65 protein levels relative to GAPDH. NC: cells cultured in serum-free medium; LC: cells cultured in L929 conditioned medium (CM); KC: cells cultured in L929-KO-SAA1 conditioned medium; KC + RS: cells cultured in L929-KO-SAA1 conditioned medium containing 1 µg/mL recombinant SAA1 protein. Using an unpaired two-tailed t-test. *p < 0.05; **p < 0.01; ***p < 0.001; ****p < 0.0001
Fig. 9
Fig. 9
Molecular docking and drug function verification. A The result of molecular docking between SAA1 and AN. B The molecular docking diagram of SAA1 and NS. C The effect of different concentrations of AN on the viability of RAW264.7 cells. D The effect of different concentrations of NS on the viability of RAW264.7 cells. EH Comparison of the expression of inflammatory factors (IL-6, TNF) in RAW264.7 cells under different treatment conditions. NC: RAW264.7 cells cultured in serum-free medium; LC: RAW264.7 cells cultured in L929 cell-conditioned medium; KC: RAW264.7 cells cultured in SAA1-KO-L929 cell-conditioned medium; LC + AN: RAW264.7 cells cultured in L929 cell-conditioned medium and simultaneously treated with AN; KC + AN: RAW264.7 cells cultured in SAA1-KO-L929 cell-conditioned medium and simultaneously treated with AN; LC + NS: RAW264.7 cells cultured in L929 cell-conditioned medium and simultaneously treated with NS; KC + NS: RAW264.7 cells cultured in SAA1-KO-L929 cell-conditioned medium and simultaneously treated with NS. Analysis of variance was used to estimate the differences between groups. *p < 0.05; **p < 0.01; ***p < 0.001; ****p < 0.0001; ns = no significance

Similar articles

References

    1. Kinane DF, et al. Periodontal diseases. Nat Reviews Disease Primers. 2017;3(17038). 10.1038/nrdp.2017.38. - PubMed
    1. Darby I. Risk factors for periodontitis & peri-implantitis. Periodontology 2000 2022, 90(1):9–12. 10.1111/prd.12447 - PMC - PubMed
    1. Herrera D et al. Treatment of stage IV periodontitis: the EFP S3 level clinical practice guideline. J Clin Periodontology 2022 49 Suppl 24:4–71, 10.1111/jcpe.13639 - PubMed
    1. Teles F, et al. Viruses, periodontitis, and comorbidities. Periodontol 2000. 2022;89(1):190–206. 10.1111/prd.12435. - PubMed
    1. Lin H, et al. Advances of exosomes in periodontitis treatment. J Translational Med. 2022;20(1):279. 10.1186/s12967-022-03487-4. - PMC - PubMed

Substances

LinkOut - more resources