. 2025 Aug 7;15(1):28901.
doi: 10.1038/s41598-025-12893-9.

Effects of natural Lithium and Lithium isotopes on voltage gated sodium channel activity in SH-SY5Y and IPSC derived cortical neurons

Affiliations

Effects of natural Lithium and Lithium isotopes on voltage gated sodium channel activity in SH-SY5Y and IPSC derived cortical neurons

Irina Bukhteeva et al. Sci Rep. .

Abstract

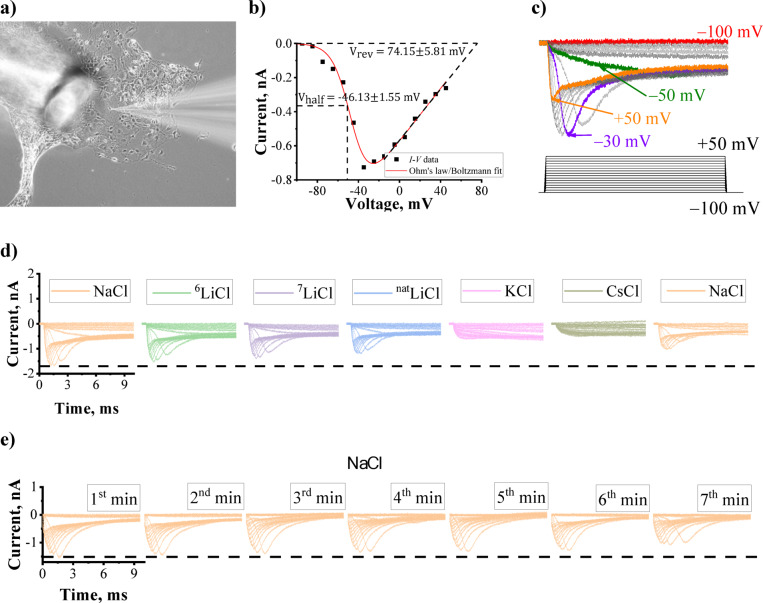
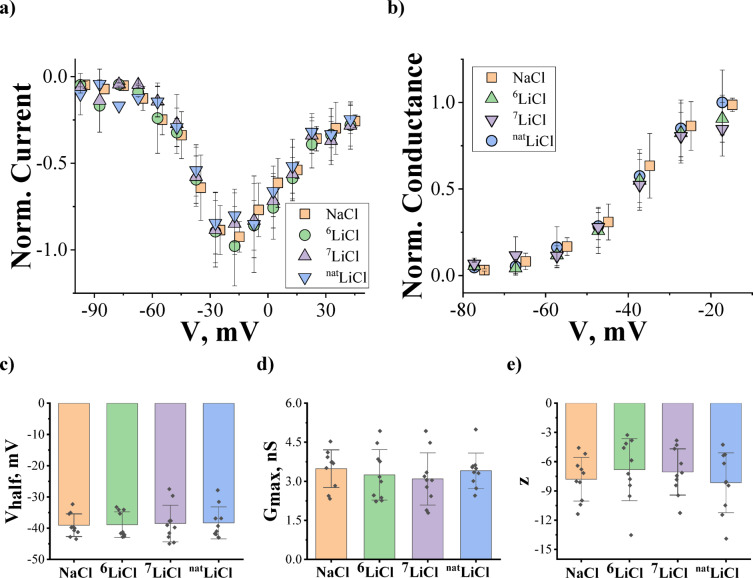
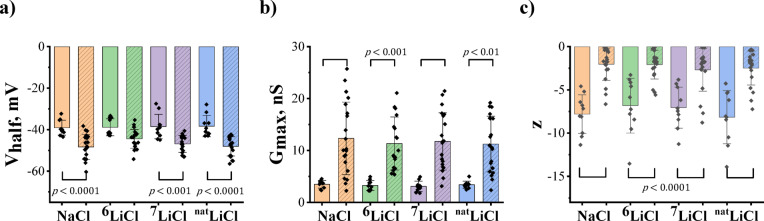
Although lithium (Li) is a widely used treatment for bipolar disorder, its exact mechanisms of action remain elusive. Research has shown that the two stable Li isotopes, which differ in their mass and nuclear spin, can induce distinct effects in both in vivo and in vitro studies. Since sodium (Na+) channels are the primary pathway for Li+ entry into cells, we examined how Li+ affects the current of Na+ channels using whole-cell patch-clamp techniques on SH-SY5Y neuroblastoma cells and human iPSC-derived cortical neurons. Our findings indicate that mammalian Na+ channels in both neuronal models studied here display no selectivity between Na+ and Li+, unlike previously reported bacterial Na+ channels. We observed differences between the two neuronal models in three measured parameters ([Formula: see text]). We saw no statistically significant differences between any ions in SH-SY5Y cells, but small differences in the half-maximum activation potential ([Formula: see text]) between Na+ and 6Li+ and between 7Li+ and 6Li+ were found in iPSC-derived cortical neurons. Although Na+ channels are widely expressed and important in neuronal function, the very small differences observed in this work suggest that Li+ regulation through Na+ channels is likely not the primary mechanism underlying Li+ isotope differentiation.

Keywords: IPSC-derived cortical neurons; Lithium isotopes; Mammalian sodium channels; Patch-clamp; SH-SY5Y.


Conflict of interest statement

Declarations. Competing interests: The authors declare no competing interests.

Figures

Fig. 1
Fig. 1
Experimental setup and data analysis. (a) Experiment setup – a phase contrast image of a patch pipette (on the right) attached to the membrane of an iPSC-derived cortical neuron with the single-cell perfusion tube for extracellular buffer exchange on the left. (b) Example of formula image data for one experiment (formula image) analyzed with Eq. (1): formula image and formula image are shown on the Figure, formula image µ S, formula image. (c) Top: Representative traces with colored currents at selected voltage steps to show signal evolution. Bottom: Stimulating protocol used: consecutive sixteen voltage steps from − 100 mV to + 50 mV with + 10 mV increments. (d) Representative traces of current recordings for one sequence of timeline-ordered perfusions, from left to right: NaCl, 6LiCl 7LiCl; natLiCl; KCl; CsCl; NaCl. For all ionic solutions shown, the time-dependence of the current traces resulting from the consecutive sixteen + 10 mV voltage steps is shown. The dashed line indicates the maximum current achieved during the first NaCl perfusion. (e) Representative current traces for recording in NaCl buffer over 7 minutes to represent rundown in the same buffer. The dashed line indicates the maximum current achieved during the first NaCl perfusion. All examples in this figure are shown for iPSC-derived cortical neurons.
Fig. 2
Fig. 2
Normalized current/conductance profiles and Na+ channel parameters from SH-SY5Y cells upon constant perfusion of NaCl, 6LiCl, 7LiCl, natLiCl. (a) Corresponding formula image profiles for Na+ and Li+ ions, where current magnitudes were normalized to the maximum inward current measured solely under Na+ perfusion. (b) Corresponding formula image profiles for the Na+ and Li+ ions, where conductance magnitudes were normalized to the maximum conductance measured solely under Na+ perfusion. (c) formula image – the half-maximum activation potential. (d) formula image – the maximal conductance. (e) formula image – the apparent valence of the gating charge. The symbols in panels (a) and (b) and columns in panels (c)-(e) represent the mean, the data point (black dots) in panels (c)-(e) represent individual measurements, and bars represent standard deviation (SD). Statistical significance for individual cells was evaluated using one-way repeated measures ANOVA. The number of replicates (individual cells successfully patched) is formula image.
Fig. 3
Fig. 3
Normalized current/conductance profiles and Na+ channel parameters from iPSC-derived cortical neurons upon constant perfusion of NaCl, 6LiCl, 7LiCl, natLiCl. (a) Corresponding formula image profiles for Na+ and Li+ ions, where current magnitudes were normalized to the maximum inward current measured solely under Na+ perfusion. (b) Corresponding formula image profiles for Na+ and Li+ ions, where conductance magnitudes were normalized to the maximum conductance measured solely under Na+ perfusion. (c) formula image – the half-maximum activation potential. (d) formula image – the maximal conductance. (e), formula image – apparent valence of the gating charge. The symbols in panels (a) and (b) and columns in panels (c)-(e) represent the mean, the data point (black dots) in panels (c)-(e) represent individual measurements, and bars represent standard deviation (SD). Statistical significance for individual cells was evaluated using one-way repeated measures ANOVA. The number of replicates (individual cells successfully patched) is formula image.
Fig. 4
Fig. 4
Na+ channels parameters from SH-SY5Y and iPSC-derived cortical neurons in constant perfusion of NaCl, 6LiCl, 7LiCl, natLiCl. (a) formula image - the half-maximal activation potential. (b) formula image - the maximal conductance. c) formula image - the apparent valence of the gating charge. Statistical significance was evaluated by one-way ANOVA with Bonferroni’s post hoc test (solid columns represent SHSY-5Y cells, dashed columns represent iPSC-derived cortical neurons; points represent the individual measurements, colored boxes represent the mean, and bars represent SD). The number of replicates (individual cells successfully patched) is formula image for iPSC-derived cortical neurons and formula image for SH-SY5Y cells.

Update of

Similar articles

References

    1. Shorter, E. The history of lithium therapy. Bipolar Disord.11, 4–9 (2009). - PMC - PubMed
    1. Bortolozzi, A. et al. New advances in the Pharmacology and toxicology of lithium: a neurobiologically-oriented overview. Pharmacol. Rev. 76, 323–357 (2024). - PMC - PubMed
    1. Sechzer, J. A., Lieberman, K. W., Alexander, G. J., Weidman, D. & Stokes, P. E. Aberrant parenting and delayed offspring development in rats exposed to lithium. Biol. Psychiatry. 21, 1258–1266 (1986). - PubMed
    1. Esmaeilpour, K. et al. Li Isotopes Differentiation in Neuronal activity–evidence for Novel Quantum Effects in Neuroscience (in Bulletin of the American Physical Society, 2024).
    1. Bukhteeva, I. et al. Effects of lithium isotopes on sodium/lithium co-transport and calcium efflux through the sodium/calcium/lithium exchanger in mitochondria. Front. Physiol. 15, 1354091 (2024). - PMC - PubMed

MeSH terms

LinkOut - more resources