

Network-based approach identifies key genes associated with tumor heterogeneity in HPV positive and negative head and neck cancer patients
- PMID: 40775425
- PMCID: PMC12332169
- DOI: 10.1038/s41598-025-13604-0
Network-based approach identifies key genes associated with tumor heterogeneity in HPV positive and negative head and neck cancer patients
Abstract
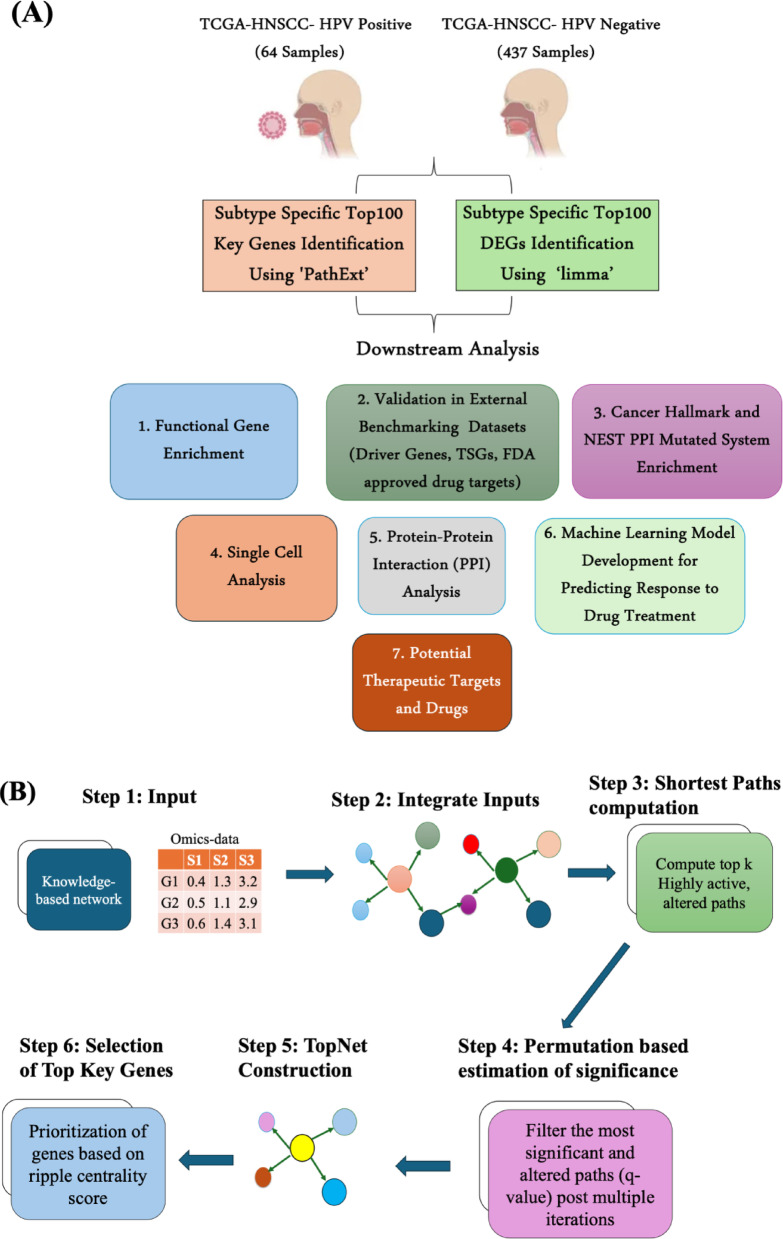
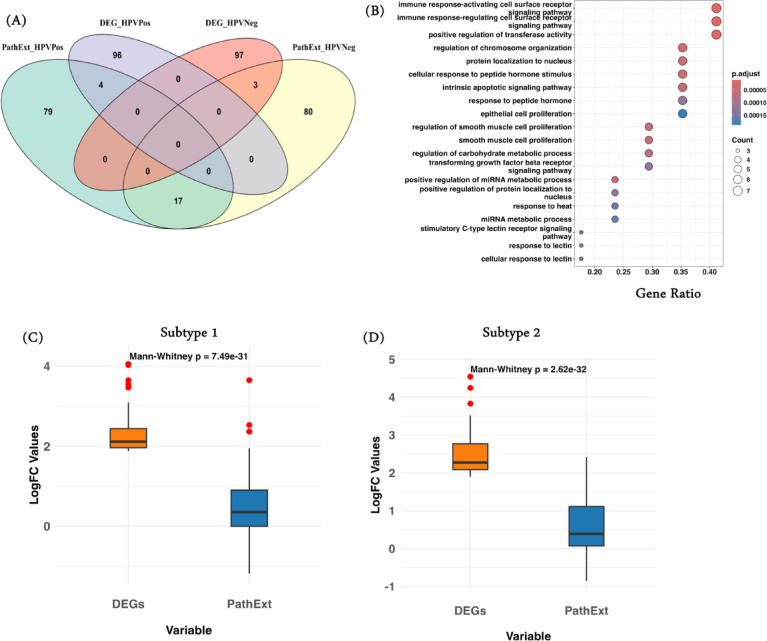
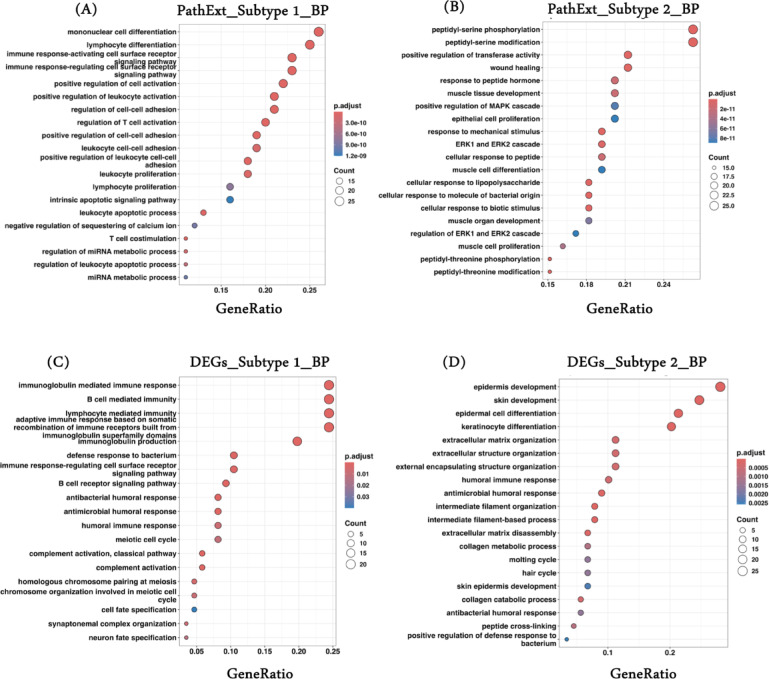
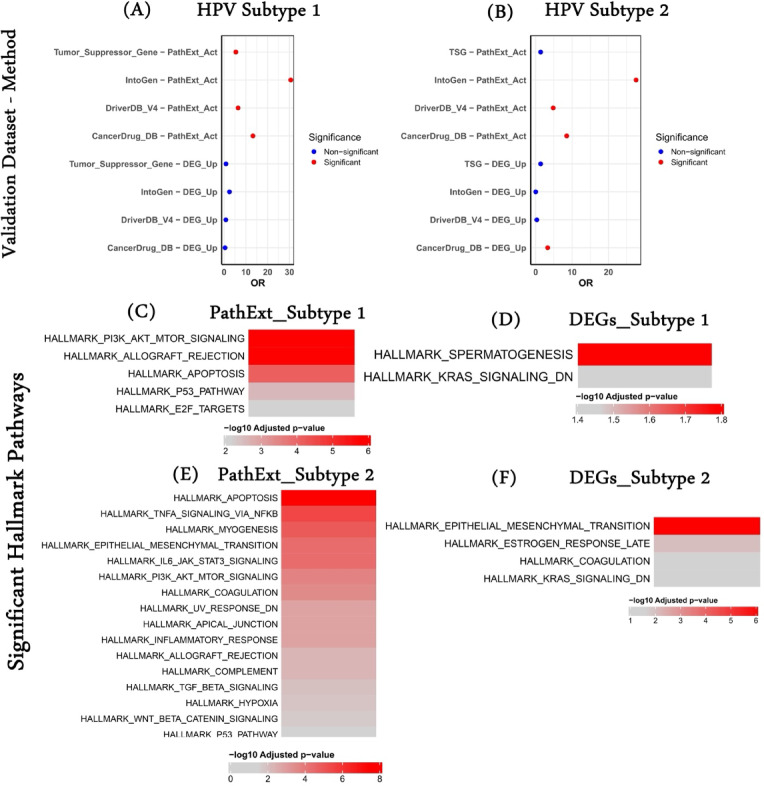
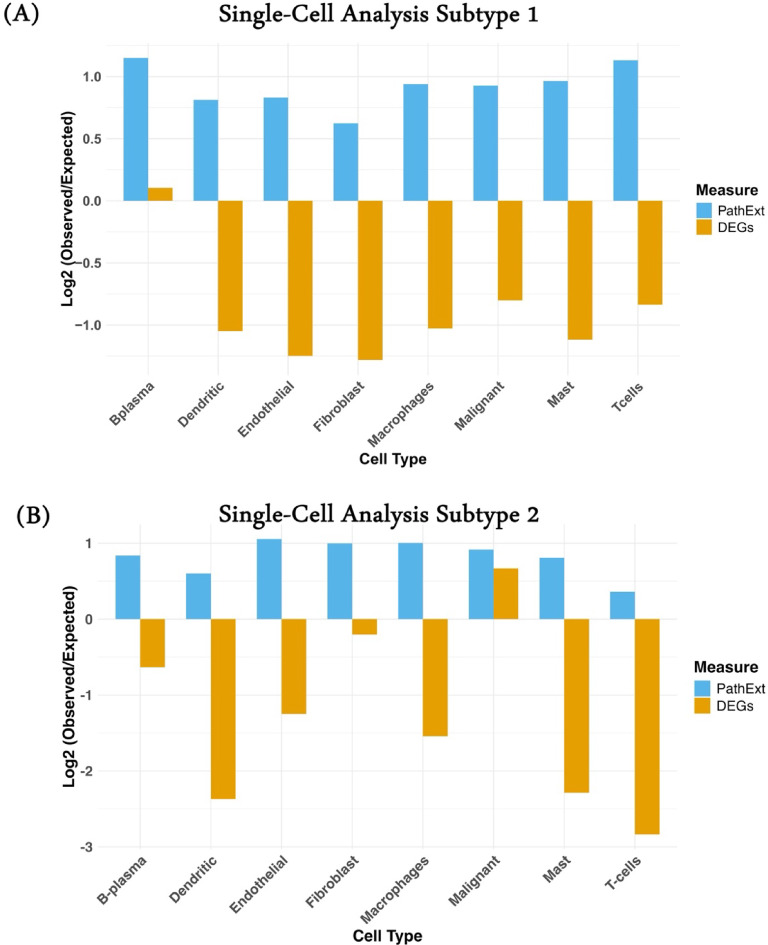
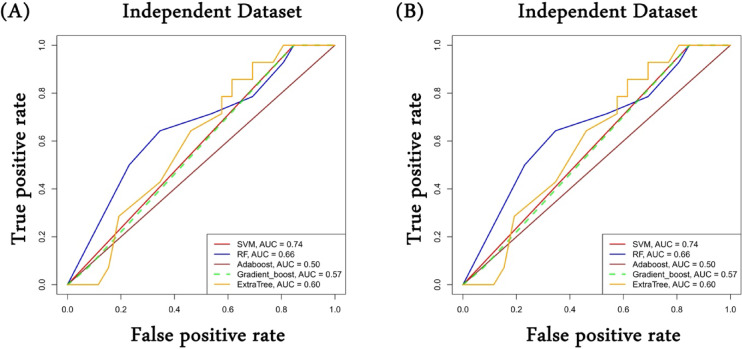
Head and Neck Squamous Cell Carcinoma (HNSCC) is the seventh most prevalent cancer worldwide and is classified as human papillomavirus (HPV) positive or negative. Substantial heterogeneity has been observed in the two groups, posing a significant clinical challenge. In the disease context, global transcriptional changes are likely driven by a few key genes that reflect the disease etiology more accurately compared to differentially expressed genes (DEGs). We implemented our network-based tool PathExt on 501 TCGA-HNSCC samples (64 HPV positive & 437 HPV negative) to characterize central genes in two subtypes, where in subtype 1, HPV-positive samples were considered as cases and negative as controls, and vice versa in subtype 2. We also identified DEGs and performed several analyses on multiple benchmarking datasets to compare the biology of central genes with DEGs. PathExt key genes performed better with respect to DEGs in both subtypes in recapitulating disease etiology. Gene ontology analysis using central genes revealed shared biological processes such as "epithelial cell proliferation" as well as subtype-specific processes (immune- and metabolic-related processes in subtype 1 and peptide-related processes in subtype 2). However, in the case of DEGs, no subtype-specific processes were seen. Additionally, PathExt central genes did better than DEGs on external validation datasets that were specific to HNSCC and included HNSCC-specific cancer driver genes, FDA-approved therapeutic targets, and pan-cancer tumor suppressor genes. Unlike DEGs, central genes exhibit significant expression in various cell types, enrichment for cancer hallmarks, and mutated protein systems. Central gene expression-based machine learning model shows better performance than DEGs in classifying responders/non-responders with 0.74 AUROC. Lastly, the top 10 potential therapeutic targets and drugs were proposed. Overall, we observed PathExt as a complementary approach to DEGs, characterizing common and HNSCC subtype-specific key genes associated with distinct HNSCC molecular subtypes.
Keywords: Cancer hallmarks; Differentially expressed genes; Head and neck cancer; Human papilloma virus; Network-based approach; Tumor heterogeneity.
© 2025. The Author(s).
Conflict of interest statement
Declarations. Competing interests: The authors declare no competing interests. Declaration of generative AI in scientific writing: During the preparation of this work the author do not used any AI or AI-assisted technologies to improve language and readability.
Figures
References
-
- Sung, H. et al. Global cancer statistics 2020: GLOBOCAN estimates of incidence and mortality worldwide for 36 cancers in 185 countries. CA Cancer J. Clin.71, 209–249 (2021). - PubMed
-
- Seiwert, T. Y. et al. Safety and clinical activity of pembrolizumab for treatment of recurrent or metastatic squamous cell carcinoma of the head and neck (KEYNOTE-012): An open-label, multicentre, phase 1b trial. Lancet Oncol.17, 956–965 (2016). - PubMed
-
- Vermorken, J. B. et al. Platinum-based chemotherapy plus cetuximab in head and neck cancer. N. Engl. J. Med.359, 1116–1127 (2008). - PubMed
MeSH terms
Substances
LinkOut - more resources
Full Text Sources
Medical
