. 2025 Aug 7;4(1):145.
doi: 10.1038/s44172-025-00481-8.

Supply-demand mismatch causes substantial deterioration in prehospital emergency medical service under disasters

Affiliations

Supply-demand mismatch causes substantial deterioration in prehospital emergency medical service under disasters

Weiyi Chen et al. Commun Eng. .

Abstract

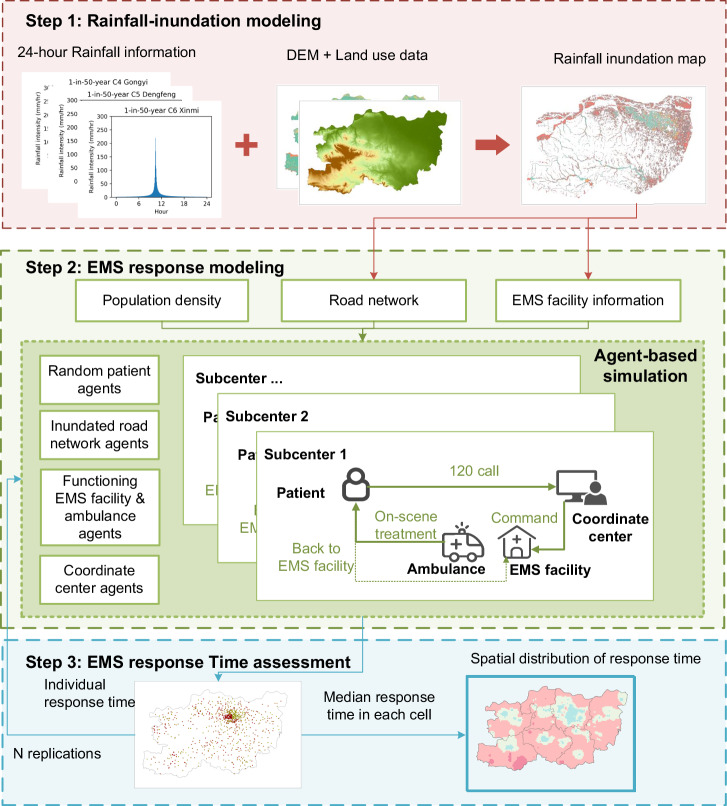
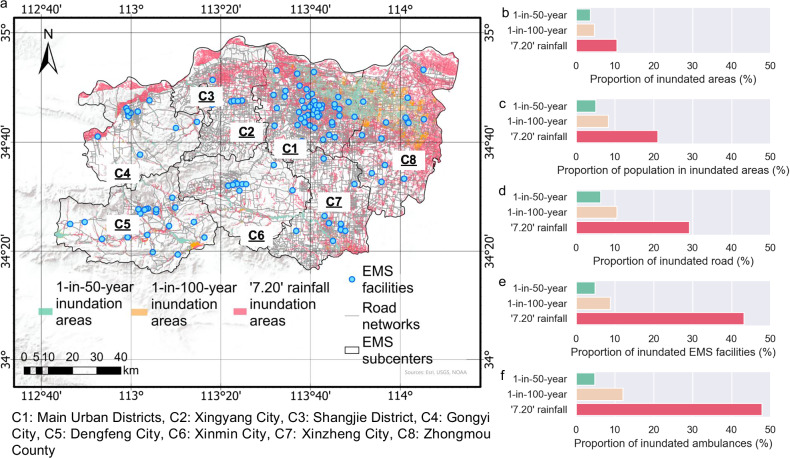
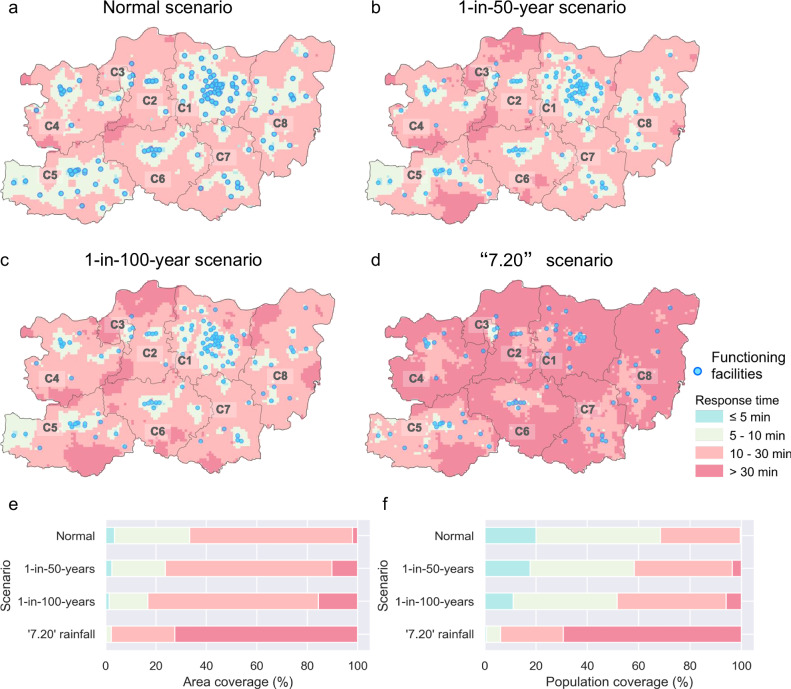
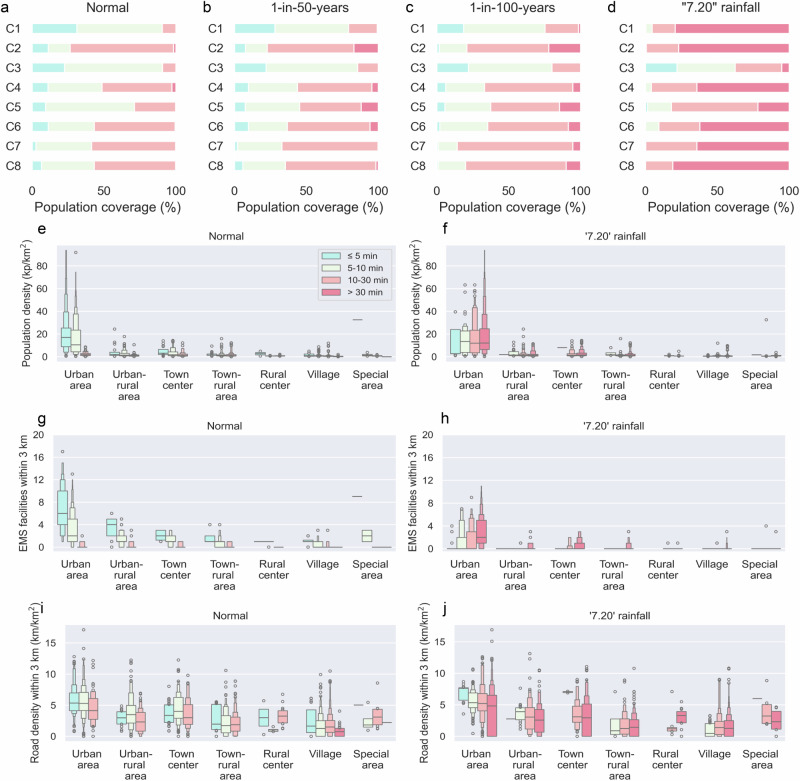
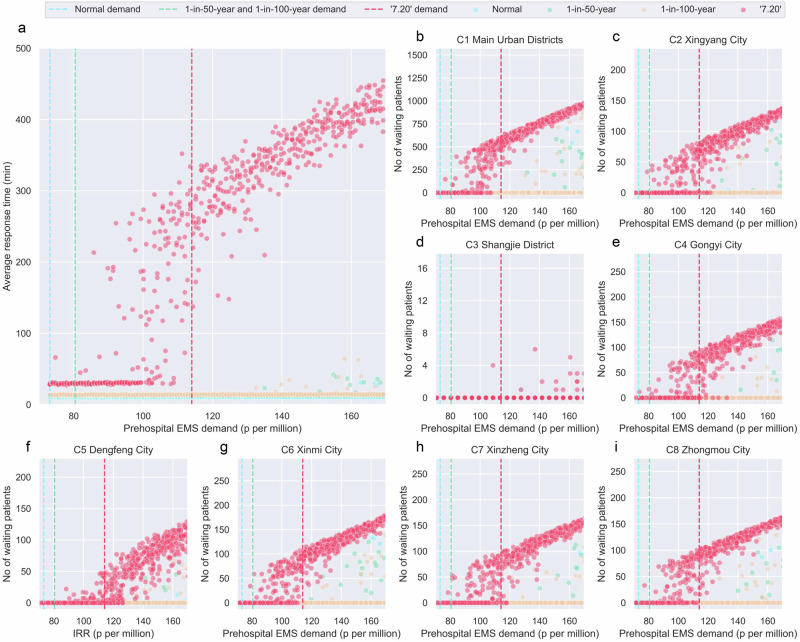
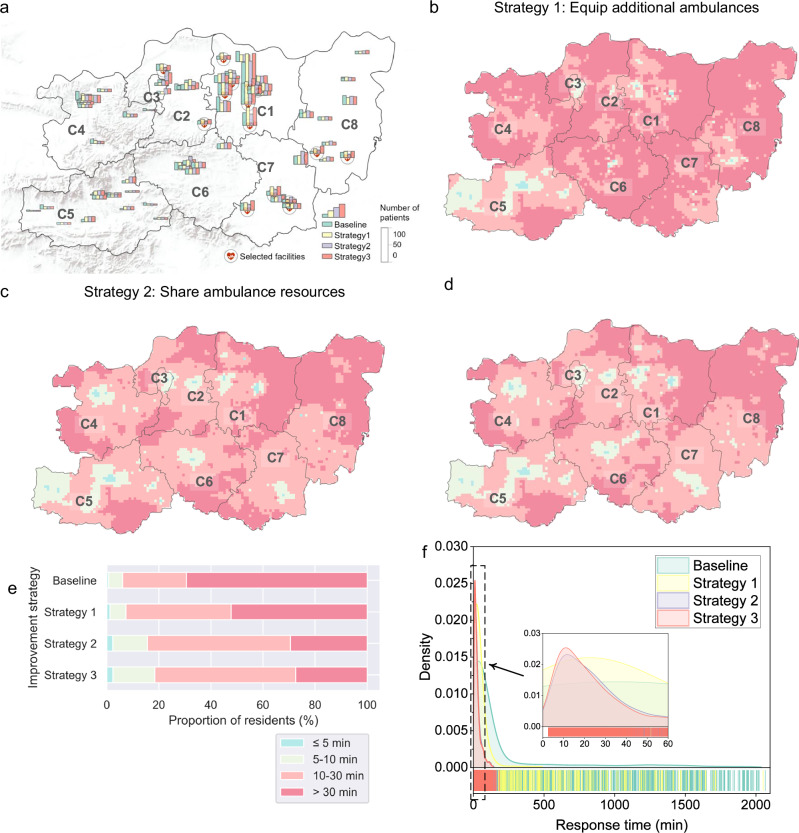
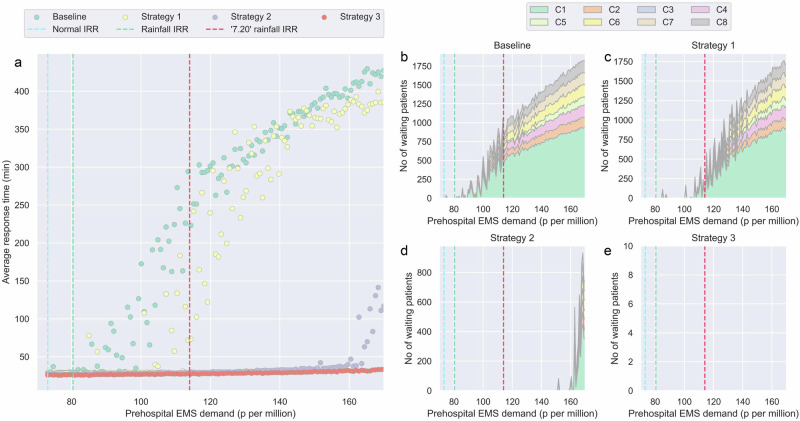
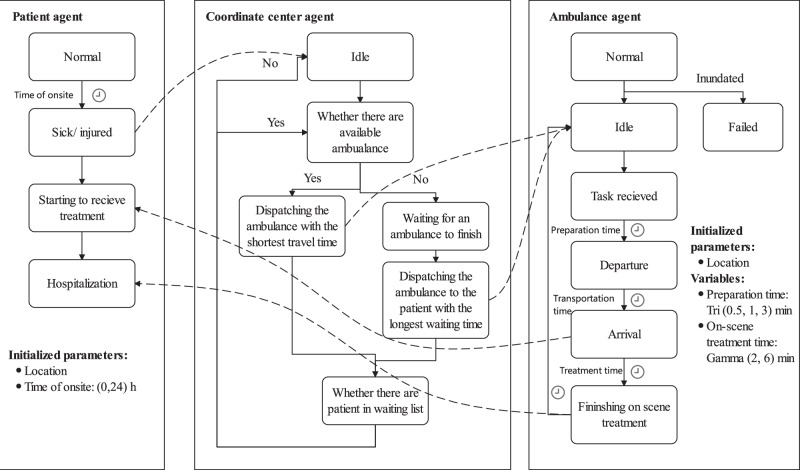
Floods severely disrupt prehospital emergency medical services (EMS), which dispatch medical personnel to deliver on-scene treatment, by hindering ambulance mobility and increasing medical demand. Here, we proposes a simulation-based framework that integrates flood inundation, EMS facility data, and population-weighted medical demand to assess regional EMS performance under different flood scenarios. Applied to Zhengzhou, China, the framework evaluates system responses during normal conditions, 1-in-50-year, 1-in-100-year floods, and the extreme "7.20" rainfall disaster. Results show dramatic increases in response times during "7.20", with resource shortages identified as a key delay factor. Three mitigation strategies are evaluated: adding ambulances, inter-subcenter ambulance sharing, and a hybrid approach. The results demonstrate that ambulance sharing outperforms limited ambulance additions, increasing 10-min and 30-min population coverage by 15.2% and 22.7%, respectively, while the hybrid approach achieves optimal improvement. The findings offer policy guidance for improving EMS resilience in flood-prone regions and support global urban disaster preparedness.


Conflict of interest statement

Competing interests: The authors declare no competing interests.

Figures

Fig. 1
Fig. 1
Flowchart of the proposed EMS response time assessment framework.
Fig. 2
Fig. 2. Rainfall inundation modeling results for Zhengzhou City.
a Simulated inundation map of Zhengzhou under the modeled rainfall scenarios. The proportion of affected areas and emergency medical resources under different scenarios: b Inundated areas, c Population in inundated areas, d Inundated roads, e Emergency stations, f Inundated ambulances.
Fig. 3
Fig. 3. Spatial distribution of response time of prehospital EMS system.
a Normal scenario, b 1-in-50-year scenario, c 1-in-100-year scenario, d ‘7.20’ scenario, and summary of coverage of different response capability grades for (e) areas, f population.
Fig. 4
Fig. 4. Spatial disparity of EMS different response capability at the subcenter level and village level.
Summary of response time population coverage under a Normal scenario, b 1-in-50-year scenario, c 1-in-100-year scenario, d “7.20” scenario. Enhanced box plots of indicators for response time and area types at the village level: Population density for e Normal scenario, f “7.20” scenario; EMS facilities within 3 km for g Normal scenario, h “7.20” scenario; Road density within 3 km for (i) Normal scenario, and j “7.20” scenario. Noted: The horizontal line in the largest box represents the median. The upper and lower bounds of the largest box represent the upper and lower quartiles, and the subsequent box connections respectively represent the eighth and sixteenth quantiles, and so on, up to the 128th quantile. Points outside the 128th percentile are regarded as outliers.
Fig. 5
Fig. 5. Sensitivity analysis of the prehospital medical demand on the response time and EMS supply capacity.
a Average response time versus prehospital medical demand. Sensitivity analysis of the prehospital medical demand number on the patients waiting under different scenarios for (b) C1 Main Urban districts, c C2 Dengfeng City, d C3 Gongyi City, e C4 Shangjie City, f C5 Xinmi City, g C6 Xinzheng City, h Xingyang City, i C8 Zhongmou City. Note: Dashed lines represent the estimated daily EMS demand rates under scenarios: normal, 1-in-50-year/1-in-100-year, and “7.20” event, as defined in the “Methods” section.
Fig. 6
Fig. 6. Performance of the prehospital EMS system in Zhengzhou with improvement strategies.
a Locations of selected EMS facilities for Strategy 1 and Strategy 3 and distributions of average number of patients accepted by facilities. Spatial distribution of prehospital EMS response time in Zhengzhou with b Strategy 1, c Strategy 2, d Strategy 3. e Summary of population coverage for different strategies. f Kernel density distribution of ambulance response time for different strategies.
Fig. 7
Fig. 7. Sensitivity analysis of prehospital EMS demand on the patient waiting cases under different strategies.
a Average response time versus prehospital EMS demand. The number of waiting patients versus prehospital EMS demand with b Baseline, c Strategy 1, d Strategy 2, e Strategy 3. Note: C1–C8 represent the eight EMS subcenters in Zhengzhou. Dashed lines represent the estimated daily EMS demand rates under scenarios: normal, 1-in-50-year/1-in-100-year, and “7.20” event, as defined in the “Methods” section.
Fig. 8
Fig. 8
Workflow of the proposed ABM model.

Similar articles

References

    1. Kim, K. & Oh, B. Prehospital triage in emergency medical services system: a scoping review. Int. Emerg. Nurs.69, 101293 (2023). - PubMed
    1. Majlesinasab, N., Maleki, M. & Nikbakhsh, E. Performance evaluation of an EMS system using queuing theory and location analysis: a case study. Am. J. Emerg. Med.51, 32–45 (2022). - PubMed
    1. Liu, K. Z., Zhai, C. H., Dong, Y. & Meng, X. H. Post-earthquake functionality assessment of urban road network considering emergency response. J. Earthq. Eng.27, 2406–2431 (2023).
    1. Darestani, Y. M., Webb, B., Padgett, J. E., Pennison, G. & Fereshtehnejad, E. Fragility analysis of coastal roadways and performance assessment of coastal transportation systems subjected to storm hazards. J. Perform. Constr. Facil.35, 04021088 (2021).
    1. Alabbad, Y., Mount, J., Campbell, A. M. & Demir, I. Assessment of transportation system disruption and accessibility to critical amenities during flooding: Iowa case study. Sci. Total Environ.793, 148476 (2021). - PubMed

LinkOut - more resources