

Complementary MR measures of white matter and their relation to cardiovascular health and cognition
- PMID: 40775500
- PMCID: PMC12332191
- DOI: 10.1038/s41598-025-13610-2
Complementary MR measures of white matter and their relation to cardiovascular health and cognition
Abstract
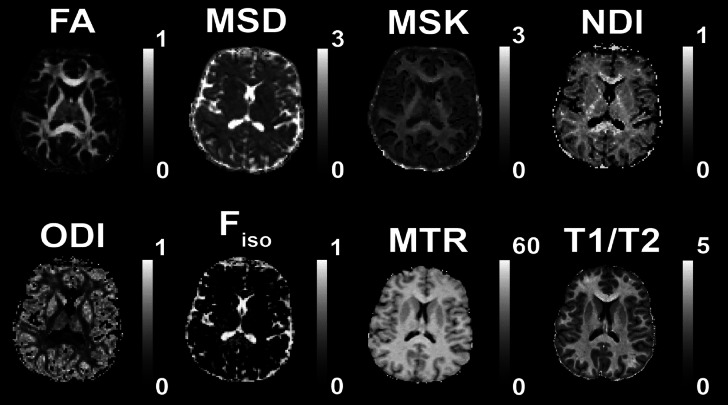
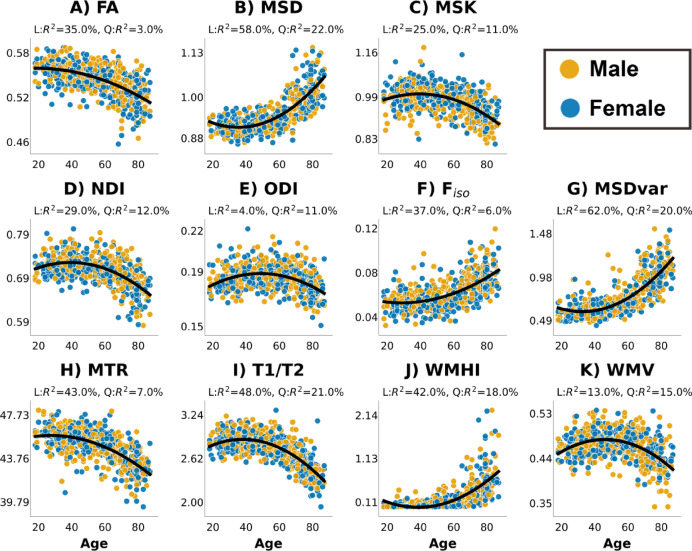
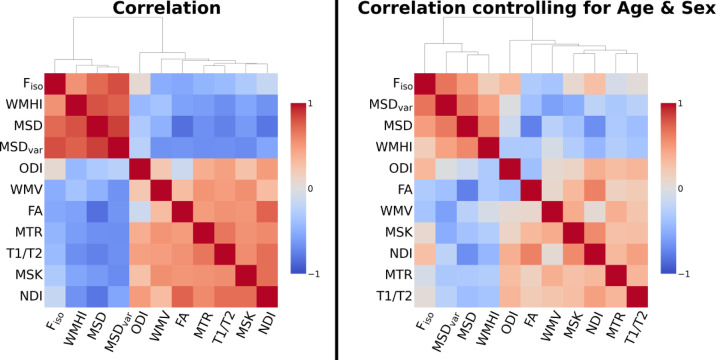
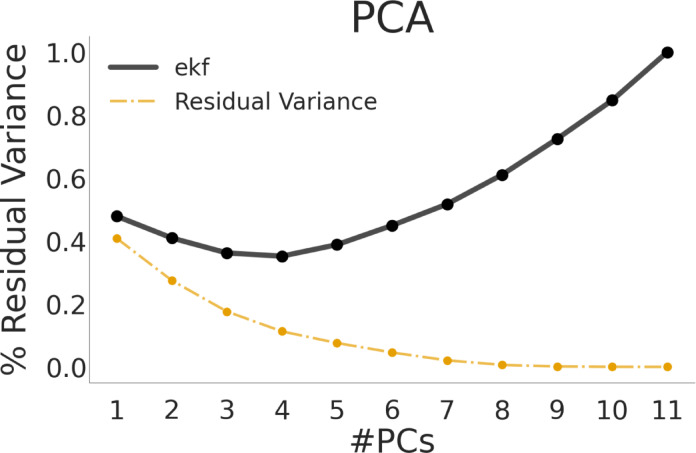
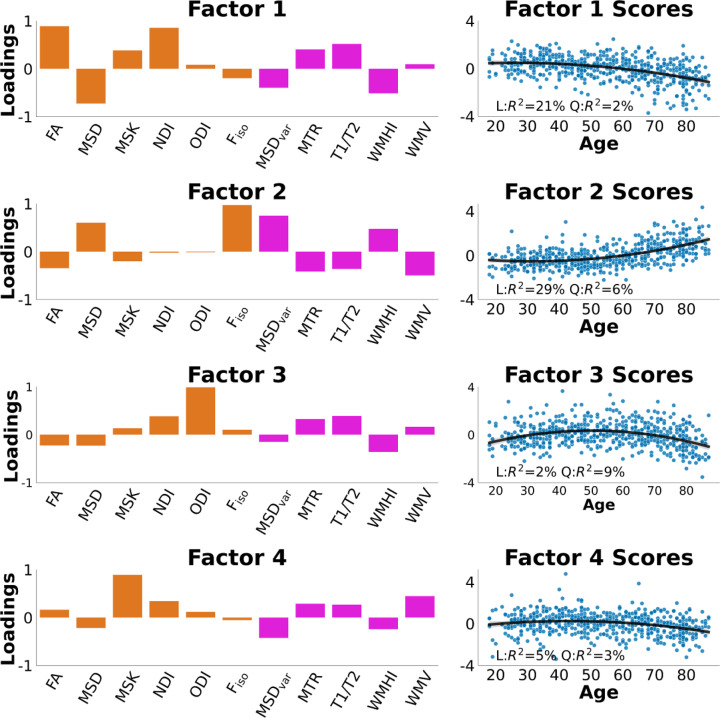
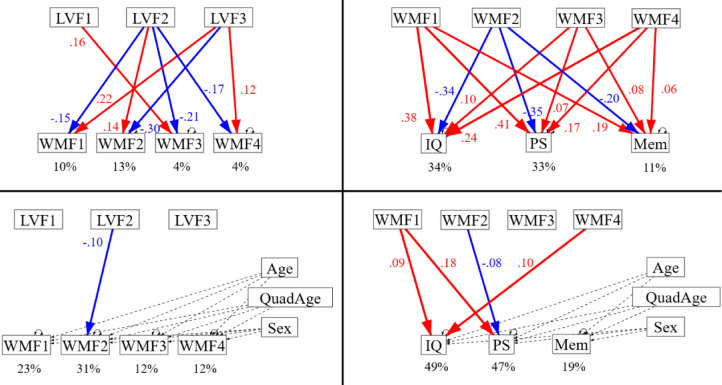
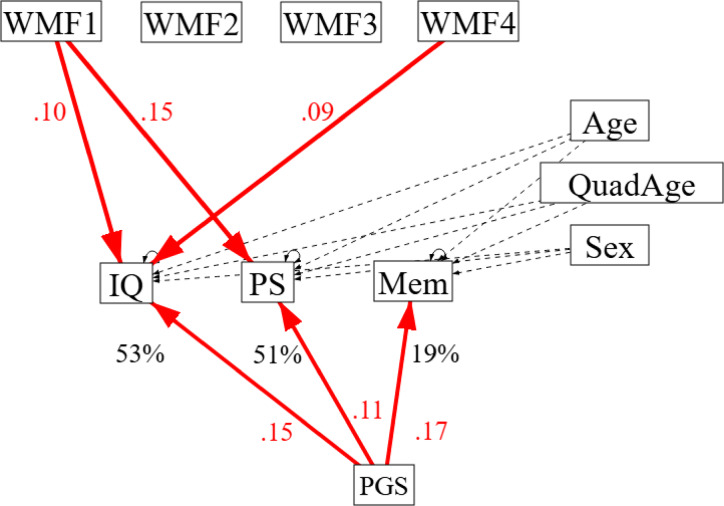
The microstructural and macrostructural integrity of white matter (WM) underpins efficient brain function, and is known to decline with age and vascular burden. Key aspects of WM health include axonal fibre density, myelination, free-water content, and the presence of tissue damage or lesions. Magnetic Resonance Imaging (MRI) offers multiple complementary sequences to non-invasively estimate these properties in vivo. For example, diffusion-weighted imaging (DWI) provides sensitive measures of microstructure, while T1-weighted and T2-weighted MRI can estimate total WM volume and hyper-intensities, and magnetisation transfer imaging (MT) and T1:T2 ratios can indicate myelin content. In this study, we leveraged all of these MRI-derived measures in a large population-based cohort (Cam-CAN) to identify latent WM factors and test how these factors relate to cardiovascular health and cognitive performance. Among 11 commonly-used WM metrics [Fractional Anisotropy (FA); Mean Signal Diffusion (MSD); Mean Signal Kurtosis (MSK); Neurite Density Index (NDI); fibre Orientation Dispersion Index (ODI); Free water volume faction (Fiso); spread of Mean Signal Diffusivity values (MSDvar); Magnetisation Transfer Ratio (MTR); T1:T2 ratio; volume of White Matter Hyper-Intensities (WMHI); White Matter Volume (WMV)], latent factor analysis showed that four factors were needed to explain 89% of the variance, which we interpreted in terms of (1) fibre density/myelination, (2) free-water / tissue damage, (3) fibre-crossing complexity and (4) microstructural complexity. These factors showed distinct effects of age and sex. To test the validity of these factors, we related them to measures of cardiovascular health and cognitive performance. Specifically, we ran path analyses linking (1) cardiovascular factors to the WM factors, and (2) the WM factors to cognitive measures. Even after adjusting for age and sex, we found that a vascular factor related to pulse pressure predicted the WM factor capturing free-water/tissue damage, and that several WM factors made unique predictions for fluid intelligence and processing speed. Our results show that there is both complementary and redundant information across common MR measures of WM, and their underlying latent factors may be useful for pinpointing the differential causes and contributions of white matter health in aging.
© 2025. The Author(s).
Conflict of interest statement
Declarations. Competing interests: The authors declare no competing interests. Author rights retention: For the purpose of open access, the author has applied a Creative Commons Attribution (CC BY) licence to any Author Accepted Manuscript version arising from this submission.
Figures
Similar articles
-
Unique information from common diffusion MRI models about white-matter differences across the human adult lifespan.Imaging Neurosci (Camb). 2023 Dec 21;1:imag-1-00051. doi: 10.1162/imag_a_00051. eCollection 2023. Imaging Neurosci (Camb). 2023. PMID: 40799710 Free PMC article.
-
Associations of Central Arterial Stiffness With Brain White Matter Integrity and Gray Matter Volume in MRI Across the Adult Lifespan.J Magn Reson Imaging. 2025 Jul;62(1):215-229. doi: 10.1002/jmri.29713. Epub 2025 Jan 10. J Magn Reson Imaging. 2025. PMID: 39792583 Free PMC article.
-
Characterizing the microstructural transition at the gray matter-white matter interface: Implementation and demonstration of age-associated differences.Neuroimage. 2025 Feb 1;306:121019. doi: 10.1016/j.neuroimage.2025.121019. Epub 2025 Jan 12. Neuroimage. 2025. PMID: 39809374 Free PMC article.
-
Translating state-of-the-art spinal cord MRI techniques to clinical use: A systematic review of clinical studies utilizing DTI, MT, MWF, MRS, and fMRI.Neuroimage Clin. 2015 Dec 4;10:192-238. doi: 10.1016/j.nicl.2015.11.019. eCollection 2016. Neuroimage Clin. 2015. PMID: 26862478 Free PMC article.
-
Behavioral interventions to reduce risk for sexual transmission of HIV among men who have sex with men.Cochrane Database Syst Rev. 2008 Jul 16;(3):CD001230. doi: 10.1002/14651858.CD001230.pub2. Cochrane Database Syst Rev. 2008. PMID: 18646068
References
MeSH terms
Grants and funding
LinkOut - more resources
Full Text Sources
Medical
Miscellaneous
