. 2025 Aug 7;23(1):877.
doi: 10.1186/s12967-025-06725-7.

Integrative multiomics analysis reveals the subtypes and key mechanisms of platinum resistance in gastric cancer: identification of KLF9 as a promising therapeutic target

Affiliations

Integrative multiomics analysis reveals the subtypes and key mechanisms of platinum resistance in gastric cancer: identification of KLF9 as a promising therapeutic target

Pengcheng Zhang et al. J Transl Med. .

Abstract

Background: Gastric cancer (GC) is characterized by significant intertumoral heterogeneity, which often leads to the development of resistance to platinum-based chemotherapy. Combining platinum drugs with other therapeutic strategies may improve treatment efficacy; however, the mechanisms underlying platinum resistance in GC remain unclear.

Methods: Key genes related to platinum resistance in GC were selected from the platinum resistance gene database and GC resistance datasets. The Similarity Network Fusion (SNF) algorithm was employed, along with prognosis-related methylation data and somatic mutation data, to classify the molecular subtypes of GC based on GC platinum resistance genes. Gene expression profiles, prognosis, immune cell infiltration, chemotherapy sensitivity, and immunotherapy responsiveness were comprehensively evaluated for each subtype. Localization and functional evaluation were conducted at the single-cell and spatial transcriptomics levels, and predictive models were developed using machine learning techniques. These functional differences in platinum resistance gene models were further explored in GC. Moreover, experimental validation was conducted to elucidate the mechanisms of key genes involved in platinum resistance in GC.

Results: Stomach adenocarcinoma (STAD) patients were classified into three subtypes using the SNF algorithm and multiomics data. Patients with subtype CS2 exhibited a significantly poorer prognosis than those with subtypes CS1 and CS3 (p < 0.05). Subtype CS1 was characterized as immune-deprived, CS2 as stroma-enriched, and CS3 as immune-enriched. Patients with subtype CS2 also exhibited the most adverse therapeutic responses to docetaxel, cisplatin, and gemcitabine. Single-cell analysis revealed high enrichment of M1 module cells with elevated expression of resistance genes, including the transcription factor KLF9. Spatial transcriptomic analysis further confirmed the independent spatial distribution of malignant cells with high expression of drug resistance genes (DRGs). Predictive models based on machine learning demonstrated excellent prognostic performance. Patients in the high DRG group also exhibited poorer responses to immunotherapy. Cellular experiments revealed that KLF9 overexpression significantly inhibited the proliferation of AGS cells (p < 0.05), reduced their resistance to platinum-based drugs, and markedly decreased the levels of inflammatory cytokines in them.

Conclusion: KLF9 was identified as a promising therapeutic target for overcoming platinum resistance in GC, warranting further investigation into its role and potential clinical applications.

Keywords: KLF9; Gastric cancer; Platinum resistance; Similarity network fusion; Spatial transcriptomics.


Conflict of interest statement

Declarations. Ethics approval and consent to participate: Not applicable. Consent for publication: Not applicable. Competing interests: The authors declare no conflict of interest.

Figures

Fig. 1
Fig. 1
Flowchart of the present study
Fig. 2
Fig. 2
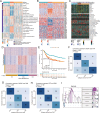
Multiomics-based identification of subgroups related to platinum resistance in GC. A Venn diagram of key genes related to platinum resistance in GC; B Heatmap of the matrix of platinum resistance–related genes showing differential expression, prognosis-related methylation sites, and top 50 somatic mutation sites; C Clustering of patients based on the integration of 10 multiomics clustering algorithms; D Consensus clustering matrix of the three prognostic subtypes based on the 10 algorithms; E Survival curves illustrating the differences among the three GC subtypes
Fig. 3
Fig. 3
Biological functional differences among the three GC subtypes. A Subgroup enrichment analysis of GC-related biological pathways; B Regulatory activity profiles of 23 transcription factors (TFs) (top) and potential chromatin remodeling regulators associated with the three GC subtypes (bottom); C Immune characteristics in the TCGA-STAD cohort. The annotations at the top of the heatmap show immune enrichment scores for tumor-infiltrating lymphocytes and stromal enrichment scores, whereas those at the bottom indicate the enrichment levels for immune cells related to the tumor microenvironment; D Validation of the GC subtype classification in the META-STAD cohort; E Survival analysis of CSs in the META-STAD cohort; F, G Analysis of the consistency of CS data with NTP (F) and PAM (G) results in the TCGA-STAD cohort; H Analysis of the consistency of NTP results with PAM results in the META-STAD cohort; I GSEA enrichment analysis of the CS2 subgroup
Fig. 4
Fig. 4
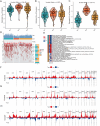
Drug prediction and mutation analysis of GC subtypes. (A-C) CS2 shows the poorest sensitivity to cisplatin (A), docetaxel (B), and gemcitabine (C). D Differences in the genomic landscape of the three CS subtypes (from top to bottom), shown by tumor mutation burdens (TMBs), relative contributions of four mutation signatures, and selected differentially mutated genes; E GSEA differential enrichment analysis of the three CS subtypes; F–H CNV GISTIC score mutation profile for CS1 (F), CS2 (G), and CS3 (H)
Fig. 5
Fig. 5
Single-cell landscape of GC. A Dot plot for single-cell annotation; B UMAP of single-cell subtypes; C Heatmap of marker genes for each cell type; D Dot plot for the platinum resistance gene set scoring in single cells
Fig. 6
Fig. 6
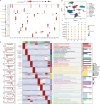
Identification of key modules for platinum resistance. A Identification of key malignant cell subpopulations using cNMF. B Bipartite heatmap displaying differences in the activities of identified transcription factors across groups. The top 15 regulators with the highest regulator-specific score are plotted for each module. The proportion of active regulators differed by at least 20% between groups, and the AUC score differences of the regulator-specific scores between groups are significant. C Violin plot of DRG scoring. D Differences in distribution between the high- and low-resistance DRGs as revealed by the R/O index. E Top 10 differential transcription factors in M1–6 modules
Fig. 7
Fig. 7
Differences in cell communication between subpopulations with high and low drug resistance. A Differences in cell communication based on ligand pair counts. This panel highlights the differences in the number of ligand–receptor pairs involved in cell communication between subpopulations with high and low drug resistance. B Differences in the strength of cell communication pathways between subpopulations with high and low drug resistance. This panel shows how the intensities of communication pathways vary between the two groups. C Heatmap of cell communication showing the differential expression of communication pathways between subpopulations with high and low drug resistance, highlighting key differences in cellular interactions. D Ligand-based cell communication in malignant cells. This panel shows the ligand expression patterns in malignant cells acting as ligands in cell communication, highlighting the significant ligands involved in interactions between malignant cells with high drug resistance and other cell types. E Receptor-based cell communication in malignant cells. This plot shows the expression of receptor-related ligands in malignant cells acting as receptors in cell communication, emphasizing interactions between malignant cells with high drug resistance and endothelial cells
Fig. 8
Fig. 8
Immune factor regulation and spatial localization of subpopulations with high and low drug resistance. A Regulation of immune modulatory factors. From left to right: mRNA expression; relationship between expression and methylation; amplification frequency; and deletion frequency of 75 immune subtype genes. B Spatial distribution heatmap of malignant cells with high drug resistance in the GSM7990475 sample. C Spatial distribution of cell subpopulations in the GSM7990475 sample. D Spatial distribution heatmap of malignant cells with high drug resistance in the GSM7990482 sample. E Spatial distribution of cell subpopulations in the GSM7990482 sample
Fig. 9
Fig. 9
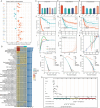
Construction of the prognostic model and evaluation of its performance. A Forest plot of prognosis-related genes, with risk-associated genes and protective genes indicated in red and blue, respectively. B Screening of the optimal predictive model using 101 different algorithms. C–E Comparison of the C-index values of the models based on the TCGA dataset (C), GSE62254 dataset (D), and GSE15459 dataset (E). F–H Kaplan–Meier survival curves for high- and low-risk groups based on the TCGA dataset (F), GSE62254 dataset (G), and GSE15459 dataset (H). I AUC scores of the selected model at 1, 3, and 5 years. J Restricted cubic spline plot demonstrating HR in the Cox proportional hazards model as a function of continuous variables. K Decision curve analysis of the model. L–N Calibration curve for the model and other clinical factors at 1 year (L), 3 years (M), and 5 years (N). O Prognostic nomogram for survival prediction. (*p < 0.05, **p < 0.01, ***p < 0.001, ****p < 0.0001)
Fig. 10
Fig. 10
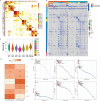
Immunotherapy and drug response predictions. A Overall survival (OS) is significantly worse in the high DRG group within the IMvigor210 cohort. B Prognosis is poorer for the high DRG group at disease stages I–II (C) and stages III–IV (D) in the IMvigor210 cohort. Differences in immunotherapy response rates between the high and low DRG groups in the IMvigor210 cohort. E Bar chart illustrating immunotherapy response rates in the high- and low DRG groups within the IMvigor210 cohort. F Submap-based prediction of immunotherapy responses in the high- and low DRG groups. G, H Drug response predictions based on the CTRP database (G) and PRISM database (H)
Fig. 11
Fig. 11
Functional enrichment and immune infiltration analysis. A Pancancer functional enrichment analysis based on the model. B Functional enrichment analysis for a single gene. C Immune infiltration analysis for a single gene. D Spatial distribution heatmap of KLF9 + malignant cells in the GSM7990482 sample. E Spatial distribution of KLF9 + cell subpopulations in the GSM7990482 sample
Fig. 12
Fig. 12
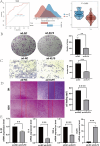
Overexpression of KLF9 inhibits GC progression. A Expression and diagnostic value of KLF9. B–D Plate cloning experiment (B), Transwell assay (C), and cell scratch assay (D) revealing the effect of KLF9 overexpression on GC. E KLF9 overexpression inhibits the expression of chronic inflammatory factors

Similar articles

References

    1. Andreatta M, Carmona SJ. UCell: robust and scalable single-cell gene signature scoring. Comput Struct Biotechnol J. 2021;19:3796–8. - PMC - PubMed
    1. Augustin HG, Koh GY. A systems view of the vascular endothelium in health and disease. Cell. 2024;187:4833–58. - PubMed
    1. Bai X, Jiang X, Liu Y, Wang Y, Jiang X, Song G, Qiu H, Zhang Q. Kruppel-like factor 9 upregulates E-cadherin transcription and represses breast cancer invasion and metastasis. Am J Cancer Res. 2021;11:3660–73. - PMC - PubMed
    1. Barbie DA, Tamayo P, Boehm JS, Kim SY, Moody SE, Dunn IF, Schinzel AC, Sandy P, Meylan E, Scholl C, Frohling S, Chan EM, Sos ML, Michel K, Mermel C, Silver SJ, Weir BA, Reiling JH, Sheng Q, Gupta PB, Wadlow RC, Le H, Hoersch S, Wittner BS, Ramaswamy S, Livingston DM, Sabatini DM, Meyerson M, Thomas RK, Lander ES, Mesirov JP, Root DE, Gilliland DG, Jacks T, Hahn WC. Systematic RNA interference reveals that oncogenic KRAS-driven cancers require TBK1. Nature. 2009;462:108–12. - PMC - PubMed
    1. Becht E, Giraldo NA, Lacroix L, Buttard B, Elarouci N, Petitprez F, Selves J, Laurent-Puig P, Sautes-Fridman C, Fridman WH, de Reynies A. Estimating the population abundance of tissue-infiltrating immune and stromal cell populations using gene expression. Genome Biol. 2016;17:218. - PMC - PubMed

MeSH terms

Substances

LinkOut - more resources